
|
|||||
|
 | |
| |
| |
| |
| |
| |
|
Gene: DRG2 |
Gene summary for DRG2 |
| Gene information | Species | Human | Gene symbol | DRG2 | Gene ID | 1819 |
| Gene name | developmentally regulated GTP binding protein 2 | |
| Gene Alias | DRG2 | |
| Cytomap | 17p11.2 | |
| Gene Type | protein-coding | GO ID | GO:0002181 | UniProtAcc | A8MZF9 |
Top |
Malignant transformation analysis |
| Identification of the aberrant gene expression in precancerous and cancerous lesions by comparing the gene expression of stem-like cells in diseased tissues with normal stem cells |
| Entrez ID | Symbol | Replicates | Species | Organ | Tissue | Adj P-value | Log2FC | Malignancy |
| 1819 | DRG2 | LZE2D | Human | Esophagus | HGIN | 3.88e-02 | 2.72e-01 | 0.0642 |
| 1819 | DRG2 | LZE4T | Human | Esophagus | ESCC | 1.25e-06 | 2.12e-01 | 0.0811 |
| 1819 | DRG2 | LZE5T | Human | Esophagus | ESCC | 3.68e-02 | 2.02e-01 | 0.0514 |
| 1819 | DRG2 | LZE7T | Human | Esophagus | ESCC | 4.25e-11 | 4.27e-01 | 0.0667 |
| 1819 | DRG2 | LZE8T | Human | Esophagus | ESCC | 6.61e-07 | 2.26e-01 | 0.067 |
| 1819 | DRG2 | LZE20T | Human | Esophagus | ESCC | 5.71e-08 | 1.91e-01 | 0.0662 |
| 1819 | DRG2 | LZE22D1 | Human | Esophagus | HGIN | 3.57e-13 | 3.11e-01 | 0.0595 |
| 1819 | DRG2 | LZE22T | Human | Esophagus | ESCC | 6.41e-10 | 4.89e-01 | 0.068 |
| 1819 | DRG2 | LZE24T | Human | Esophagus | ESCC | 1.42e-25 | 6.73e-01 | 0.0596 |
| 1819 | DRG2 | LZE6T | Human | Esophagus | ESCC | 1.85e-03 | 2.47e-01 | 0.0845 |
| 1819 | DRG2 | P1T-E | Human | Esophagus | ESCC | 6.18e-11 | 5.50e-01 | 0.0875 |
| 1819 | DRG2 | P2T-E | Human | Esophagus | ESCC | 7.61e-26 | 4.96e-01 | 0.1177 |
| 1819 | DRG2 | P4T-E | Human | Esophagus | ESCC | 2.24e-29 | 6.28e-01 | 0.1323 |
| 1819 | DRG2 | P5T-E | Human | Esophagus | ESCC | 3.12e-13 | 2.41e-01 | 0.1327 |
| 1819 | DRG2 | P8T-E | Human | Esophagus | ESCC | 3.09e-25 | 5.29e-01 | 0.0889 |
| 1819 | DRG2 | P9T-E | Human | Esophagus | ESCC | 4.89e-22 | 4.51e-01 | 0.1131 |
| 1819 | DRG2 | P10T-E | Human | Esophagus | ESCC | 1.88e-28 | 3.94e-01 | 0.116 |
| 1819 | DRG2 | P11T-E | Human | Esophagus | ESCC | 6.69e-22 | 6.03e-01 | 0.1426 |
| 1819 | DRG2 | P12T-E | Human | Esophagus | ESCC | 5.70e-35 | 6.46e-01 | 0.1122 |
| 1819 | DRG2 | P15T-E | Human | Esophagus | ESCC | 1.39e-14 | 3.22e-01 | 0.1149 |
| Page: 1 2 3 4 5 |
| Tissue | Expression Dynamics | Abbreviation |
| Esophagus | 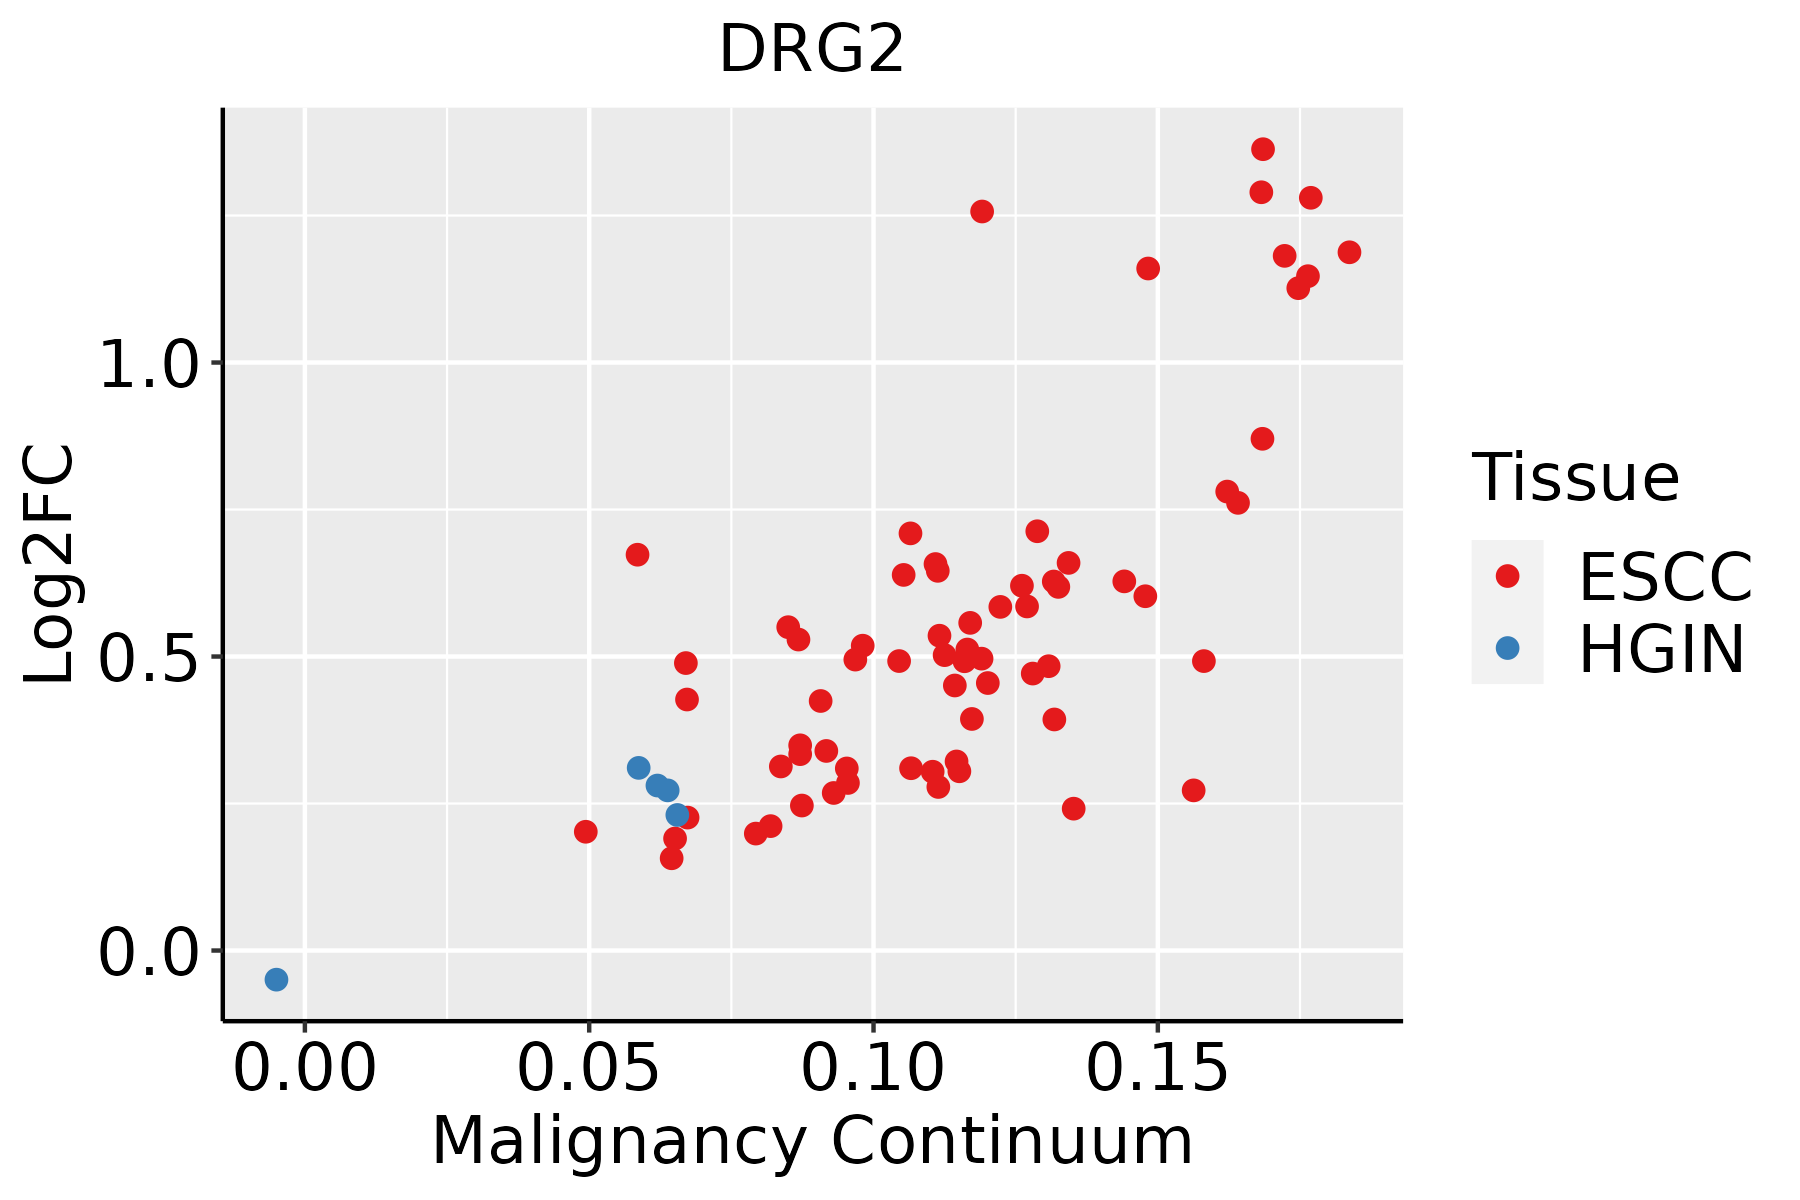 | ESCC: Esophageal squamous cell carcinoma |
| HGIN: High-grade intraepithelial neoplasias | ||
| LGIN: Low-grade intraepithelial neoplasias | ||
| Liver | 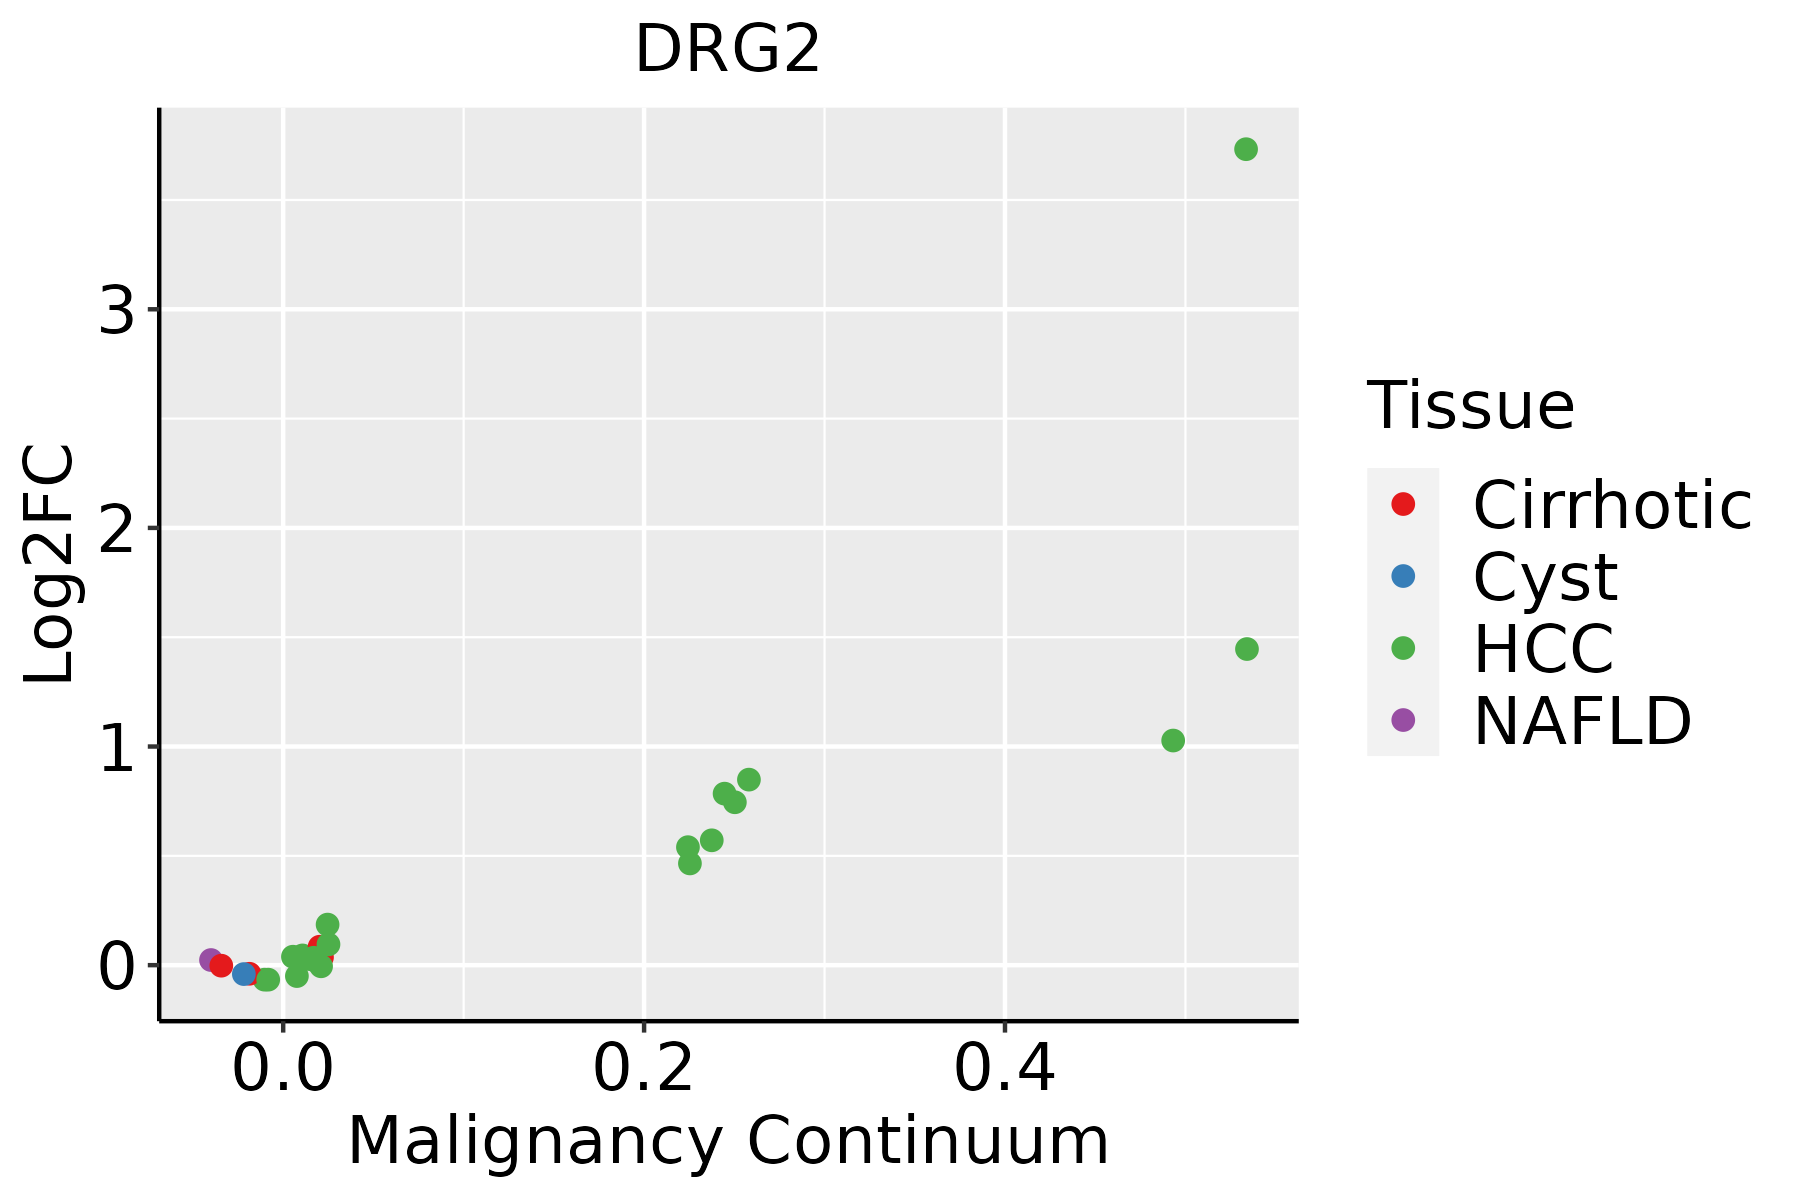 | HCC: Hepatocellular carcinoma |
| NAFLD: Non-alcoholic fatty liver disease | ||
| Oral Cavity | 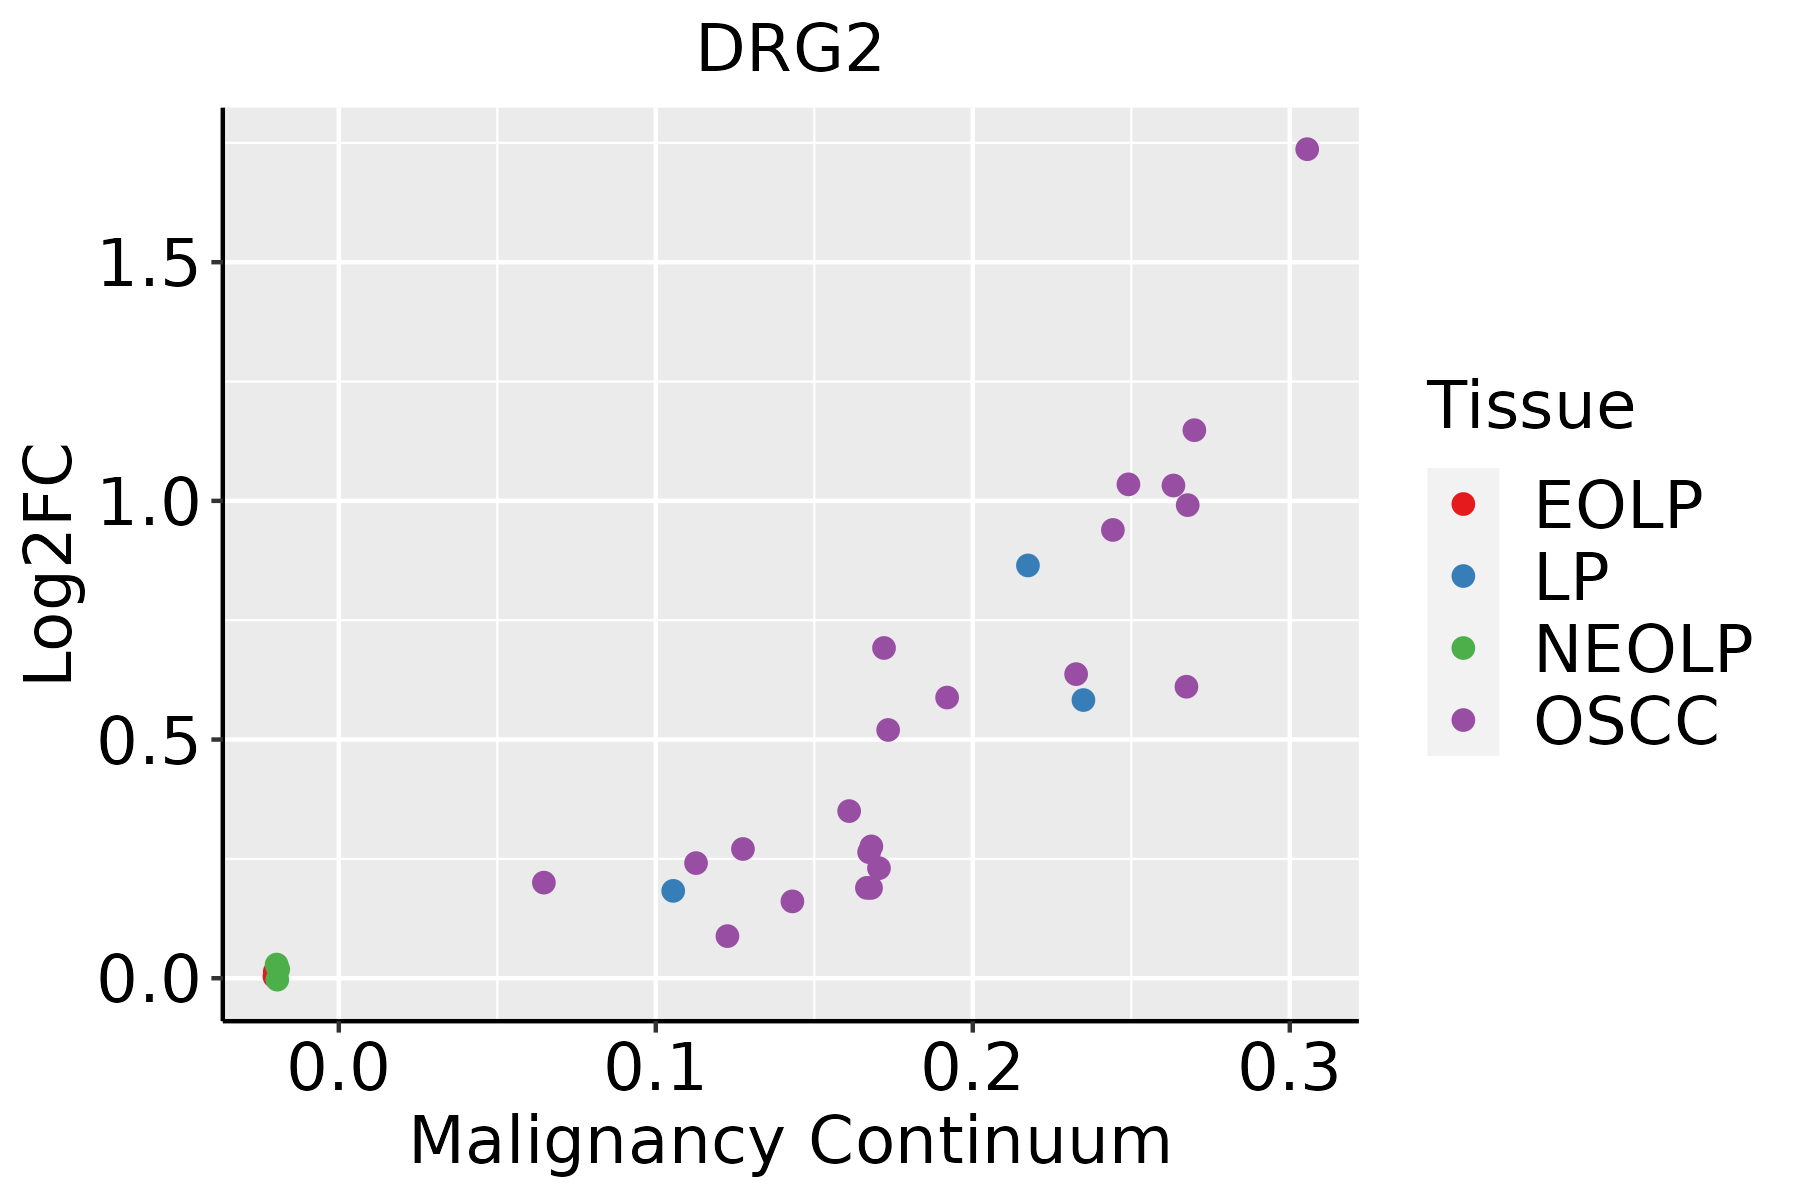 | EOLP: Erosive Oral lichen planus |
| LP: leukoplakia | ||
| NEOLP: Non-erosive oral lichen planus | ||
| OSCC: Oral squamous cell carcinoma | ||
| Skin |  | AK: Actinic keratosis |
| cSCC: Cutaneous squamous cell carcinoma | ||
| SCCIS:squamous cell carcinoma in situ |
| ∗log2FC in expression of this searched gene in stem-like cells from each diseased tissue sample relative to stem-like cells in normal samples in each tissue plotted against the malignancy continuum. Samples are colored based on if they are from different disease stage. |
Top |
Malignant transformation related pathway analysis |
| Find out the enriched GO biological processes and KEGG pathways involved in transition from healthy to precancer to cancer |
| Tissue | Disease Stage | Enriched GO biological Processes |
| Colorectum | AD |  |
| Colorectum | SER |  |
| Colorectum | MSS |  |
| Colorectum | MSI-H |  |
| Colorectum | FAP |  |
| ∗Top 15 enriched GO BP terms are showed in the bar plot of each disease state in each tissue. Each row represents a significant GO biological process which is colored according to the -log10(p.adjust). |
| Page: 1 2 3 4 5 6 7 8 9 |
| GO ID | Tissue | Disease Stage | Description | Gene Ratio | Bg Ratio | pvalue | p.adjust | Count |
| GO:00217629 | Breast | Precancer | substantia nigra development | 15/1080 | 44/18723 | 1.12e-08 | 7.98e-07 | 15 |
| GO:00309018 | Breast | Precancer | midbrain development | 20/1080 | 90/18723 | 1.50e-07 | 7.93e-06 | 20 |
| GO:00488578 | Breast | Precancer | neural nucleus development | 16/1080 | 64/18723 | 4.76e-07 | 2.11e-05 | 16 |
| GO:002176214 | Breast | IDC | substantia nigra development | 18/1434 | 44/18723 | 1.11e-09 | 1.07e-07 | 18 |
| GO:004885713 | Breast | IDC | neural nucleus development | 21/1434 | 64/18723 | 5.35e-09 | 4.28e-07 | 21 |
| GO:003090112 | Breast | IDC | midbrain development | 24/1434 | 90/18723 | 4.35e-08 | 2.87e-06 | 24 |
| GO:00703713 | Breast | IDC | ERK1 and ERK2 cascade | 43/1434 | 330/18723 | 4.28e-04 | 5.84e-03 | 43 |
| GO:00486592 | Breast | IDC | smooth muscle cell proliferation | 26/1434 | 184/18723 | 1.77e-03 | 1.72e-02 | 26 |
| GO:00703733 | Breast | IDC | negative regulation of ERK1 and ERK2 cascade | 14/1434 | 78/18723 | 2.21e-03 | 2.06e-02 | 14 |
| GO:00486602 | Breast | IDC | regulation of smooth muscle cell proliferation | 25/1434 | 180/18723 | 2.71e-03 | 2.41e-02 | 25 |
| GO:00703722 | Breast | IDC | regulation of ERK1 and ERK2 cascade | 37/1434 | 309/18723 | 4.53e-03 | 3.49e-02 | 37 |
| GO:002176223 | Breast | DCIS | substantia nigra development | 17/1390 | 44/18723 | 5.72e-09 | 4.76e-07 | 17 |
| GO:004885723 | Breast | DCIS | neural nucleus development | 20/1390 | 64/18723 | 1.87e-08 | 1.29e-06 | 20 |
| GO:003090122 | Breast | DCIS | midbrain development | 23/1390 | 90/18723 | 1.10e-07 | 5.93e-06 | 23 |
| GO:007037111 | Breast | DCIS | ERK1 and ERK2 cascade | 41/1390 | 330/18723 | 8.11e-04 | 9.32e-03 | 41 |
| GO:007037311 | Breast | DCIS | negative regulation of ERK1 and ERK2 cascade | 14/1390 | 78/18723 | 1.65e-03 | 1.64e-02 | 14 |
| GO:004865911 | Breast | DCIS | smooth muscle cell proliferation | 25/1390 | 184/18723 | 2.42e-03 | 2.18e-02 | 25 |
| GO:004866011 | Breast | DCIS | regulation of smooth muscle cell proliferation | 24/1390 | 180/18723 | 3.74e-03 | 3.01e-02 | 24 |
| GO:0016055 | Colorectum | AD | Wnt signaling pathway | 130/3918 | 444/18723 | 1.60e-05 | 3.37e-04 | 130 |
| GO:0198738 | Colorectum | AD | cell-cell signaling by wnt | 130/3918 | 446/18723 | 2.02e-05 | 4.10e-04 | 130 |
| Page: 1 2 3 4 |
| Pathway ID | Tissue | Disease Stage | Description | Gene Ratio | Bg Ratio | pvalue | p.adjust | qvalue | Count |
| Page: 1 |
Top |
Cell-cell communication analysis |
| Identification of potential cell-cell interactions between two cell types and their ligand-receptor pairs for different disease states |
| Ligand | Receptor | LRpair | Pathway | Tissue | Disease Stage |
| Page: 1 |
Top |
Single-cell gene regulatory network inference analysis |
| Find out the significant the regulons (TFs) and the target genes of each regulon across cell types for different disease states |
| TF | Cell Type | Tissue | Disease Stage | Target Gene | RSS | Regulon Activity |
| ∗The dot plots of a searched regulon are shown for all cell subpopulations in each disease state of each tissue based on the regulon specific score inferred using pySCENIC and by calculating the average expression. |
| Page: 1 |
Top |
Somatic mutation of malignant transformation related genes |
| Annotation of somatic variants for genes involved in malignant transformation |
| Hugo Symbol | Variant Class | Variant Classification | dbSNP RS | HGVSc | HGVSp | HGVSp Short | SWISSPROT | BIOTYPE | SIFT | PolyPhen | Tumor Sample Barcode | Tissue | Histology | Sex | Age | Stage | Therapy Types | Drugs | Outcome |
| DRG2 | SNV | Missense_Mutation | c.190N>T | p.Arg64Cys | p.R64C | P55039 | protein_coding | deleterious(0) | probably_damaging(1) | TCGA-BR-6452-01 | Stomach | stomach adenocarcinoma | Female | >=65 | I/II | Unknown | Unknown | SD | |
| DRG2 | SNV | Missense_Mutation | c.193G>A | p.Val65Met | p.V65M | P55039 | protein_coding | deleterious(0.01) | probably_damaging(0.984) | TCGA-BR-7851-01 | Stomach | stomach adenocarcinoma | Male | >=65 | I/II | Unknown | Unknown | SD | |
| DRG2 | SNV | Missense_Mutation | c.113G>T | p.Arg38Leu | p.R38L | P55039 | protein_coding | deleterious(0) | probably_damaging(0.998) | TCGA-BR-8372-01 | Stomach | stomach adenocarcinoma | Male | <65 | III/IV | Chemotherapy | etoposide | CR | |
| DRG2 | SNV | Missense_Mutation | novel | c.625N>A | p.Glu209Lys | p.E209K | P55039 | protein_coding | deleterious(0) | benign(0.306) | TCGA-BR-8680-01 | Stomach | stomach adenocarcinoma | Male | <65 | III/IV | Chemotherapy | oxaliplatin | CR |
| DRG2 | SNV | Missense_Mutation | novel | c.752N>C | p.Ile251Thr | p.I251T | P55039 | protein_coding | deleterious(0.02) | benign(0.011) | TCGA-CG-5721-01 | Stomach | stomach adenocarcinoma | Male | <65 | III/IV | Unknown | Unknown | SD |
| DRG2 | SNV | Missense_Mutation | c.718N>T | p.Pro240Ser | p.P240S | P55039 | protein_coding | deleterious(0.02) | benign(0.01) | TCGA-HU-A4G8-01 | Stomach | stomach adenocarcinoma | Female | >=65 | I/II | Chemotherapy | 5-fluorouracil | SD | |
| DRG2 | SNV | Missense_Mutation | c.113N>T | p.Arg38Leu | p.R38L | P55039 | protein_coding | deleterious(0) | probably_damaging(0.998) | TCGA-MX-A5UJ-01 | Stomach | stomach adenocarcinoma | Female | >=65 | III/IV | Unknown | Unknown | SD | |
| DRG2 | SNV | Missense_Mutation | novel | c.505C>A | p.Arg169Ser | p.R169S | P55039 | protein_coding | deleterious(0) | probably_damaging(1) | TCGA-E8-A2EA-01 | Thyroid | thyroid carcinoma | Female | <65 | I/II | Unknown | Unknown | SD |
| Page: 1 2 3 |
Top |
Related drugs of malignant transformation related genes |
| Identification of chemicals and drugs interact with genes involved in malignant transfromation |
| (DGIdb 4.0) |
| Entrez ID | Symbol | Category | Interaction Types | Drug Claim Name | Drug Name | PMIDs |
| Page: 1 |

Copyright 2023-Present -The University of Texas Health Science Center at Houston |