
|
|||||
|
 | |
| |
| |
| |
| |
| |
|
Gene: CD8A |
Gene summary for CD8A |
| Gene information | Species | Human | Gene symbol | CD8A | Gene ID | 925 |
| Gene name | CD8a molecule | |
| Gene Alias | CD8 | |
| Cytomap | 2p11.2 | |
| Gene Type | protein-coding | GO ID | GO:0001775 | UniProtAcc | P01732 |
Top |
Malignant transformation analysis |
| Identification of the aberrant gene expression in precancerous and cancerous lesions by comparing the gene expression of stem-like cells in diseased tissues with normal stem cells |
| Entrez ID | Symbol | Replicates | Species | Organ | Tissue | Adj P-value | Log2FC | Malignancy |
| 925 | CD8A | C21 | Human | Oral cavity | OSCC | 1.02e-07 | 3.10e-01 | 0.2678 |
| 925 | CD8A | C38 | Human | Oral cavity | OSCC | 1.52e-05 | 1.15e+00 | 0.172 |
| 925 | CD8A | C46 | Human | Oral cavity | OSCC | 1.67e-08 | 2.12e-01 | 0.1673 |
| 925 | CD8A | C06 | Human | Oral cavity | OSCC | 1.28e-06 | 5.27e-01 | 0.2699 |
| 925 | CD8A | LN22 | Human | Oral cavity | OSCC | 1.09e-03 | 6.49e-01 | 0.1733 |
| Page: 1 |
| Tissue | Expression Dynamics | Abbreviation |
| Oral Cavity | 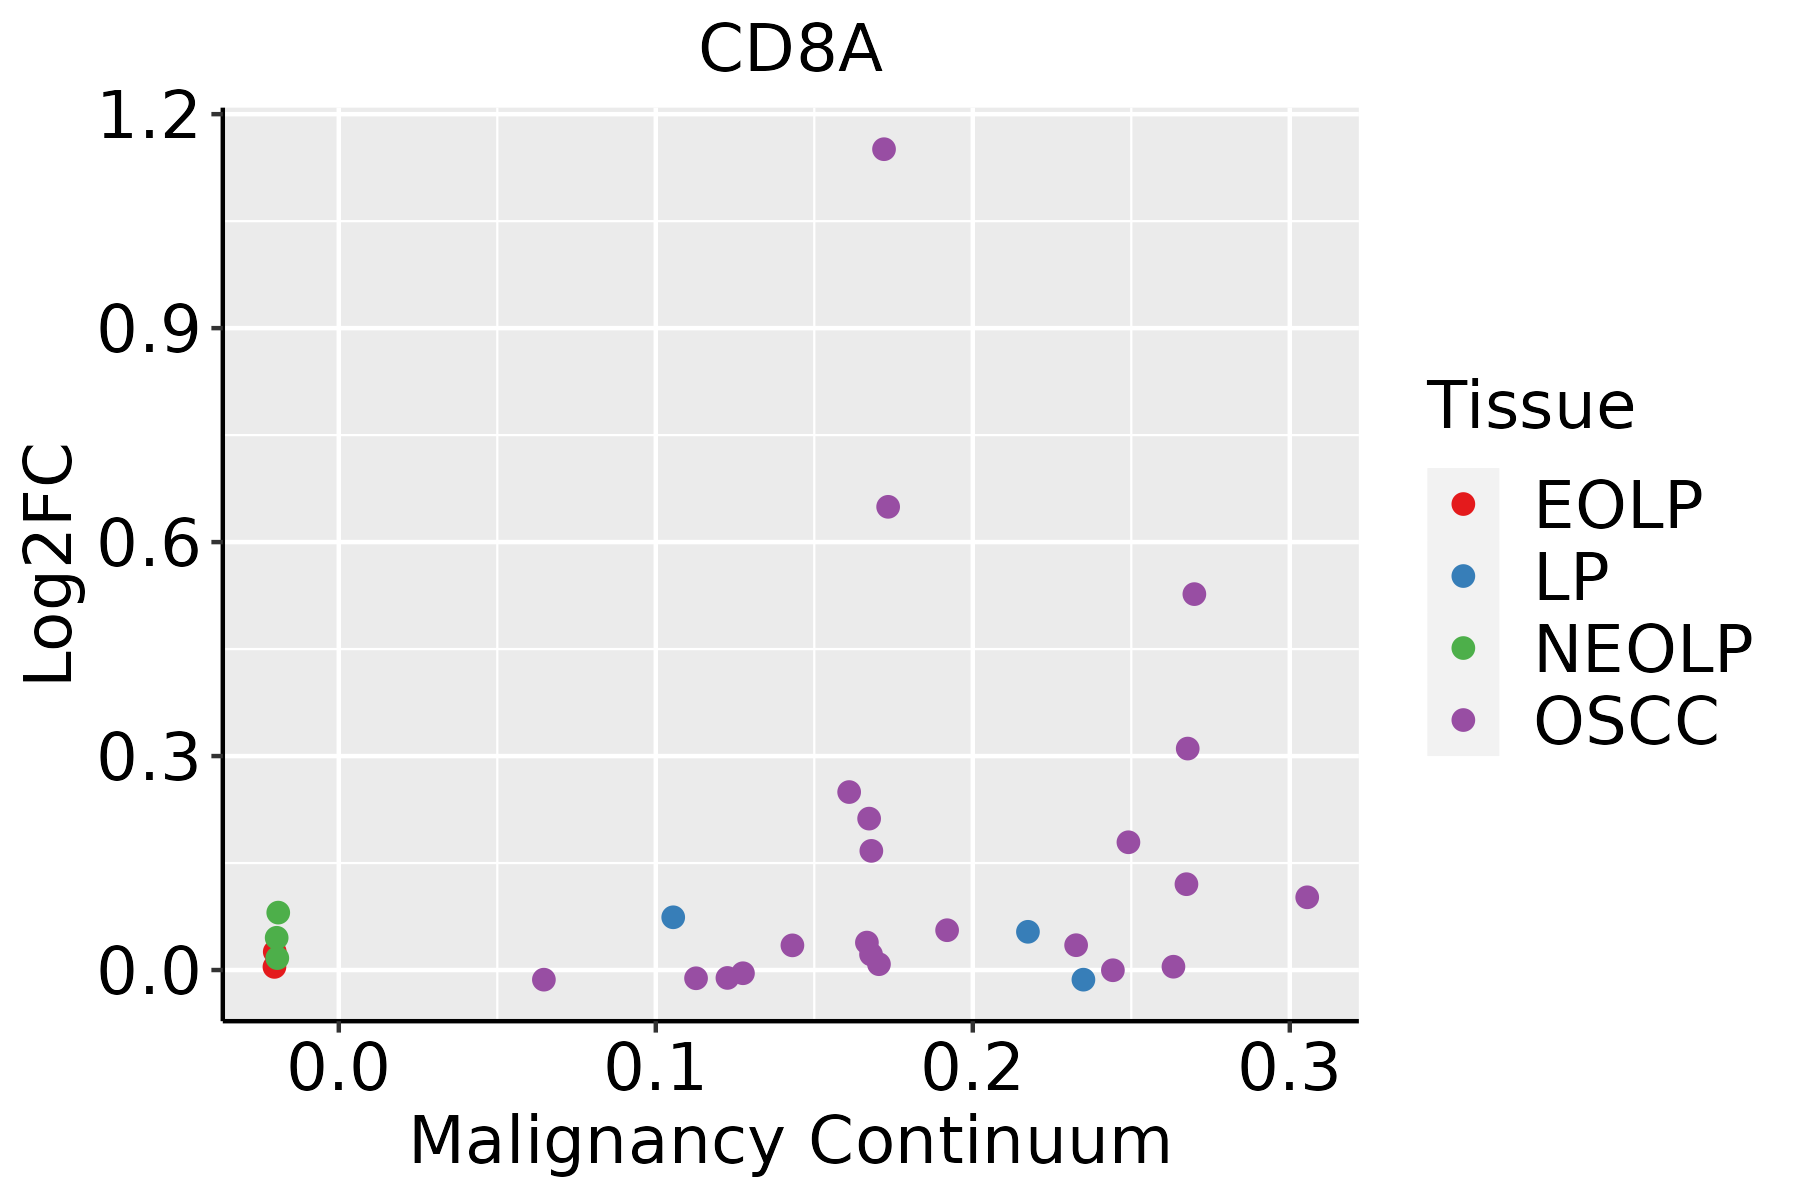 | EOLP: Erosive Oral lichen planus |
| LP: leukoplakia | ||
| NEOLP: Non-erosive oral lichen planus | ||
| OSCC: Oral squamous cell carcinoma |
| ∗log2FC in expression of this searched gene in stem-like cells from each diseased tissue sample relative to stem-like cells in normal samples in each tissue plotted against the malignancy continuum. Samples are colored based on if they are from different disease stage. |
Top |
Malignant transformation related pathway analysis |
| Find out the enriched GO biological processes and KEGG pathways involved in transition from healthy to precancer to cancer |
| Tissue | Disease Stage | Enriched GO biological Processes |
| Colorectum | AD |  |
| Colorectum | SER |  |
| Colorectum | MSS |  |
| Colorectum | MSI-H |  |
| Colorectum | FAP |  |
| ∗Top 15 enriched GO BP terms are showed in the bar plot of each disease state in each tissue. Each row represents a significant GO biological process which is colored according to the -log10(p.adjust). |
| Page: 1 2 3 4 5 6 7 8 9 |
| GO ID | Tissue | Disease Stage | Description | Gene Ratio | Bg Ratio | pvalue | p.adjust | Count |
| GO:004211016 | Oral cavity | OSCC | T cell activation | 245/7305 | 487/18723 | 2.00e-07 | 3.22e-06 | 245 |
| GO:001988220 | Oral cavity | OSCC | antigen processing and presentation | 65/7305 | 106/18723 | 2.69e-06 | 3.32e-05 | 65 |
| GO:19031316 | Oral cavity | OSCC | mononuclear cell differentiation | 210/7305 | 426/18723 | 8.44e-06 | 9.02e-05 | 210 |
| GO:00300983 | Oral cavity | OSCC | lymphocyte differentiation | 179/7305 | 374/18723 | 2.74e-04 | 1.74e-03 | 179 |
| GO:00302175 | Oral cavity | OSCC | T cell differentiation | 126/7305 | 257/18723 | 6.51e-04 | 3.66e-03 | 126 |
| Page: 1 |
| Pathway ID | Tissue | Disease Stage | Description | Gene Ratio | Bg Ratio | pvalue | p.adjust | qvalue | Count |
| hsa0513520 | Oral cavity | OSCC | Yersinia infection | 94/3704 | 137/8465 | 2.85e-09 | 3.08e-08 | 1.57e-08 | 94 |
| hsa046606 | Oral cavity | OSCC | T cell receptor signaling pathway | 67/3704 | 104/8465 | 1.57e-05 | 6.75e-05 | 3.44e-05 | 67 |
| hsa0461229 | Oral cavity | OSCC | Antigen processing and presentation | 47/3704 | 78/8465 | 2.37e-03 | 6.35e-03 | 3.23e-03 | 47 |
| hsa05135110 | Oral cavity | OSCC | Yersinia infection | 94/3704 | 137/8465 | 2.85e-09 | 3.08e-08 | 1.57e-08 | 94 |
| hsa0466012 | Oral cavity | OSCC | T cell receptor signaling pathway | 67/3704 | 104/8465 | 1.57e-05 | 6.75e-05 | 3.44e-05 | 67 |
| hsa04612113 | Oral cavity | OSCC | Antigen processing and presentation | 47/3704 | 78/8465 | 2.37e-03 | 6.35e-03 | 3.23e-03 | 47 |
| Page: 1 |
Top |
Cell-cell communication analysis |
| Identification of potential cell-cell interactions between two cell types and their ligand-receptor pairs for different disease states |
| Ligand | Receptor | LRpair | Pathway | Tissue | Disease Stage |
| HLA-A | CD8A | HLA-A_CD8A | MHC-I | Breast | ADJ |
| HLA-B | CD8A | HLA-B_CD8A | MHC-I | Breast | ADJ |
| HLA-E | CD8A | HLA-E_CD8A | MHC-I | Breast | ADJ |
| HLA-F | CD8A | HLA-F_CD8A | MHC-I | Breast | ADJ |
| HLA-A | CD8A | HLA-A_CD8A | MHC-I | Breast | DCIS |
| HLA-B | CD8A | HLA-B_CD8A | MHC-I | Breast | DCIS |
| HLA-C | CD8A | HLA-C_CD8A | MHC-I | Breast | DCIS |
| HLA-E | CD8A | HLA-E_CD8A | MHC-I | Breast | DCIS |
| HLA-F | CD8A | HLA-F_CD8A | MHC-I | Breast | DCIS |
| HLA-A | CD8A | HLA-A_CD8A | MHC-I | Breast | Healthy |
| HLA-B | CD8A | HLA-B_CD8A | MHC-I | Breast | Healthy |
| HLA-C | CD8A | HLA-C_CD8A | MHC-I | Breast | Healthy |
| HLA-E | CD8A | HLA-E_CD8A | MHC-I | Breast | Healthy |
| HLA-F | CD8A | HLA-F_CD8A | MHC-I | Breast | Healthy |
| HLA-A | CD8A | HLA-A_CD8A | MHC-I | Breast | IDC |
| HLA-B | CD8A | HLA-B_CD8A | MHC-I | Breast | IDC |
| HLA-C | CD8A | HLA-C_CD8A | MHC-I | Breast | IDC |
| HLA-E | CD8A | HLA-E_CD8A | MHC-I | Breast | IDC |
| HLA-F | CD8A | HLA-F_CD8A | MHC-I | Breast | IDC |
| HLA-A | CD8A | HLA-A_CD8A | MHC-I | Breast | Precancer |
| Page: 1 |
Top |
Single-cell gene regulatory network inference analysis |
| Find out the significant the regulons (TFs) and the target genes of each regulon across cell types for different disease states |
| TF | Cell Type | Tissue | Disease Stage | Target Gene | RSS | Regulon Activity |
| ∗The dot plots of a searched regulon are shown for all cell subpopulations in each disease state of each tissue based on the regulon specific score inferred using pySCENIC and by calculating the average expression. |
| Page: 1 |
Top |
Somatic mutation of malignant transformation related genes |
| Annotation of somatic variants for genes involved in malignant transformation |
| Hugo Symbol | Variant Class | Variant Classification | dbSNP RS | HGVSc | HGVSp | HGVSp Short | SWISSPROT | BIOTYPE | SIFT | PolyPhen | Tumor Sample Barcode | Tissue | Histology | Sex | Age | Stage | Therapy Types | Drugs | Outcome |
| CD8A | SNV | Missense_Mutation | c.310N>T | p.Asp104Tyr | p.D104Y | P01732 | protein_coding | tolerated(0.05) | possibly_damaging(0.574) | TCGA-BR-4361-01 | Stomach | stomach adenocarcinoma | Female | >=65 | III/IV | Unknown | Unknown | SD | |
| CD8A | SNV | Missense_Mutation | c.347C>T | p.Ser116Leu | p.S116L | P01732 | protein_coding | tolerated(0.67) | possibly_damaging(0.646) | TCGA-BR-4362-01 | Stomach | stomach adenocarcinoma | Female | >=65 | I/II | Unknown | Unknown | SD | |
| CD8A | SNV | Missense_Mutation | c.251N>C | p.Leu84Pro | p.L84P | P01732 | protein_coding | tolerated(0.1) | probably_damaging(0.998) | TCGA-BR-7707-01 | Stomach | stomach adenocarcinoma | Female | >=65 | I/II | Unknown | Unknown | SD | |
| CD8A | SNV | Missense_Mutation | rs771963865 | c.551A>G | p.Tyr184Cys | p.Y184C | P01732 | protein_coding | deleterious(0) | probably_damaging(0.972) | TCGA-BR-7851-01 | Stomach | stomach adenocarcinoma | Male | >=65 | I/II | Unknown | Unknown | SD |
| CD8A | deletion | Frame_Shift_Del | novel | c.528delN | p.Leu177TrpfsTer115 | p.L177Wfs*115 | P01732 | protein_coding | TCGA-RD-A8NB-01 | Stomach | stomach adenocarcinoma | Female | >=65 | III/IV | Unknown | Unknown | PD |
| Page: 1 2 3 |
Top |
Related drugs of malignant transformation related genes |
| Identification of chemicals and drugs interact with genes involved in malignant transfromation |
| (DGIdb 4.0) |
| Entrez ID | Symbol | Category | Interaction Types | Drug Claim Name | Drug Name | PMIDs |
| 925 | CD8A | DRUGGABLE GENOME, EXTERNAL SIDE OF PLASMA MEMBRANE, KINASE | Protein vaccines | |||
| 925 | CD8A | DRUGGABLE GENOME, EXTERNAL SIDE OF PLASMA MEMBRANE, KINASE | Fluoropeptide vaccine | |||
| 925 | CD8A | DRUGGABLE GENOME, EXTERNAL SIDE OF PLASMA MEMBRANE, KINASE | Anti-VEGFR2 CD8 cell therapy | |||
| 925 | CD8A | DRUGGABLE GENOME, EXTERNAL SIDE OF PLASMA MEMBRANE, KINASE | LIPO-4 |
| Page: 1 |

Copyright 2023-Present -The University of Texas Health Science Center at Houston |