
|
|||||
|
 | |
| |
| |
| |
| |
| |
|
Gene: DOCK11 |
Gene summary for DOCK11 |
| Gene information | Species | Human | Gene symbol | DOCK11 | Gene ID | 139818 |
| Gene name | dedicator of cytokinesis 11 | |
| Gene Alias | ACG | |
| Cytomap | Xq24 | |
| Gene Type | protein-coding | GO ID | GO:0001775 | UniProtAcc | Q5JSL3 |
Top |
Malignant transformation analysis |
| Identification of the aberrant gene expression in precancerous and cancerous lesions by comparing the gene expression of stem-like cells in diseased tissues with normal stem cells |
| Entrez ID | Symbol | Replicates | Species | Organ | Tissue | Adj P-value | Log2FC | Malignancy |
| 139818 | DOCK11 | HTA11_696_2000001011 | Human | Colorectum | AD | 2.12e-09 | 3.05e-01 | -0.1464 |
| 139818 | DOCK11 | HTA11_866_2000001011 | Human | Colorectum | AD | 1.97e-02 | 9.02e-02 | -0.1001 |
| 139818 | DOCK11 | HTA11_1391_2000001011 | Human | Colorectum | AD | 2.08e-03 | 1.82e-01 | -0.059 |
| 139818 | DOCK11 | HTA11_99999965104_69814 | Human | Colorectum | MSS | 5.43e-09 | 5.03e-01 | 0.281 |
| 139818 | DOCK11 | A001-C-119 | Human | Colorectum | FAP | 1.92e-02 | 4.08e-01 | -0.1557 |
| 139818 | DOCK11 | A002-C-021 | Human | Colorectum | FAP | 2.06e-05 | 3.64e-01 | 0.1171 |
| 139818 | DOCK11 | male-WTA | Human | Thyroid | PTC | 5.45e-21 | 1.74e-01 | 0.1037 |
| 139818 | DOCK11 | PTC01 | Human | Thyroid | PTC | 4.13e-12 | 2.04e-01 | 0.1899 |
| 139818 | DOCK11 | PTC04 | Human | Thyroid | PTC | 6.06e-12 | 2.53e-01 | 0.1927 |
| 139818 | DOCK11 | PTC05 | Human | Thyroid | PTC | 6.45e-18 | 5.92e-01 | 0.2065 |
| 139818 | DOCK11 | PTC06 | Human | Thyroid | PTC | 4.28e-41 | 8.09e-01 | 0.2057 |
| 139818 | DOCK11 | PTC07 | Human | Thyroid | PTC | 8.30e-18 | 3.14e-01 | 0.2044 |
| 139818 | DOCK11 | ATC12 | Human | Thyroid | ATC | 1.25e-15 | 3.16e-01 | 0.34 |
| 139818 | DOCK11 | ATC13 | Human | Thyroid | ATC | 1.27e-28 | 5.07e-01 | 0.34 |
| 139818 | DOCK11 | ATC2 | Human | Thyroid | ATC | 2.37e-04 | 3.12e-01 | 0.34 |
| 139818 | DOCK11 | ATC4 | Human | Thyroid | ATC | 1.22e-19 | 4.18e-01 | 0.34 |
| 139818 | DOCK11 | ATC5 | Human | Thyroid | ATC | 2.97e-27 | 5.54e-01 | 0.34 |
| Page: 1 |
| Tissue | Expression Dynamics | Abbreviation |
| Colorectum (GSE201348) |  | FAP: Familial adenomatous polyposis |
| CRC: Colorectal cancer | ||
| Colorectum (HTA11) |  | AD: Adenomas |
| SER: Sessile serrated lesions | ||
| MSI-H: Microsatellite-high colorectal cancer | ||
| MSS: Microsatellite stable colorectal cancer | ||
| Thyroid | 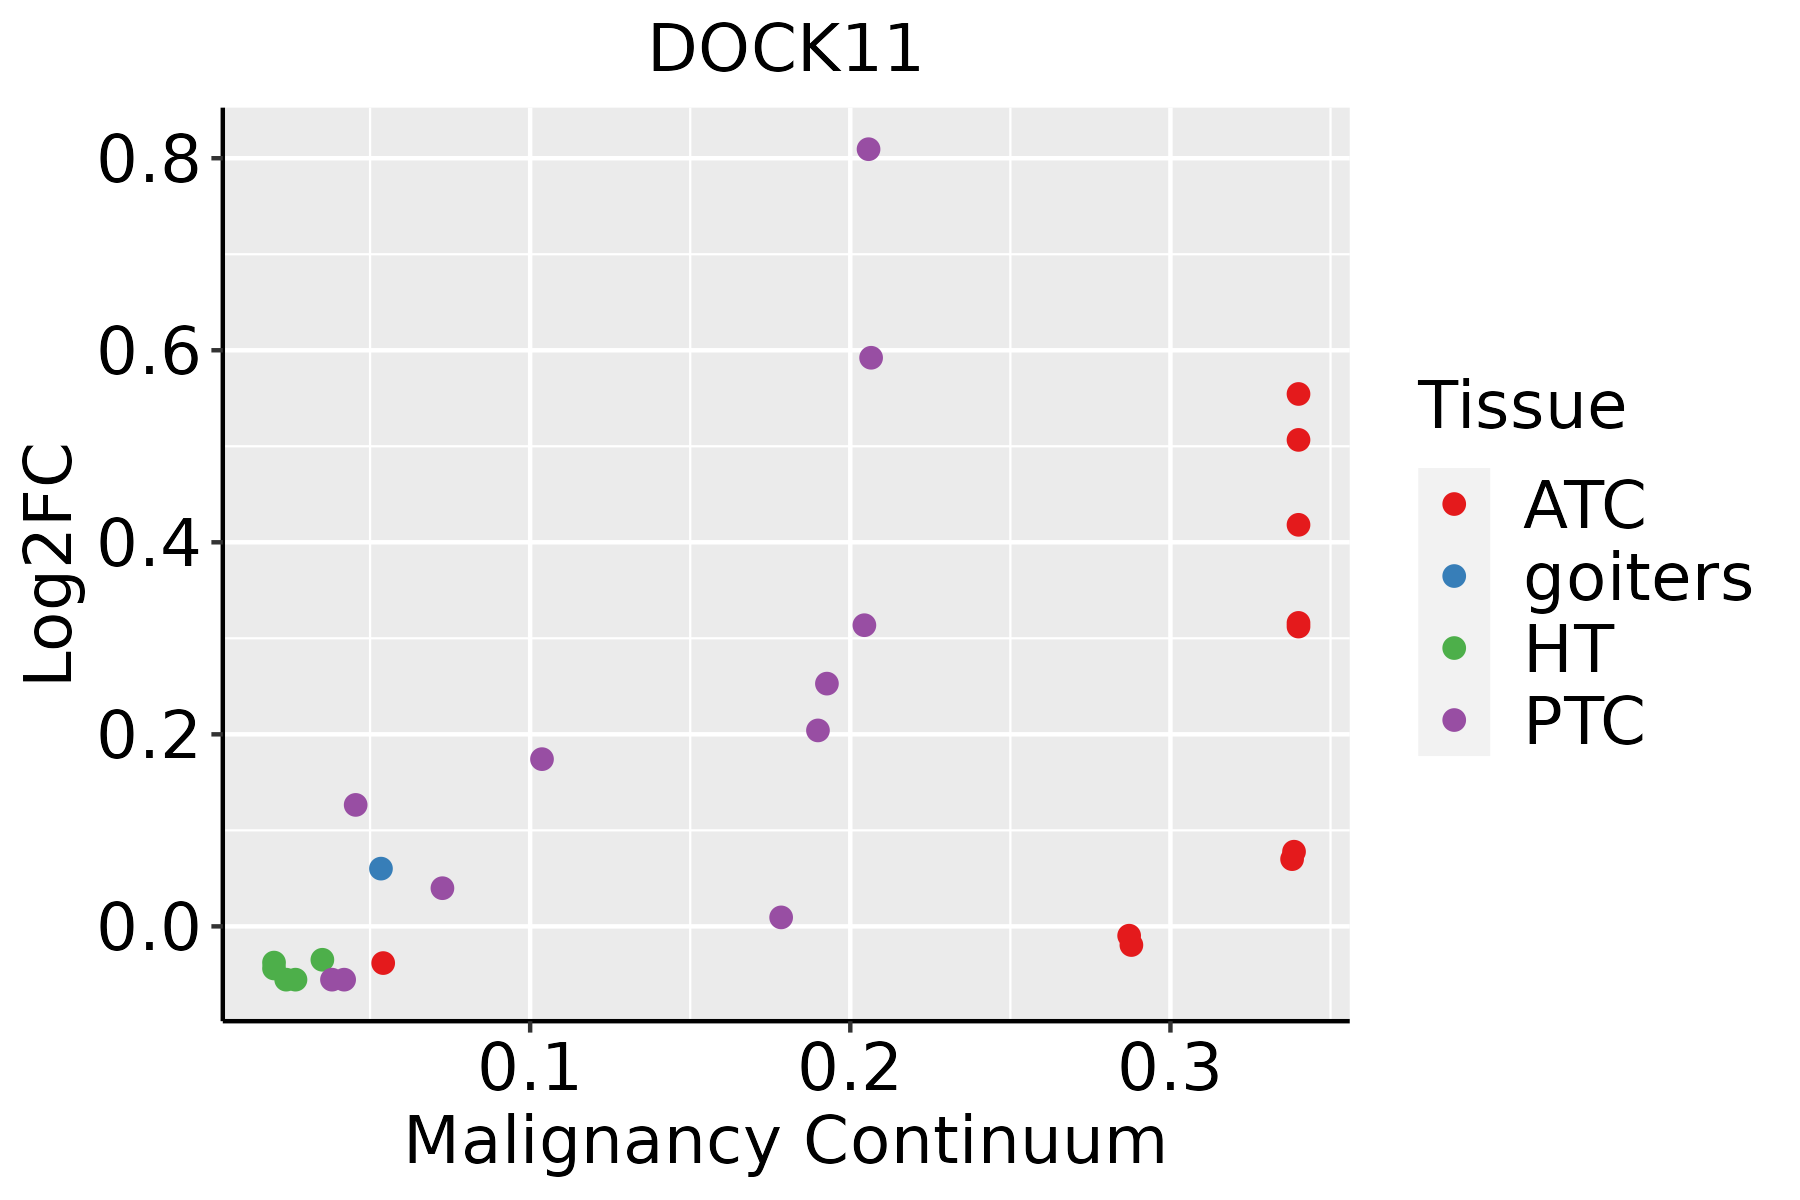 | ATC: Anaplastic thyroid cancer |
| HT: Hashimoto's thyroiditis | ||
| PTC: Papillary thyroid cancer |
| ∗log2FC in expression of this searched gene in stem-like cells from each diseased tissue sample relative to stem-like cells in normal samples in each tissue plotted against the malignancy continuum. Samples are colored based on if they are from different disease stage. |
Top |
Malignant transformation related pathway analysis |
| Find out the enriched GO biological processes and KEGG pathways involved in transition from healthy to precancer to cancer |
| Tissue | Disease Stage | Enriched GO biological Processes |
| Colorectum | AD |  |
| Colorectum | SER |  |
| Colorectum | MSS |  |
| Colorectum | MSI-H |  |
| Colorectum | FAP |  |
| ∗Top 15 enriched GO BP terms are showed in the bar plot of each disease state in each tissue. Each row represents a significant GO biological process which is colored according to the -log10(p.adjust). |
| Page: 1 2 3 4 5 6 7 8 9 |
| GO ID | Tissue | Disease Stage | Description | Gene Ratio | Bg Ratio | pvalue | p.adjust | Count |
| GO:0043087 | Colorectum | AD | regulation of GTPase activity | 110/3918 | 348/18723 | 1.64e-06 | 5.03e-05 | 110 |
| GO:0048872 | Colorectum | AD | homeostasis of number of cells | 87/3918 | 272/18723 | 1.16e-05 | 2.61e-04 | 87 |
| GO:0031346 | Colorectum | AD | positive regulation of cell projection organization | 104/3918 | 353/18723 | 8.26e-05 | 1.30e-03 | 104 |
| GO:0043547 | Colorectum | AD | positive regulation of GTPase activity | 75/3918 | 255/18723 | 7.95e-04 | 7.91e-03 | 75 |
| GO:0001782 | Colorectum | AD | B cell homeostasis | 13/3918 | 31/18723 | 6.53e-03 | 4.06e-02 | 13 |
| GO:0120034 | Colorectum | AD | positive regulation of plasma membrane bounded cell projection assembly | 33/3918 | 105/18723 | 7.49e-03 | 4.55e-02 | 33 |
| GO:0120032 | Colorectum | AD | regulation of plasma membrane bounded cell projection assembly | 53/3918 | 186/18723 | 8.51e-03 | 4.97e-02 | 53 |
| GO:00430872 | Colorectum | MSS | regulation of GTPase activity | 101/3467 | 348/18723 | 1.00e-06 | 3.46e-05 | 101 |
| GO:00488722 | Colorectum | MSS | homeostasis of number of cells | 82/3467 | 272/18723 | 2.02e-06 | 6.28e-05 | 82 |
| GO:00313462 | Colorectum | MSS | positive regulation of cell projection organization | 96/3467 | 353/18723 | 3.44e-05 | 6.70e-04 | 96 |
| GO:00435471 | Colorectum | MSS | positive regulation of GTPase activity | 68/3467 | 255/18723 | 7.97e-04 | 8.38e-03 | 68 |
| GO:01200322 | Colorectum | MSS | regulation of plasma membrane bounded cell projection assembly | 51/3467 | 186/18723 | 1.78e-03 | 1.58e-02 | 51 |
| GO:00604911 | Colorectum | MSS | regulation of cell projection assembly | 51/3467 | 188/18723 | 2.28e-03 | 1.87e-02 | 51 |
| GO:00017821 | Colorectum | MSS | B cell homeostasis | 12/3467 | 31/18723 | 6.80e-03 | 4.39e-02 | 12 |
| GO:01200341 | Colorectum | MSS | positive regulation of plasma membrane bounded cell projection assembly | 30/3467 | 105/18723 | 7.74e-03 | 4.84e-02 | 30 |
| GO:00430873 | Colorectum | FAP | regulation of GTPase activity | 85/2622 | 348/18723 | 1.20e-07 | 7.68e-06 | 85 |
| GO:00313463 | Colorectum | FAP | positive regulation of cell projection organization | 82/2622 | 353/18723 | 1.78e-06 | 7.35e-05 | 82 |
| GO:00435472 | Colorectum | FAP | positive regulation of GTPase activity | 61/2622 | 255/18723 | 1.39e-05 | 3.73e-04 | 61 |
| GO:00488724 | Colorectum | FAP | homeostasis of number of cells | 60/2622 | 272/18723 | 1.91e-04 | 2.79e-03 | 60 |
| GO:1903131 | Colorectum | FAP | mononuclear cell differentiation | 79/2622 | 426/18723 | 5.00e-03 | 3.33e-02 | 79 |
| Page: 1 2 3 |
| Pathway ID | Tissue | Disease Stage | Description | Gene Ratio | Bg Ratio | pvalue | p.adjust | qvalue | Count |
| Page: 1 |
Top |
Cell-cell communication analysis |
| Identification of potential cell-cell interactions between two cell types and their ligand-receptor pairs for different disease states |
| Ligand | Receptor | LRpair | Pathway | Tissue | Disease Stage |
| Page: 1 |
Top |
Single-cell gene regulatory network inference analysis |
| Find out the significant the regulons (TFs) and the target genes of each regulon across cell types for different disease states |
| TF | Cell Type | Tissue | Disease Stage | Target Gene | RSS | Regulon Activity |
| ∗The dot plots of a searched regulon are shown for all cell subpopulations in each disease state of each tissue based on the regulon specific score inferred using pySCENIC and by calculating the average expression. |
| Page: 1 |
Top |
Somatic mutation of malignant transformation related genes |
| Annotation of somatic variants for genes involved in malignant transformation |
| Hugo Symbol | Variant Class | Variant Classification | dbSNP RS | HGVSc | HGVSp | HGVSp Short | SWISSPROT | BIOTYPE | SIFT | PolyPhen | Tumor Sample Barcode | Tissue | Histology | Sex | Age | Stage | Therapy Types | Drugs | Outcome |
| DOCK11 | SNV | Missense_Mutation | novel | c.5008A>T | p.Thr1670Ser | p.T1670S | Q5JSL3 | protein_coding | tolerated(0.66) | benign(0.276) | TCGA-VQ-A8E3-01 | Stomach | stomach adenocarcinoma | Male | >=65 | I/II | Unknown | Unknown | PD |
| DOCK11 | SNV | Missense_Mutation | novel | c.2135N>G | p.Asp712Gly | p.D712G | Q5JSL3 | protein_coding | deleterious(0) | probably_damaging(0.941) | TCGA-VQ-A91E-01 | Stomach | stomach adenocarcinoma | Female | >=65 | III/IV | Chemotherapy | fluorouracil | CR |
| DOCK11 | deletion | Frame_Shift_Del | novel | c.2953delN | p.Arg986GlufsTer20 | p.R986Efs*20 | Q5JSL3 | protein_coding | TCGA-HU-A4H4-01 | Stomach | stomach adenocarcinoma | Female | <65 | I/II | Chemotherapy | ts-1 | CR | ||
| DOCK11 | SNV | Missense_Mutation | rs376064945 | c.6191G>A | p.Gly2064Asp | p.G2064D | Q5JSL3 | protein_coding | tolerated_low_confidence(0.21) | benign(0.039) | TCGA-ET-A2MY-01 | Thyroid | thyroid carcinoma | Female | >=65 | I/II | Unknown | Unknown | SD |
| DOCK11 | insertion | Nonsense_Mutation | novel | c.3445_3446insATTATAATTAAAATA | p.Ala1149delinsAspTyrAsnTerAsnThr | p.A1149delinsDYN*NT | Q5JSL3 | protein_coding | TCGA-BJ-A45F-01 | Thyroid | thyroid carcinoma | Female | <65 | I/II | Unknown | Unknown | SD | ||
| DOCK11 | insertion | In_Frame_Ins | novel | c.3446_3447insTGTATT | p.Ala1149_Phe1150insValLeu | p.A1149_F1150insVL | Q5JSL3 | protein_coding | TCGA-BJ-A45F-01 | Thyroid | thyroid carcinoma | Female | <65 | I/II | Unknown | Unknown | SD | ||
| DOCK11 | insertion | In_Frame_Ins | novel | c.926_927insAATTTCTATTAT | p.Arg309_Ser310insIleSerIleMet | p.R309_S310insISIM | Q5JSL3 | protein_coding | TCGA-EL-A3ZG-01 | Thyroid | thyroid carcinoma | Male | <65 | I/II | Unknown | Unknown | SD | ||
| DOCK11 | insertion | Frame_Shift_Ins | novel | c.927_928insAA | p.Ser310LysfsTer7 | p.S310Kfs*7 | Q5JSL3 | protein_coding | TCGA-EL-A3ZG-01 | Thyroid | thyroid carcinoma | Male | <65 | I/II | Unknown | Unknown | SD | ||
| DOCK11 | insertion | Frame_Shift_Ins | novel | c.1375_1376insATTTTAAAACT | p.Arg459HisfsTer14 | p.R459Hfs*14 | Q5JSL3 | protein_coding | TCGA-FY-A4B0-01 | Thyroid | thyroid carcinoma | Male | >=65 | I/II | Hormone Therapy | synthroid | SD | ||
| DOCK11 | insertion | Frame_Shift_Ins | novel | c.5163_5164insGTAGAAA | p.Ile1722ValfsTer8 | p.I1722Vfs*8 | Q5JSL3 | protein_coding | TCGA-FY-A4B0-01 | Thyroid | thyroid carcinoma | Male | >=65 | I/II | Hormone Therapy | synthroid | SD |
| Page: 1 2 3 4 5 6 7 8 9 10 11 12 13 14 15 16 17 18 19 20 21 22 23 24 25 26 27 28 29 |
Top |
Related drugs of malignant transformation related genes |
| Identification of chemicals and drugs interact with genes involved in malignant transfromation |
| (DGIdb 4.0) |
| Entrez ID | Symbol | Category | Interaction Types | Drug Claim Name | Drug Name | PMIDs |
| Page: 1 |

Copyright 2023-Present -The University of Texas Health Science Center at Houston |