
|
|||||
|
 | |
| |
| |
| |
| |
| |
|
Gene: EPHA3 |
Gene summary for EPHA3 |
| Gene information | Species | Human | Gene symbol | EPHA3 | Gene ID | 2042 |
| Gene name | EPH receptor A3 | |
| Gene Alias | EK4 | |
| Cytomap | 3p11.1 | |
| Gene Type | protein-coding | GO ID | GO:0000226 | UniProtAcc | A0A140VJJ0 |
Top |
Malignant transformation analysis |
| Identification of the aberrant gene expression in precancerous and cancerous lesions by comparing the gene expression of stem-like cells in diseased tissues with normal stem cells |
| Entrez ID | Symbol | Replicates | Species | Organ | Tissue | Adj P-value | Log2FC | Malignancy |
| 2042 | EPHA3 | ATC13 | Human | Thyroid | ATC | 1.03e-79 | 1.56e+00 | 0.34 |
| 2042 | EPHA3 | ATC5 | Human | Thyroid | ATC | 6.33e-73 | 1.66e+00 | 0.34 |
| Page: 1 |
| Tissue | Expression Dynamics | Abbreviation |
| Thyroid | 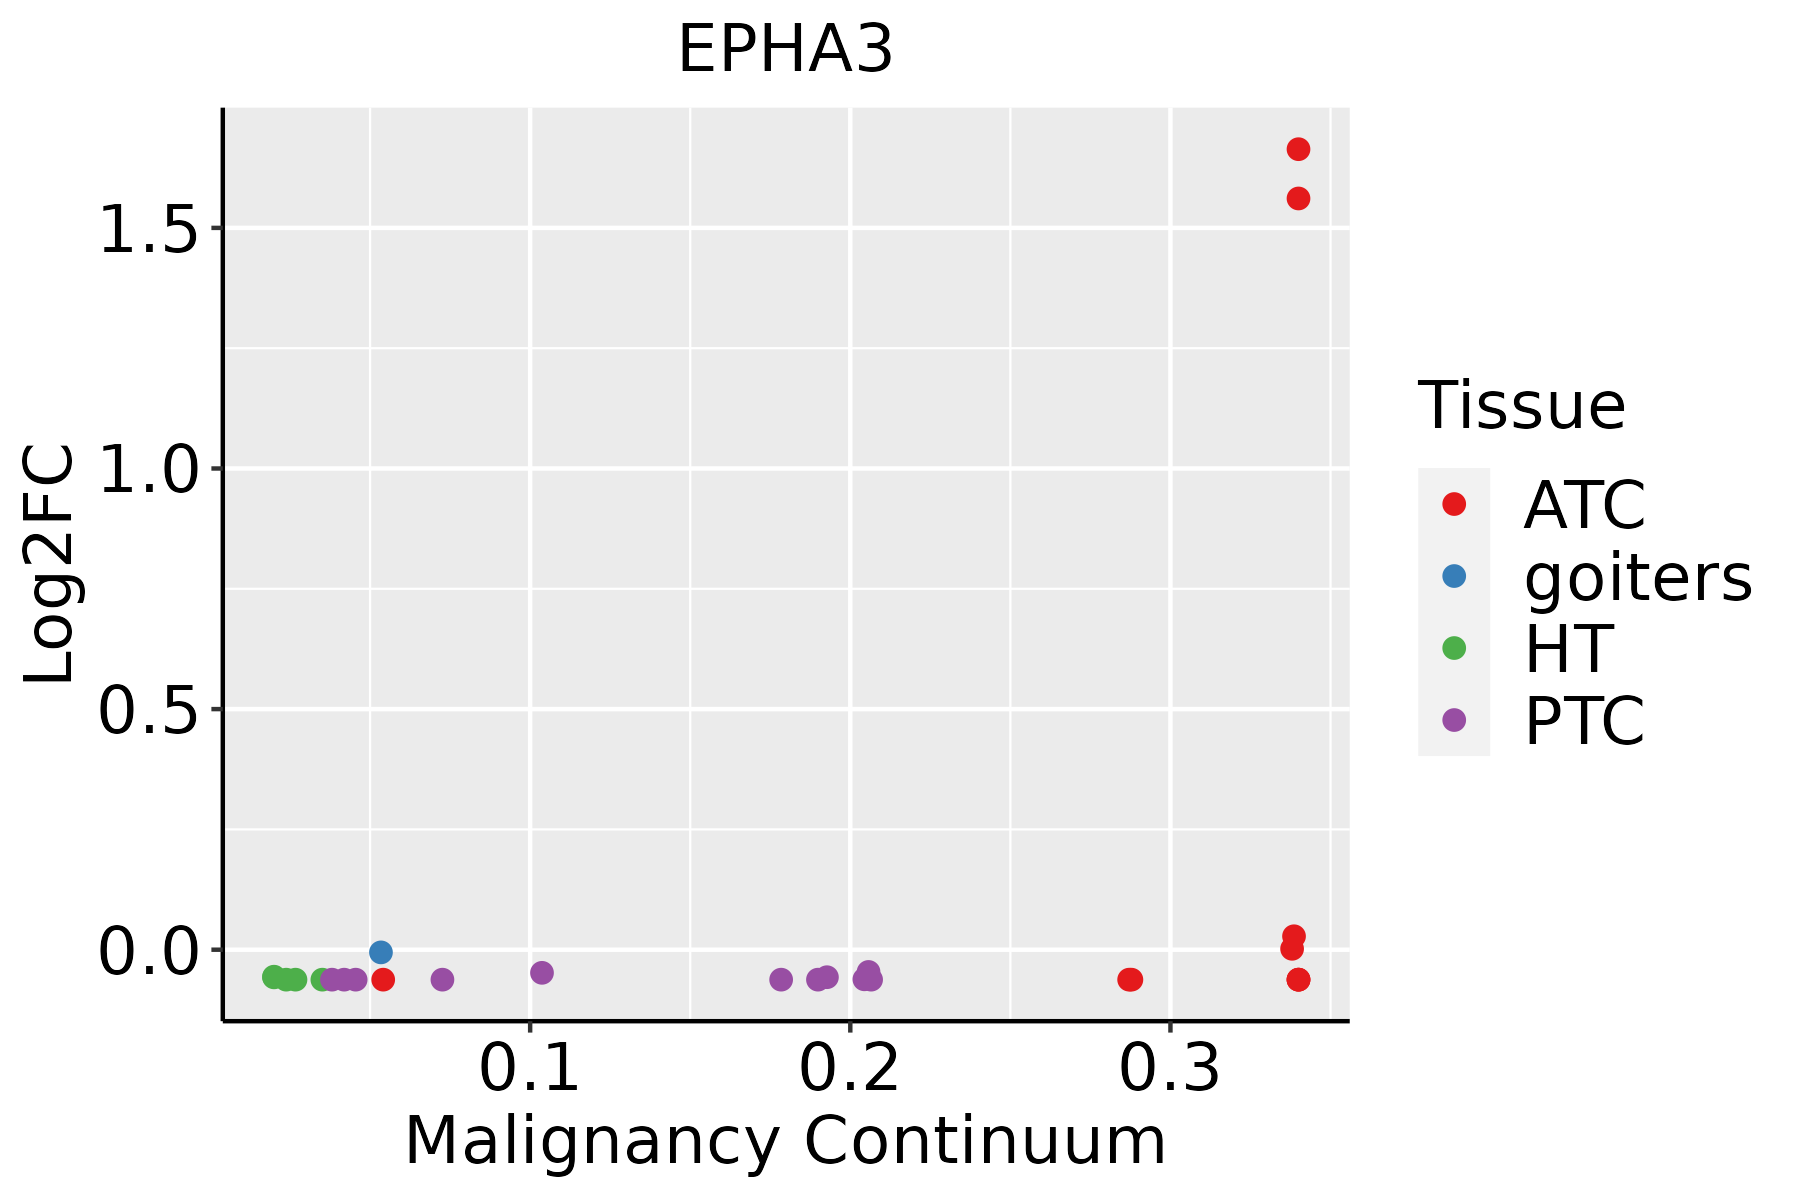 | ATC: Anaplastic thyroid cancer |
| HT: Hashimoto's thyroiditis | ||
| PTC: Papillary thyroid cancer |
| ∗log2FC in expression of this searched gene in stem-like cells from each diseased tissue sample relative to stem-like cells in normal samples in each tissue plotted against the malignancy continuum. Samples are colored based on if they are from different disease stage. |
Top |
Malignant transformation related pathway analysis |
| Find out the enriched GO biological processes and KEGG pathways involved in transition from healthy to precancer to cancer |
| Tissue | Disease Stage | Enriched GO biological Processes |
| Colorectum | AD |  |
| Colorectum | SER |  |
| Colorectum | MSS |  |
| Colorectum | MSI-H |  |
| Colorectum | FAP |  |
| ∗Top 15 enriched GO BP terms are showed in the bar plot of each disease state in each tissue. Each row represents a significant GO biological process which is colored according to the -log10(p.adjust). |
| Page: 1 2 3 4 5 6 7 8 9 |
| GO ID | Tissue | Disease Stage | Description | Gene Ratio | Bg Ratio | pvalue | p.adjust | Count |
| GO:1903829210 | Thyroid | ATC | positive regulation of cellular protein localization | 167/6293 | 276/18723 | 3.32e-20 | 5.38e-18 | 167 |
| GO:007265928 | Thyroid | ATC | protein localization to plasma membrane | 161/6293 | 284/18723 | 8.45e-16 | 6.52e-14 | 161 |
| GO:003158928 | Thyroid | ATC | cell-substrate adhesion | 195/6293 | 363/18723 | 1.58e-15 | 1.17e-13 | 195 |
| GO:199077826 | Thyroid | ATC | protein localization to cell periphery | 181/6293 | 333/18723 | 3.72e-15 | 2.56e-13 | 181 |
| GO:0032970210 | Thyroid | ATC | regulation of actin filament-based process | 208/6293 | 397/18723 | 5.82e-15 | 3.80e-13 | 208 |
| GO:0032956210 | Thyroid | ATC | regulation of actin cytoskeleton organization | 190/6293 | 358/18723 | 1.73e-14 | 1.01e-12 | 190 |
| GO:003134623 | Thyroid | ATC | positive regulation of cell projection organization | 186/6293 | 353/18723 | 7.99e-14 | 4.23e-12 | 186 |
| GO:001081029 | Thyroid | ATC | regulation of cell-substrate adhesion | 128/6293 | 221/18723 | 8.74e-14 | 4.57e-12 | 128 |
| GO:015011527 | Thyroid | ATC | cell-substrate junction organization | 70/6293 | 101/18723 | 2.29e-13 | 1.09e-11 | 70 |
| GO:0007044111 | Thyroid | ATC | cell-substrate junction assembly | 65/6293 | 95/18723 | 4.11e-12 | 1.62e-10 | 65 |
| GO:0007160111 | Thyroid | ATC | cell-matrix adhesion | 128/6293 | 233/18723 | 1.49e-11 | 5.41e-10 | 128 |
| GO:015011627 | Thyroid | ATC | regulation of cell-substrate junction organization | 51/6293 | 71/18723 | 5.01e-11 | 1.63e-09 | 51 |
| GO:0048041110 | Thyroid | ATC | focal adhesion assembly | 59/6293 | 87/18723 | 7.05e-11 | 2.23e-09 | 59 |
| GO:0001952110 | Thyroid | ATC | regulation of cell-matrix adhesion | 78/6293 | 128/18723 | 2.09e-10 | 6.15e-09 | 78 |
| GO:001097523 | Thyroid | ATC | regulation of neuron projection development | 212/6293 | 445/18723 | 4.16e-10 | 1.14e-08 | 212 |
| GO:005189325 | Thyroid | ATC | regulation of focal adhesion assembly | 47/6293 | 66/18723 | 4.64e-10 | 1.25e-08 | 47 |
| GO:009010925 | Thyroid | ATC | regulation of cell-substrate junction assembly | 47/6293 | 66/18723 | 4.64e-10 | 1.25e-08 | 47 |
| GO:006156423 | Thyroid | ATC | axon development | 220/6293 | 467/18723 | 6.85e-10 | 1.80e-08 | 220 |
| GO:0030100111 | Thyroid | ATC | regulation of endocytosis | 113/6293 | 211/18723 | 1.71e-09 | 4.22e-08 | 113 |
| GO:007050723 | Thyroid | ATC | regulation of microtubule cytoskeleton organization | 85/6293 | 148/18723 | 2.17e-09 | 5.21e-08 | 85 |
| Page: 1 2 3 |
| Pathway ID | Tissue | Disease Stage | Description | Gene Ratio | Bg Ratio | pvalue | p.adjust | qvalue | Count |
| Page: 1 |
Top |
Cell-cell communication analysis |
| Identification of potential cell-cell interactions between two cell types and their ligand-receptor pairs for different disease states |
| Ligand | Receptor | LRpair | Pathway | Tissue | Disease Stage |
| EFNA1 | EPHA3 | EFNA1_EPHA3 | EPHA | CRC | ADJ |
| EFNA5 | EPHA3 | EFNA5_EPHA3 | EPHA | CRC | ADJ |
| EFNA1 | EPHA3 | EFNA1_EPHA3 | EPHA | CRC | FAP |
| EFNA5 | EPHA3 | EFNA5_EPHA3 | EPHA | CRC | FAP |
| EFNA1 | EPHA3 | EFNA1_EPHA3 | EPHA | Endometrium | ADJ |
| EFNA5 | EPHA3 | EFNA5_EPHA3 | EPHA | Endometrium | ADJ |
| EFNA1 | EPHA3 | EFNA1_EPHA3 | EPHA | Endometrium | AEH |
| EFNA5 | EPHA3 | EFNA5_EPHA3 | EPHA | Endometrium | AEH |
| EFNA1 | EPHA3 | EFNA1_EPHA3 | EPHA | Esophagus | ESCC |
| EFNA3 | EPHA3 | EFNA3_EPHA3 | EPHA | Esophagus | ESCC |
| EFNA4 | EPHA3 | EFNA4_EPHA3 | EPHA | Esophagus | ESCC |
| EFNA5 | EPHA3 | EFNA5_EPHA3 | EPHA | Esophagus | ESCC |
| EFNA1 | EPHA3 | EFNA1_EPHA3 | EPHA | GC | ADJ |
| EFNA5 | EPHA3 | EFNA5_EPHA3 | EPHA | GC | ADJ |
| EFNA1 | EPHA3 | EFNA1_EPHA3 | EPHA | GC | GC |
| EFNA5 | EPHA3 | EFNA5_EPHA3 | EPHA | GC | GC |
| EFNA1 | EPHA3 | EFNA1_EPHA3 | EPHA | Liver | Healthy |
| EFNA5 | EPHA3 | EFNA5_EPHA3 | EPHA | Liver | Healthy |
| EFNA1 | EPHA3 | EFNA1_EPHA3 | EPHA | Liver | Precancer |
| EFNA5 | EPHA3 | EFNA5_EPHA3 | EPHA | Liver | Precancer |
| Page: 1 |
Top |
Single-cell gene regulatory network inference analysis |
| Find out the significant the regulons (TFs) and the target genes of each regulon across cell types for different disease states |
| TF | Cell Type | Tissue | Disease Stage | Target Gene | RSS | Regulon Activity |
| ∗The dot plots of a searched regulon are shown for all cell subpopulations in each disease state of each tissue based on the regulon specific score inferred using pySCENIC and by calculating the average expression. |
| Page: 1 |
Top |
Somatic mutation of malignant transformation related genes |
| Annotation of somatic variants for genes involved in malignant transformation |
| Hugo Symbol | Variant Class | Variant Classification | dbSNP RS | HGVSc | HGVSp | HGVSp Short | SWISSPROT | BIOTYPE | SIFT | PolyPhen | Tumor Sample Barcode | Tissue | Histology | Sex | Age | Stage | Therapy Types | Drugs | Outcome |
| EPHA3 | SNV | Missense_Mutation | c.1957A>G | p.Lys653Glu | p.K653E | P29320 | protein_coding | deleterious(0.01) | probably_damaging(0.988) | TCGA-BR-8487-01 | Stomach | stomach adenocarcinoma | Female | <65 | I/II | Unknown | Unknown | SD | |
| EPHA3 | SNV | Missense_Mutation | c.2774C>T | p.Thr925Ile | p.T925I | P29320 | protein_coding | deleterious(0) | benign(0.003) | TCGA-BR-8487-01 | Stomach | stomach adenocarcinoma | Female | <65 | I/II | Unknown | Unknown | SD | |
| EPHA3 | SNV | Missense_Mutation | c.98T>G | p.Leu33Arg | p.L33R | P29320 | protein_coding | deleterious(0) | probably_damaging(0.996) | TCGA-BR-8589-01 | Stomach | stomach adenocarcinoma | Male | <65 | III/IV | Unknown | Unknown | SD | |
| EPHA3 | SNV | Missense_Mutation | c.563N>T | p.Ala188Val | p.A188V | P29320 | protein_coding | deleterious(0.01) | probably_damaging(0.992) | TCGA-BR-8680-01 | Stomach | stomach adenocarcinoma | Male | <65 | III/IV | Chemotherapy | oxaliplatin | CR | |
| EPHA3 | SNV | Missense_Mutation | c.1687N>G | p.Leu563Val | p.L563V | P29320 | protein_coding | tolerated(0.56) | benign(0.003) | TCGA-BR-8690-01 | Stomach | stomach adenocarcinoma | Female | <65 | III/IV | Chemotherapy | carboplatin | CR | |
| EPHA3 | SNV | Missense_Mutation | c.2854N>G | p.Lys952Glu | p.K952E | P29320 | protein_coding | tolerated(0.95) | probably_damaging(0.987) | TCGA-BR-A4QM-01 | Stomach | stomach adenocarcinoma | Male | >=65 | III/IV | Chemotherapy | 5-fluorouracil | PD | |
| EPHA3 | SNV | Missense_Mutation | c.620N>T | p.Lys207Met | p.K207M | P29320 | protein_coding | deleterious(0) | possibly_damaging(0.707) | TCGA-CD-A48C-01 | Stomach | stomach adenocarcinoma | Female | >=65 | I/II | Unknown | Unknown | PD | |
| EPHA3 | SNV | Missense_Mutation | c.620A>C | p.Lys207Thr | p.K207T | P29320 | protein_coding | deleterious(0.05) | benign(0.202) | TCGA-CG-4436-01 | Stomach | stomach adenocarcinoma | Male | <65 | I/II | Unknown | Unknown | SD | |
| EPHA3 | SNV | Missense_Mutation | c.1925T>G | p.Leu642Arg | p.L642R | P29320 | protein_coding | deleterious(0.04) | probably_damaging(0.999) | TCGA-CG-4436-01 | Stomach | stomach adenocarcinoma | Male | <65 | I/II | Unknown | Unknown | SD | |
| EPHA3 | SNV | Missense_Mutation | c.2282A>T | p.Lys761Met | p.K761M | P29320 | protein_coding | deleterious(0) | probably_damaging(0.999) | TCGA-CG-4444-01 | Stomach | stomach adenocarcinoma | Male | >=65 | III/IV | Chemotherapy | 5-fluorouracil | CR |
| Page: 1 2 3 4 5 6 7 8 9 10 11 12 13 14 15 16 17 18 19 20 21 22 23 24 25 26 |
Top |
Related drugs of malignant transformation related genes |
| Identification of chemicals and drugs interact with genes involved in malignant transfromation |
| (DGIdb 4.0) |
| Entrez ID | Symbol | Category | Interaction Types | Drug Claim Name | Drug Name | PMIDs |
| 2042 | EPHA3 | ENZYME, KINASE, TYROSINE KINASE, CLINICALLY ACTIONABLE, DRUGGABLE GENOME | inhibitor | 249565850 | ||
| 2042 | EPHA3 | ENZYME, KINASE, TYROSINE KINASE, CLINICALLY ACTIONABLE, DRUGGABLE GENOME | inhibitor | HESPERADIN | HESPERADIN | 19035792 |
| 2042 | EPHA3 | ENZYME, KINASE, TYROSINE KINASE, CLINICALLY ACTIONABLE, DRUGGABLE GENOME | antibody | 310264706 | ||
| 2042 | EPHA3 | ENZYME, KINASE, TYROSINE KINASE, CLINICALLY ACTIONABLE, DRUGGABLE GENOME | Ifabotuzumab | |||
| 2042 | EPHA3 | ENZYME, KINASE, TYROSINE KINASE, CLINICALLY ACTIONABLE, DRUGGABLE GENOME | KB004 | |||
| 2042 | EPHA3 | ENZYME, KINASE, TYROSINE KINASE, CLINICALLY ACTIONABLE, DRUGGABLE GENOME | KB-004 | KB-004 | ||
| 2042 | EPHA3 | ENZYME, KINASE, TYROSINE KINASE, CLINICALLY ACTIONABLE, DRUGGABLE GENOME | inhibitor | 249565821 | ||
| 2042 | EPHA3 | ENZYME, KINASE, TYROSINE KINASE, CLINICALLY ACTIONABLE, DRUGGABLE GENOME | inhibitor | 363894214 | SITRAVATINIB | |
| 2042 | EPHA3 | ENZYME, KINASE, TYROSINE KINASE, CLINICALLY ACTIONABLE, DRUGGABLE GENOME | inhibitor | CHEMBL24828 | VANDETANIB |
| Page: 1 |

Copyright 2023-Present -The University of Texas Health Science Center at Houston |