
|
|||||
|
 | |
| |
| |
| |
| |
| |
|
Gene: CIT |
Gene summary for CIT |
| Gene information | Species | Human | Gene symbol | CIT | Gene ID | 11113 |
| Gene name | citron rho-interacting serine/threonine kinase | |
| Gene Alias | CITK | |
| Cytomap | 12q24.23 | |
| Gene Type | protein-coding | GO ID | GO:0000278 | UniProtAcc | O14578 |
Top |
Malignant transformation analysis |
| Identification of the aberrant gene expression in precancerous and cancerous lesions by comparing the gene expression of stem-like cells in diseased tissues with normal stem cells |
| Entrez ID | Symbol | Replicates | Species | Organ | Tissue | Adj P-value | Log2FC | Malignancy |
| 11113 | CIT | TD9 | Human | Lung | IAC | 1.02e-02 | 5.71e-01 | 0.088 |
| 11113 | CIT | RNA-P6T1-P6T1-1 | Human | Lung | MIAC | 6.67e-04 | 9.05e-01 | -0.0238 |
| Page: 1 |
| Tissue | Expression Dynamics | Abbreviation |
| Lung | 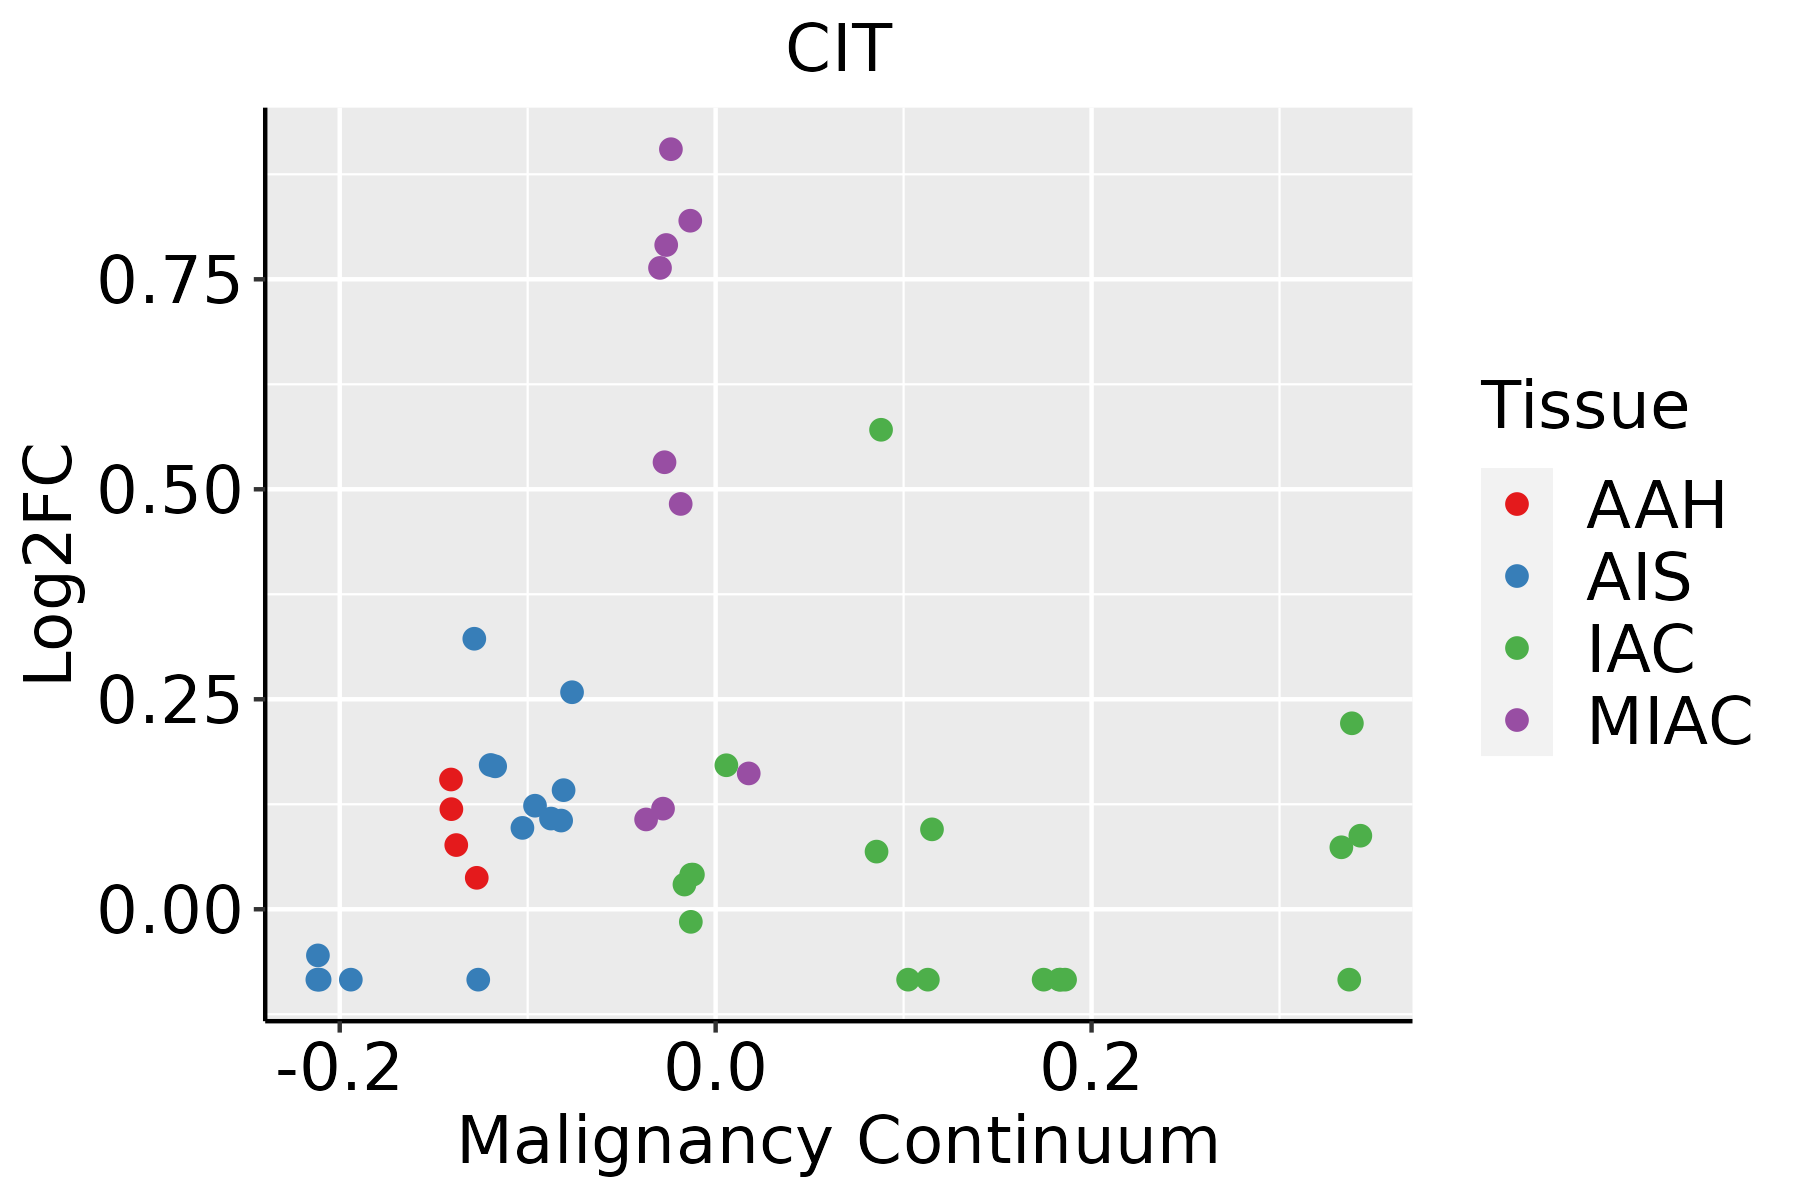 | AAH: Atypical adenomatous hyperplasia |
| AIS: Adenocarcinoma in situ | ||
| IAC: Invasive lung adenocarcinoma | ||
| MIA: Minimally invasive adenocarcinoma |
| ∗log2FC in expression of this searched gene in stem-like cells from each diseased tissue sample relative to stem-like cells in normal samples in each tissue plotted against the malignancy continuum. Samples are colored based on if they are from different disease stage. |
Top |
Malignant transformation related pathway analysis |
| Find out the enriched GO biological processes and KEGG pathways involved in transition from healthy to precancer to cancer |
| Tissue | Disease Stage | Enriched GO biological Processes |
| Colorectum | AD |  |
| Colorectum | SER |  |
| Colorectum | MSS |  |
| Colorectum | MSI-H |  |
| Colorectum | FAP |  |
| ∗Top 15 enriched GO BP terms are showed in the bar plot of each disease state in each tissue. Each row represents a significant GO biological process which is colored according to the -log10(p.adjust). |
| Page: 1 2 3 4 5 6 7 8 9 |
| GO ID | Tissue | Disease Stage | Description | Gene Ratio | Bg Ratio | pvalue | p.adjust | Count |
| GO:00436273 | Breast | Precancer | response to estrogen | 15/1080 | 75/18723 | 2.06e-05 | 4.83e-04 | 15 |
| GO:004362711 | Breast | IDC | response to estrogen | 17/1434 | 75/18723 | 4.05e-05 | 9.25e-04 | 17 |
| GO:00436272 | Breast | DCIS | response to estrogen | 16/1390 | 75/18723 | 1.01e-04 | 1.84e-03 | 16 |
| GO:000170119 | Esophagus | ESCC | in utero embryonic development | 243/8552 | 367/18723 | 1.00e-15 | 6.86e-14 | 243 |
| GO:0048732111 | Esophagus | ESCC | gland development | 269/8552 | 436/18723 | 7.81e-12 | 2.95e-10 | 269 |
| GO:0070482111 | Esophagus | ESCC | response to oxygen levels | 218/8552 | 347/18723 | 6.91e-11 | 2.17e-09 | 218 |
| GO:0043618111 | Esophagus | ESCC | regulation of transcription from RNA polymerase II promoter in response to stress | 42/8552 | 47/18723 | 3.91e-10 | 1.05e-08 | 42 |
| GO:0043620111 | Esophagus | ESCC | regulation of DNA-templated transcription in response to stress | 46/8552 | 53/18723 | 5.17e-10 | 1.33e-08 | 46 |
| GO:0036293111 | Esophagus | ESCC | response to decreased oxygen levels | 201/8552 | 322/18723 | 8.37e-10 | 2.04e-08 | 201 |
| GO:0030522110 | Esophagus | ESCC | intracellular receptor signaling pathway | 170/8552 | 265/18723 | 8.58e-10 | 2.09e-08 | 170 |
| GO:004578710 | Esophagus | ESCC | positive regulation of cell cycle | 196/8552 | 313/18723 | 9.27e-10 | 2.24e-08 | 196 |
| GO:0030099111 | Esophagus | ESCC | myeloid cell differentiation | 232/8552 | 381/18723 | 1.22e-09 | 2.90e-08 | 232 |
| GO:0001666111 | Esophagus | ESCC | response to hypoxia | 192/8552 | 307/18723 | 1.59e-09 | 3.69e-08 | 192 |
| GO:000184115 | Esophagus | ESCC | neural tube formation | 75/8552 | 102/18723 | 9.68e-09 | 1.95e-07 | 75 |
| GO:000184314 | Esophagus | ESCC | neural tube closure | 66/8552 | 88/18723 | 1.98e-08 | 3.82e-07 | 66 |
| GO:001402014 | Esophagus | ESCC | primary neural tube formation | 69/8552 | 94/18723 | 4.22e-08 | 7.76e-07 | 69 |
| GO:006060614 | Esophagus | ESCC | tube closure | 66/8552 | 89/18723 | 4.24e-08 | 7.76e-07 | 66 |
| GO:0001890110 | Esophagus | ESCC | placenta development | 98/8552 | 144/18723 | 4.46e-08 | 8.11e-07 | 98 |
| GO:004578527 | Esophagus | ESCC | positive regulation of cell adhesion | 255/8552 | 437/18723 | 5.07e-08 | 9.11e-07 | 255 |
| GO:0002262111 | Esophagus | ESCC | myeloid cell homeostasis | 104/8552 | 157/18723 | 1.49e-07 | 2.36e-06 | 104 |
| Page: 1 2 3 4 5 6 7 8 9 10 11 12 13 14 15 16 17 18 19 20 21 22 23 24 25 26 27 28 29 30 31 32 33 34 35 36 37 38 39 40 41 |
| Pathway ID | Tissue | Disease Stage | Description | Gene Ratio | Bg Ratio | pvalue | p.adjust | qvalue | Count |
| Page: 1 |
Top |
Cell-cell communication analysis |
| Identification of potential cell-cell interactions between two cell types and their ligand-receptor pairs for different disease states |
| Ligand | Receptor | LRpair | Pathway | Tissue | Disease Stage |
| Page: 1 |
Top |
Single-cell gene regulatory network inference analysis |
| Find out the significant the regulons (TFs) and the target genes of each regulon across cell types for different disease states |
| TF | Cell Type | Tissue | Disease Stage | Target Gene | RSS | Regulon Activity |
| ∗The dot plots of a searched regulon are shown for all cell subpopulations in each disease state of each tissue based on the regulon specific score inferred using pySCENIC and by calculating the average expression. |
| Page: 1 |
Top |
Somatic mutation of malignant transformation related genes |
| Annotation of somatic variants for genes involved in malignant transformation |
| Hugo Symbol | Variant Class | Variant Classification | dbSNP RS | HGVSc | HGVSp | HGVSp Short | SWISSPROT | BIOTYPE | SIFT | PolyPhen | Tumor Sample Barcode | Tissue | Histology | Sex | Age | Stage | Therapy Types | Drugs | Outcome |
| CIT | insertion | In_Frame_Ins | novel | c.998_999insAGC | p.Asp333delinsGluAla | p.D333delinsEA | O14578 | protein_coding | TCGA-FY-A4B0-01 | Thyroid | thyroid carcinoma | Male | >=65 | I/II | Hormone Therapy | synthroid | SD |
| Page: 1 2 3 4 5 6 7 8 9 10 11 12 13 14 15 16 17 18 19 20 21 22 23 24 |
Top |
Related drugs of malignant transformation related genes |
| Identification of chemicals and drugs interact with genes involved in malignant transfromation |
| (DGIdb 4.0) |
| Entrez ID | Symbol | Category | Interaction Types | Drug Claim Name | Drug Name | PMIDs |
| Page: 1 |

Copyright 2023-Present -The University of Texas Health Science Center at Houston |