
|
|||||
|
 | |
| |
| |
| |
| |
| |
|
Gene: KIDINS220 |
Gene summary for KIDINS220 |
| Gene information | Species | Human | Gene symbol | KIDINS220 | Gene ID | 57498 |
| Gene name | kinase D interacting substrate 220 | |
| Gene Alias | ARMS | |
| Cytomap | 2p25.1 | |
| Gene Type | protein-coding | GO ID | GO:0000902 | UniProtAcc | Q9ULH0 |
Top |
Malignant transformation analysis |
| Identification of the aberrant gene expression in precancerous and cancerous lesions by comparing the gene expression of stem-like cells in diseased tissues with normal stem cells |
| Entrez ID | Symbol | Replicates | Species | Organ | Tissue | Adj P-value | Log2FC | Malignancy |
| 57498 | KIDINS220 | LZE4T | Human | Esophagus | ESCC | 8.90e-16 | 5.72e-01 | 0.0811 |
| 57498 | KIDINS220 | LZE7T | Human | Esophagus | ESCC | 4.87e-07 | 5.36e-01 | 0.0667 |
| 57498 | KIDINS220 | LZE8T | Human | Esophagus | ESCC | 7.05e-03 | 1.90e-01 | 0.067 |
| 57498 | KIDINS220 | LZE22T | Human | Esophagus | ESCC | 2.17e-02 | 8.52e-02 | 0.068 |
| 57498 | KIDINS220 | LZE24T | Human | Esophagus | ESCC | 4.10e-11 | 3.19e-01 | 0.0596 |
| 57498 | KIDINS220 | LZE21T | Human | Esophagus | ESCC | 3.33e-02 | 2.71e-01 | 0.0655 |
| 57498 | KIDINS220 | P1T-E | Human | Esophagus | ESCC | 1.64e-05 | 1.93e-01 | 0.0875 |
| 57498 | KIDINS220 | P2T-E | Human | Esophagus | ESCC | 4.58e-47 | 8.22e-01 | 0.1177 |
| 57498 | KIDINS220 | P4T-E | Human | Esophagus | ESCC | 6.69e-17 | 4.43e-01 | 0.1323 |
| 57498 | KIDINS220 | P5T-E | Human | Esophagus | ESCC | 8.97e-10 | 1.36e-01 | 0.1327 |
| 57498 | KIDINS220 | P8T-E | Human | Esophagus | ESCC | 1.95e-30 | 3.53e-01 | 0.0889 |
| 57498 | KIDINS220 | P9T-E | Human | Esophagus | ESCC | 1.99e-11 | 2.87e-01 | 0.1131 |
| 57498 | KIDINS220 | P10T-E | Human | Esophagus | ESCC | 8.46e-35 | 6.62e-01 | 0.116 |
| 57498 | KIDINS220 | P11T-E | Human | Esophagus | ESCC | 2.15e-18 | 6.99e-01 | 0.1426 |
| 57498 | KIDINS220 | P12T-E | Human | Esophagus | ESCC | 4.12e-32 | 5.52e-01 | 0.1122 |
| 57498 | KIDINS220 | P15T-E | Human | Esophagus | ESCC | 6.05e-18 | 5.08e-01 | 0.1149 |
| 57498 | KIDINS220 | P16T-E | Human | Esophagus | ESCC | 7.33e-10 | 1.74e-01 | 0.1153 |
| 57498 | KIDINS220 | P17T-E | Human | Esophagus | ESCC | 1.64e-05 | 3.05e-01 | 0.1278 |
| 57498 | KIDINS220 | P19T-E | Human | Esophagus | ESCC | 3.95e-05 | 2.97e-01 | 0.1662 |
| 57498 | KIDINS220 | P20T-E | Human | Esophagus | ESCC | 6.89e-14 | 4.00e-01 | 0.1124 |
| Page: 1 2 3 4 5 6 7 |
| Tissue | Expression Dynamics | Abbreviation |
| Esophagus |  | ESCC: Esophageal squamous cell carcinoma |
| HGIN: High-grade intraepithelial neoplasias | ||
| LGIN: Low-grade intraepithelial neoplasias | ||
| Liver | 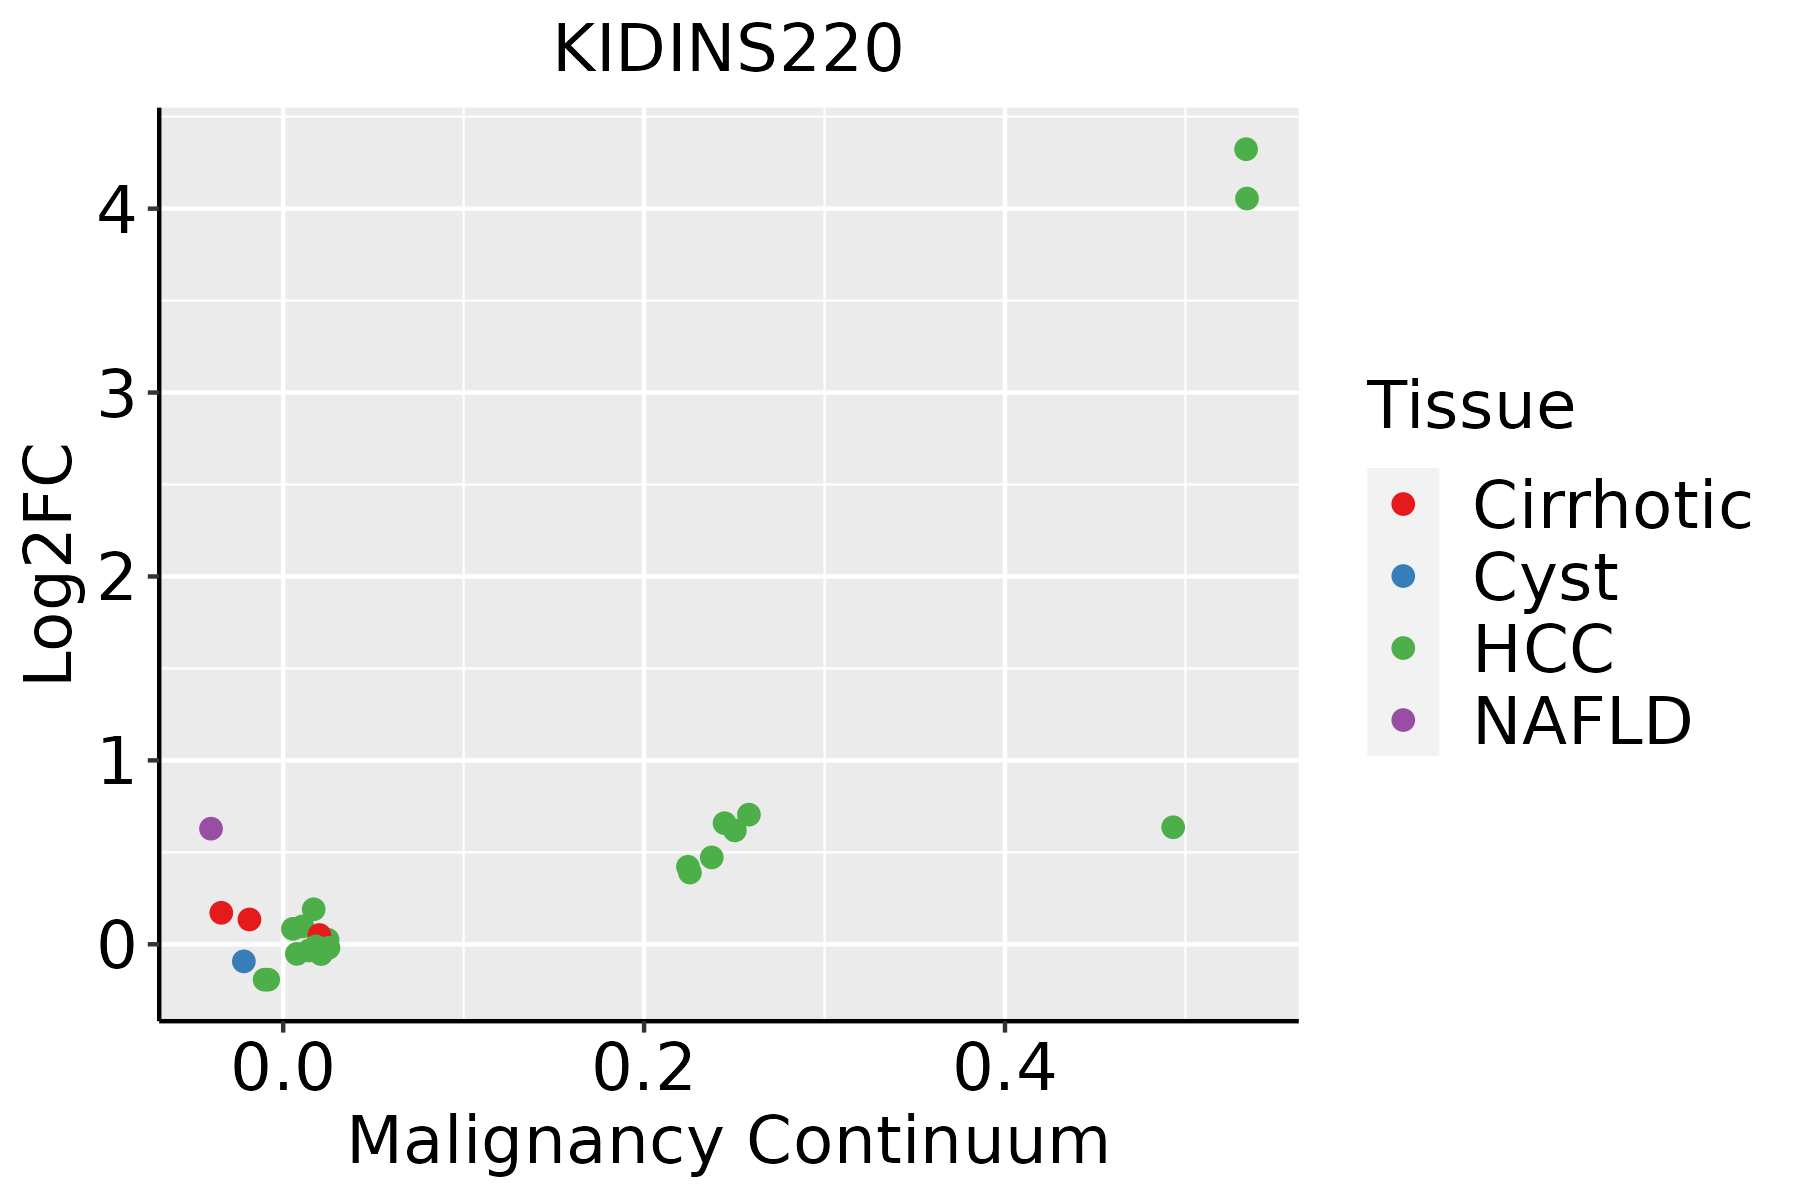 | HCC: Hepatocellular carcinoma |
| NAFLD: Non-alcoholic fatty liver disease | ||
| Oral Cavity |  | EOLP: Erosive Oral lichen planus |
| LP: leukoplakia | ||
| NEOLP: Non-erosive oral lichen planus | ||
| OSCC: Oral squamous cell carcinoma | ||
| Prostate |  | BPH: Benign Prostatic Hyperplasia |
| Skin |  | AK: Actinic keratosis |
| cSCC: Cutaneous squamous cell carcinoma | ||
| SCCIS:squamous cell carcinoma in situ | ||
| Thyroid |  | ATC: Anaplastic thyroid cancer |
| HT: Hashimoto's thyroiditis | ||
| PTC: Papillary thyroid cancer |
| ∗log2FC in expression of this searched gene in stem-like cells from each diseased tissue sample relative to stem-like cells in normal samples in each tissue plotted against the malignancy continuum. Samples are colored based on if they are from different disease stage. |
Top |
Malignant transformation related pathway analysis |
| Find out the enriched GO biological processes and KEGG pathways involved in transition from healthy to precancer to cancer |
| Tissue | Disease Stage | Enriched GO biological Processes |
| Colorectum | AD |  |
| Colorectum | SER |  |
| Colorectum | MSS |  |
| Colorectum | MSI-H |  |
| Colorectum | FAP |  |
| ∗Top 15 enriched GO BP terms are showed in the bar plot of each disease state in each tissue. Each row represents a significant GO biological process which is colored according to the -log10(p.adjust). |
| Page: 1 2 3 4 5 6 7 8 9 |
| GO ID | Tissue | Disease Stage | Description | Gene Ratio | Bg Ratio | pvalue | p.adjust | Count |
| GO:000170119 | Esophagus | ESCC | in utero embryonic development | 243/8552 | 367/18723 | 1.00e-15 | 6.86e-14 | 243 |
| GO:003134616 | Esophagus | ESCC | positive regulation of cell projection organization | 201/8552 | 353/18723 | 1.19e-05 | 1.11e-04 | 201 |
| GO:199009017 | Esophagus | ESCC | cellular response to nerve growth factor stimulus | 38/8552 | 53/18723 | 1.10e-04 | 7.69e-04 | 38 |
| GO:199008916 | Esophagus | ESCC | response to nerve growth factor | 39/8552 | 56/18723 | 2.44e-04 | 1.51e-03 | 39 |
| GO:001097516 | Esophagus | ESCC | regulation of neuron projection development | 240/8552 | 445/18723 | 2.48e-04 | 1.53e-03 | 240 |
| GO:00109764 | Esophagus | ESCC | positive regulation of neuron projection development | 91/8552 | 163/18723 | 5.72e-03 | 2.13e-02 | 91 |
| GO:001635816 | Esophagus | ESCC | dendrite development | 130/8552 | 243/18723 | 8.33e-03 | 2.95e-02 | 130 |
| GO:19900906 | Liver | NAFLD | cellular response to nerve growth factor stimulus | 16/1882 | 53/18723 | 4.07e-05 | 9.99e-04 | 16 |
| GO:19900895 | Liver | NAFLD | response to nerve growth factor | 16/1882 | 56/18723 | 8.53e-05 | 1.72e-03 | 16 |
| GO:00163585 | Liver | NAFLD | dendrite development | 43/1882 | 243/18723 | 1.70e-04 | 3.07e-03 | 43 |
| GO:00313465 | Liver | NAFLD | positive regulation of cell projection organization | 57/1882 | 353/18723 | 2.19e-04 | 3.73e-03 | 57 |
| GO:00488133 | Liver | NAFLD | dendrite morphogenesis | 29/1882 | 146/18723 | 2.63e-04 | 4.26e-03 | 29 |
| GO:0038179 | Liver | NAFLD | neurotrophin signaling pathway | 11/1882 | 36/18723 | 5.73e-04 | 7.66e-03 | 11 |
| GO:00109755 | Liver | NAFLD | regulation of neuron projection development | 64/1882 | 445/18723 | 2.12e-03 | 2.08e-02 | 64 |
| GO:0038180 | Liver | NAFLD | nerve growth factor signaling pathway | 5/1882 | 12/18723 | 4.41e-03 | 3.57e-02 | 5 |
| GO:00017015 | Liver | Cirrhotic | in utero embryonic development | 134/4634 | 367/18723 | 2.78e-07 | 6.86e-06 | 134 |
| GO:199009011 | Liver | Cirrhotic | cellular response to nerve growth factor stimulus | 24/4634 | 53/18723 | 8.86e-04 | 6.37e-03 | 24 |
| GO:199008911 | Liver | Cirrhotic | response to nerve growth factor | 25/4634 | 56/18723 | 9.03e-04 | 6.46e-03 | 25 |
| GO:000170111 | Liver | HCC | in utero embryonic development | 204/7958 | 367/18723 | 2.44e-07 | 4.30e-06 | 204 |
| GO:003134611 | Liver | HCC | positive regulation of cell projection organization | 193/7958 | 353/18723 | 2.28e-06 | 3.08e-05 | 193 |
| Page: 1 2 3 4 5 |
| Pathway ID | Tissue | Disease Stage | Description | Gene Ratio | Bg Ratio | pvalue | p.adjust | qvalue | Count |
| hsa0472225 | Esophagus | ESCC | Neurotrophin signaling pathway | 80/4205 | 119/8465 | 7.33e-05 | 3.07e-04 | 1.57e-04 | 80 |
| hsa04722111 | Esophagus | ESCC | Neurotrophin signaling pathway | 80/4205 | 119/8465 | 7.33e-05 | 3.07e-04 | 1.57e-04 | 80 |
| hsa0472210 | Liver | HCC | Neurotrophin signaling pathway | 74/4020 | 119/8465 | 8.27e-04 | 3.26e-03 | 1.81e-03 | 74 |
| hsa0472211 | Liver | HCC | Neurotrophin signaling pathway | 74/4020 | 119/8465 | 8.27e-04 | 3.26e-03 | 1.81e-03 | 74 |
| hsa0472220 | Oral cavity | OSCC | Neurotrophin signaling pathway | 74/3704 | 119/8465 | 3.55e-05 | 1.49e-04 | 7.58e-05 | 74 |
| hsa04722110 | Oral cavity | OSCC | Neurotrophin signaling pathway | 74/3704 | 119/8465 | 3.55e-05 | 1.49e-04 | 7.58e-05 | 74 |
| hsa0472242 | Oral cavity | EOLP | Neurotrophin signaling pathway | 36/1218 | 119/8465 | 6.23e-06 | 3.87e-05 | 2.28e-05 | 36 |
| hsa0472252 | Oral cavity | EOLP | Neurotrophin signaling pathway | 36/1218 | 119/8465 | 6.23e-06 | 3.87e-05 | 2.28e-05 | 36 |
| hsa0472261 | Oral cavity | NEOLP | Neurotrophin signaling pathway | 31/1112 | 119/8465 | 1.06e-04 | 7.67e-04 | 4.82e-04 | 31 |
| hsa0472271 | Oral cavity | NEOLP | Neurotrophin signaling pathway | 31/1112 | 119/8465 | 1.06e-04 | 7.67e-04 | 4.82e-04 | 31 |
| hsa0472218 | Prostate | BPH | Neurotrophin signaling pathway | 38/1718 | 119/8465 | 1.76e-03 | 7.16e-03 | 4.43e-03 | 38 |
| hsa0472219 | Prostate | BPH | Neurotrophin signaling pathway | 38/1718 | 119/8465 | 1.76e-03 | 7.16e-03 | 4.43e-03 | 38 |
| hsa0472223 | Prostate | Tumor | Neurotrophin signaling pathway | 39/1791 | 119/8465 | 2.01e-03 | 8.10e-03 | 5.02e-03 | 39 |
| hsa0472233 | Prostate | Tumor | Neurotrophin signaling pathway | 39/1791 | 119/8465 | 2.01e-03 | 8.10e-03 | 5.02e-03 | 39 |
| Page: 1 |
Top |
Cell-cell communication analysis |
| Identification of potential cell-cell interactions between two cell types and their ligand-receptor pairs for different disease states |
| Ligand | Receptor | LRpair | Pathway | Tissue | Disease Stage |
| Page: 1 |
Top |
Single-cell gene regulatory network inference analysis |
| Find out the significant the regulons (TFs) and the target genes of each regulon across cell types for different disease states |
| TF | Cell Type | Tissue | Disease Stage | Target Gene | RSS | Regulon Activity |
| ∗The dot plots of a searched regulon are shown for all cell subpopulations in each disease state of each tissue based on the regulon specific score inferred using pySCENIC and by calculating the average expression. |
| Page: 1 |
Top |
Somatic mutation of malignant transformation related genes |
| Annotation of somatic variants for genes involved in malignant transformation |
| Hugo Symbol | Variant Class | Variant Classification | dbSNP RS | HGVSc | HGVSp | HGVSp Short | SWISSPROT | BIOTYPE | SIFT | PolyPhen | Tumor Sample Barcode | Tissue | Histology | Sex | Age | Stage | Therapy Types | Drugs | Outcome |
| KIDINS220 | insertion | Frame_Shift_Ins | novel | c.1985_1986insGAATC | p.Ile662MetfsTer28 | p.I662Mfs*28 | Q9ULH0 | protein_coding | TCGA-FY-A4B0-01 | Thyroid | thyroid carcinoma | Male | >=65 | I/II | Hormone Therapy | synthroid | SD | ||
| KIDINS220 | insertion | Frame_Shift_Ins | novel | c.122_123insTTTTAAAAAAA | p.Leu42PhefsTer5 | p.L42Ffs*5 | Q9ULH0 | protein_coding | TCGA-FY-A4B0-01 | Thyroid | thyroid carcinoma | Male | >=65 | I/II | Hormone Therapy | synthroid | SD |
| Page: 1 2 3 4 5 6 7 8 9 10 11 12 13 14 15 16 17 18 19 20 21 22 |
Top |
Related drugs of malignant transformation related genes |
| Identification of chemicals and drugs interact with genes involved in malignant transfromation |
| (DGIdb 4.0) |
| Entrez ID | Symbol | Category | Interaction Types | Drug Claim Name | Drug Name | PMIDs |
| Page: 1 |

Copyright 2023-Present -The University of Texas Health Science Center at Houston |