
|
|||||
|
 | |
| |
| |
| |
| |
| |
|
Gene: HDLBP |
Gene summary for HDLBP |
| Gene information | Species | Human | Gene symbol | HDLBP | Gene ID | 3069 |
| Gene name | high density lipoprotein binding protein | |
| Gene Alias | HBP | |
| Cytomap | 2q37.3 | |
| Gene Type | protein-coding | GO ID | GO:0006066 | UniProtAcc | Q00341 |
Top |
Malignant transformation analysis |
| Identification of the aberrant gene expression in precancerous and cancerous lesions by comparing the gene expression of stem-like cells in diseased tissues with normal stem cells |
| Entrez ID | Symbol | Replicates | Species | Organ | Tissue | Adj P-value | Log2FC | Malignancy |
| 3069 | HDLBP | GSM4909281 | Human | Breast | IDC | 2.42e-03 | 2.35e-01 | 0.21 |
| 3069 | HDLBP | GSM4909285 | Human | Breast | IDC | 3.02e-02 | 1.85e-01 | 0.21 |
| 3069 | HDLBP | GSM4909288 | Human | Breast | IDC | 3.70e-06 | 3.04e-01 | 0.0988 |
| 3069 | HDLBP | GSM4909291 | Human | Breast | IDC | 6.92e-23 | 7.01e-01 | 0.1753 |
| 3069 | HDLBP | GSM4909293 | Human | Breast | IDC | 8.24e-04 | 1.36e-01 | 0.1581 |
| 3069 | HDLBP | GSM4909296 | Human | Breast | IDC | 6.70e-04 | -4.14e-02 | 0.1524 |
| 3069 | HDLBP | GSM4909297 | Human | Breast | IDC | 2.66e-08 | -2.97e-01 | 0.1517 |
| 3069 | HDLBP | GSM4909309 | Human | Breast | IDC | 1.41e-03 | -1.85e-01 | 0.0483 |
| 3069 | HDLBP | GSM4909311 | Human | Breast | IDC | 6.19e-23 | -7.79e-02 | 0.1534 |
| 3069 | HDLBP | GSM4909312 | Human | Breast | IDC | 3.18e-06 | 9.91e-04 | 0.1552 |
| 3069 | HDLBP | GSM4909318 | Human | Breast | IDC | 5.33e-05 | 3.67e-01 | 0.2031 |
| 3069 | HDLBP | GSM4909319 | Human | Breast | IDC | 1.01e-28 | -1.97e-01 | 0.1563 |
| 3069 | HDLBP | GSM4909320 | Human | Breast | IDC | 1.09e-04 | -1.67e-01 | 0.1575 |
| 3069 | HDLBP | GSM4909321 | Human | Breast | IDC | 2.90e-12 | -3.20e-01 | 0.1559 |
| 3069 | HDLBP | M2 | Human | Breast | IDC | 8.26e-13 | 6.77e-01 | 0.21 |
| 3069 | HDLBP | M5 | Human | Breast | IDC | 4.16e-04 | 6.01e-01 | 0.1598 |
| 3069 | HDLBP | NCCBC14 | Human | Breast | DCIS | 8.18e-19 | 3.58e-01 | 0.2021 |
| 3069 | HDLBP | NCCBC2 | Human | Breast | DCIS | 2.66e-03 | 7.94e-02 | 0.1554 |
| 3069 | HDLBP | NCCBC3 | Human | Breast | DCIS | 1.51e-02 | 1.24e-01 | 0.1198 |
| 3069 | HDLBP | NCCBC5 | Human | Breast | DCIS | 7.70e-15 | -1.08e-01 | 0.2046 |
| Page: 1 2 3 4 5 6 7 8 9 10 11 12 |
| Tissue | Expression Dynamics | Abbreviation |
| Breast | 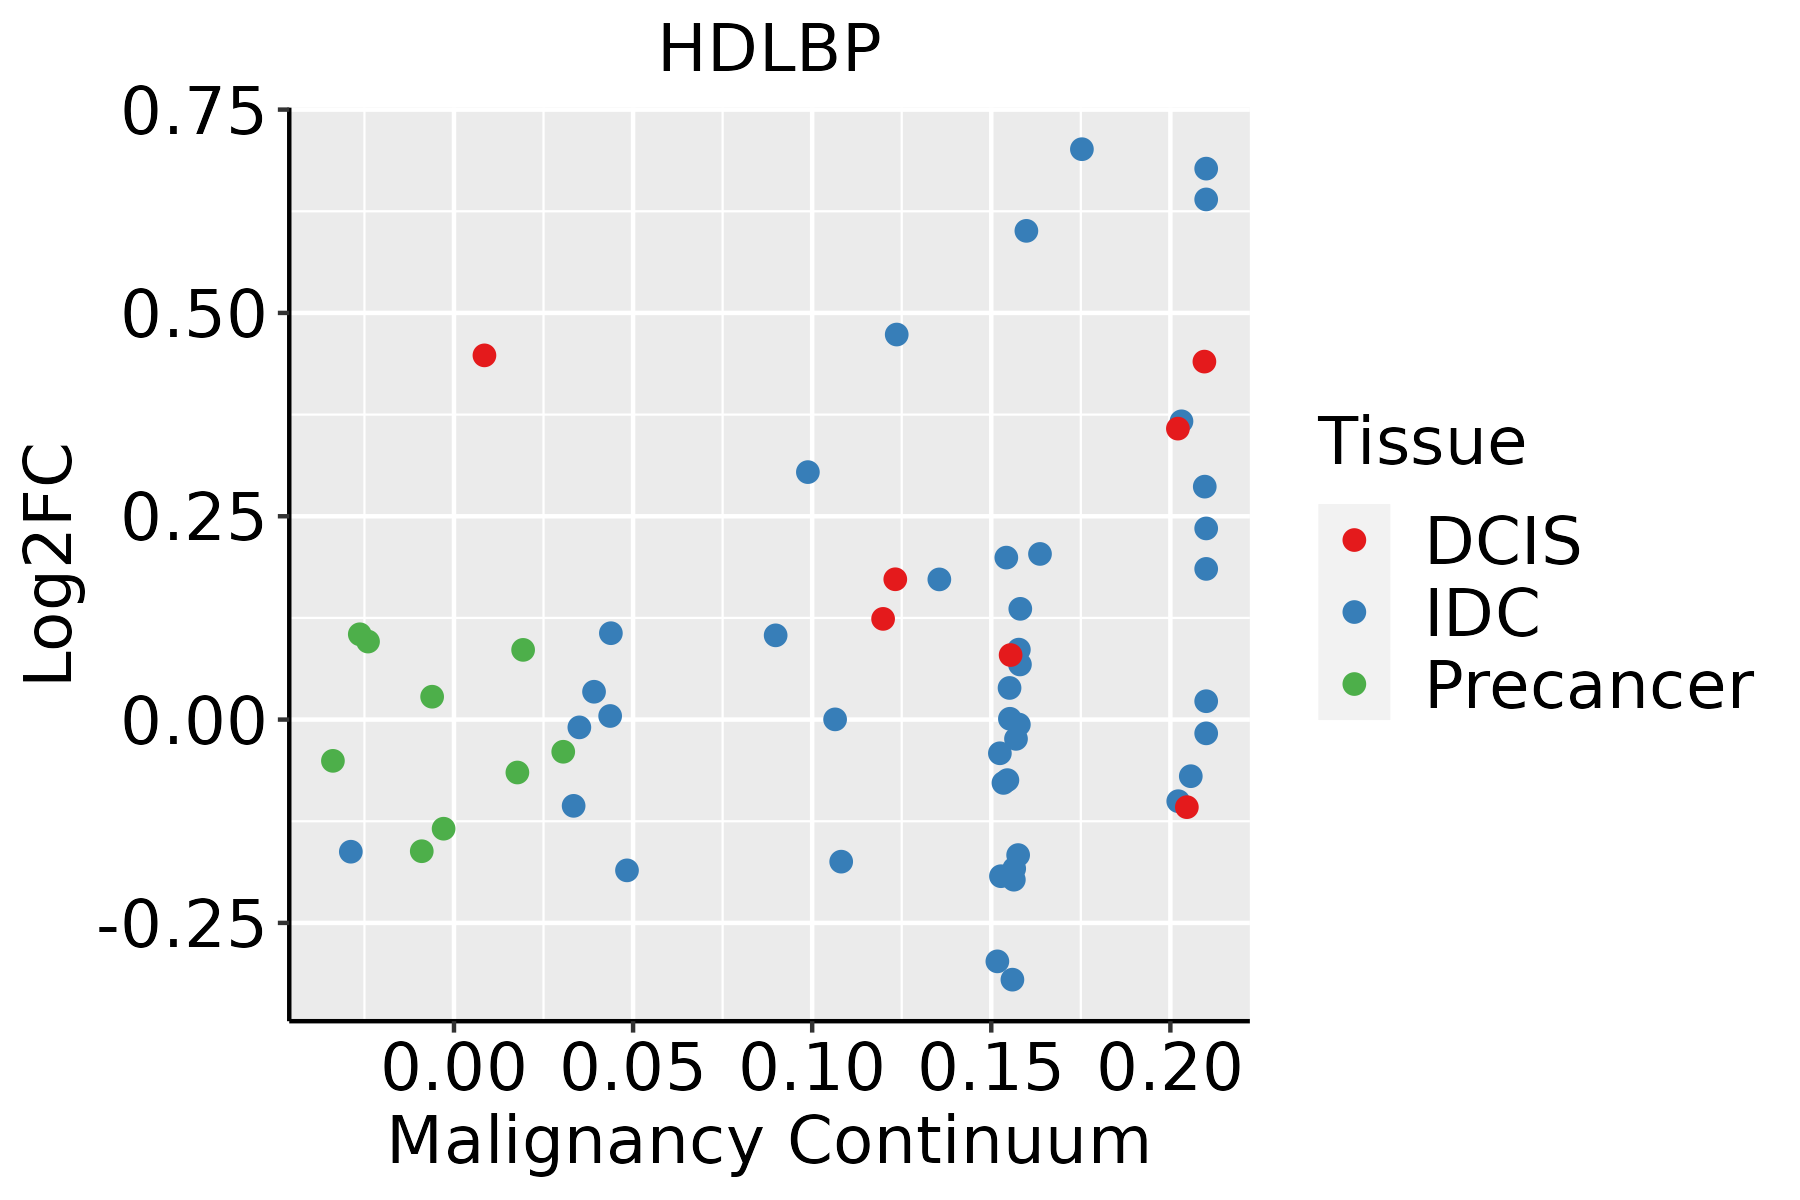 | IDC: Invasive ductal carcinoma |
| DCIS: Ductal carcinoma in situ | ||
| Precancer(BRCA1-mut): Precancerous lesion from BRCA1 mutation carriers | ||
| Colorectum (GSE201348) |  | FAP: Familial adenomatous polyposis |
| CRC: Colorectal cancer | ||
| Colorectum (HTA11) |  | AD: Adenomas |
| SER: Sessile serrated lesions | ||
| MSI-H: Microsatellite-high colorectal cancer | ||
| MSS: Microsatellite stable colorectal cancer | ||
| Esophagus | 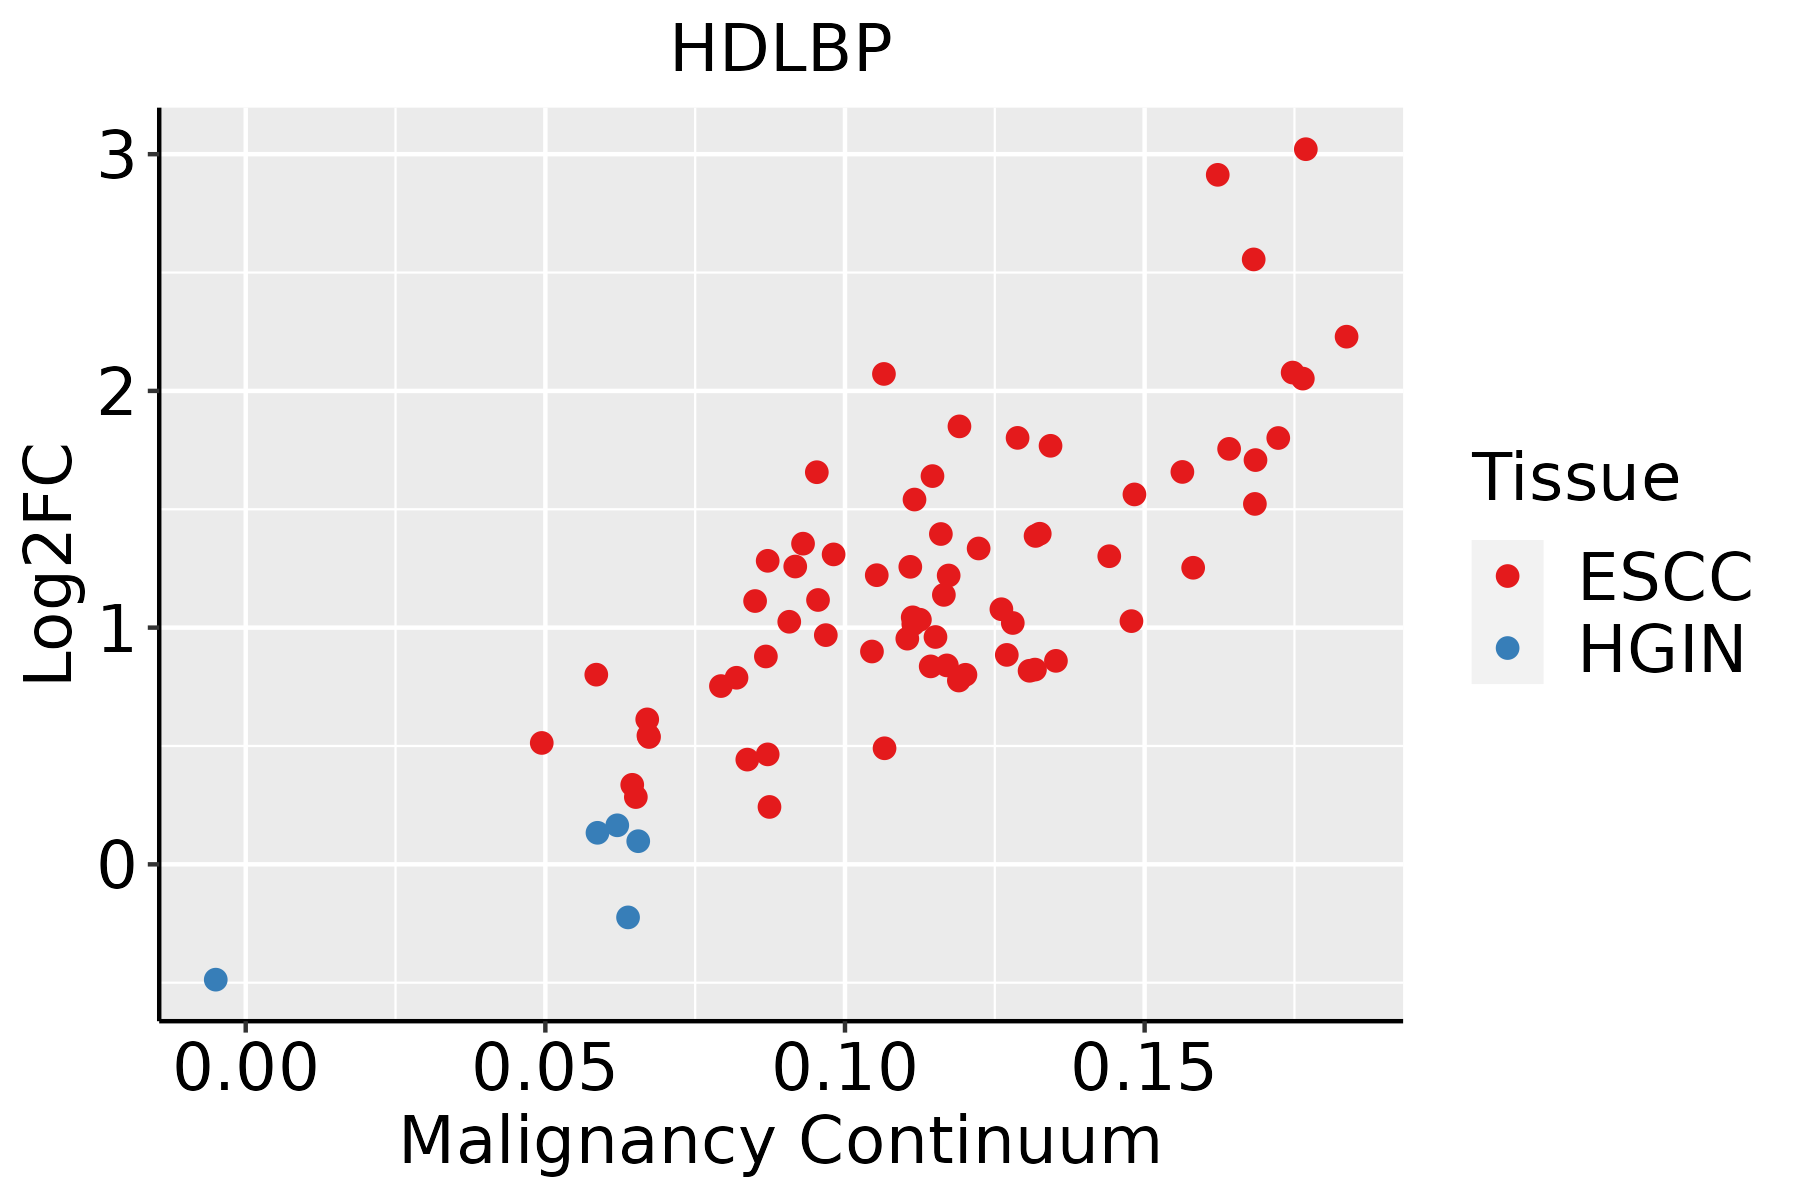 | ESCC: Esophageal squamous cell carcinoma |
| HGIN: High-grade intraepithelial neoplasias | ||
| LGIN: Low-grade intraepithelial neoplasias | ||
| Liver | 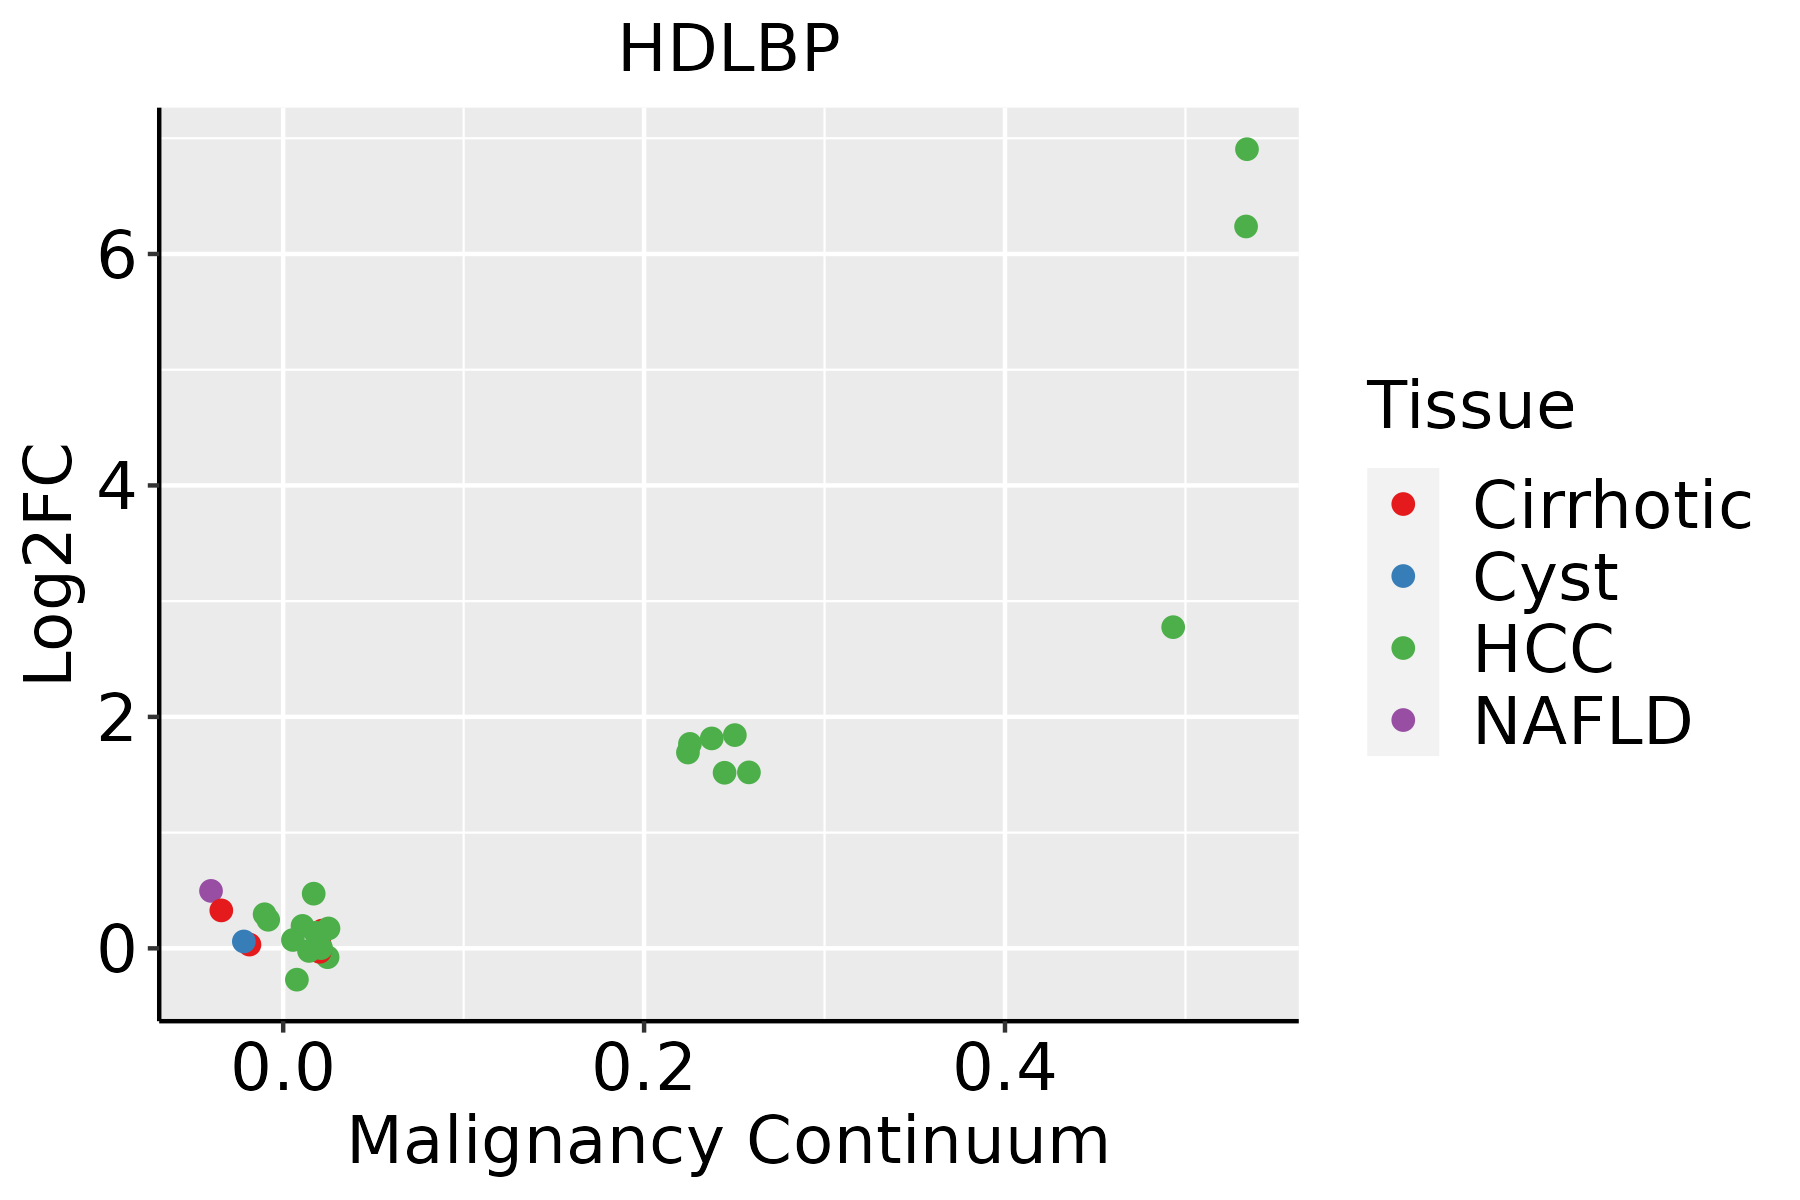 | HCC: Hepatocellular carcinoma |
| NAFLD: Non-alcoholic fatty liver disease | ||
| Oral Cavity |  | EOLP: Erosive Oral lichen planus |
| LP: leukoplakia | ||
| NEOLP: Non-erosive oral lichen planus | ||
| OSCC: Oral squamous cell carcinoma | ||
| Prostate |  | BPH: Benign Prostatic Hyperplasia |
| Skin | 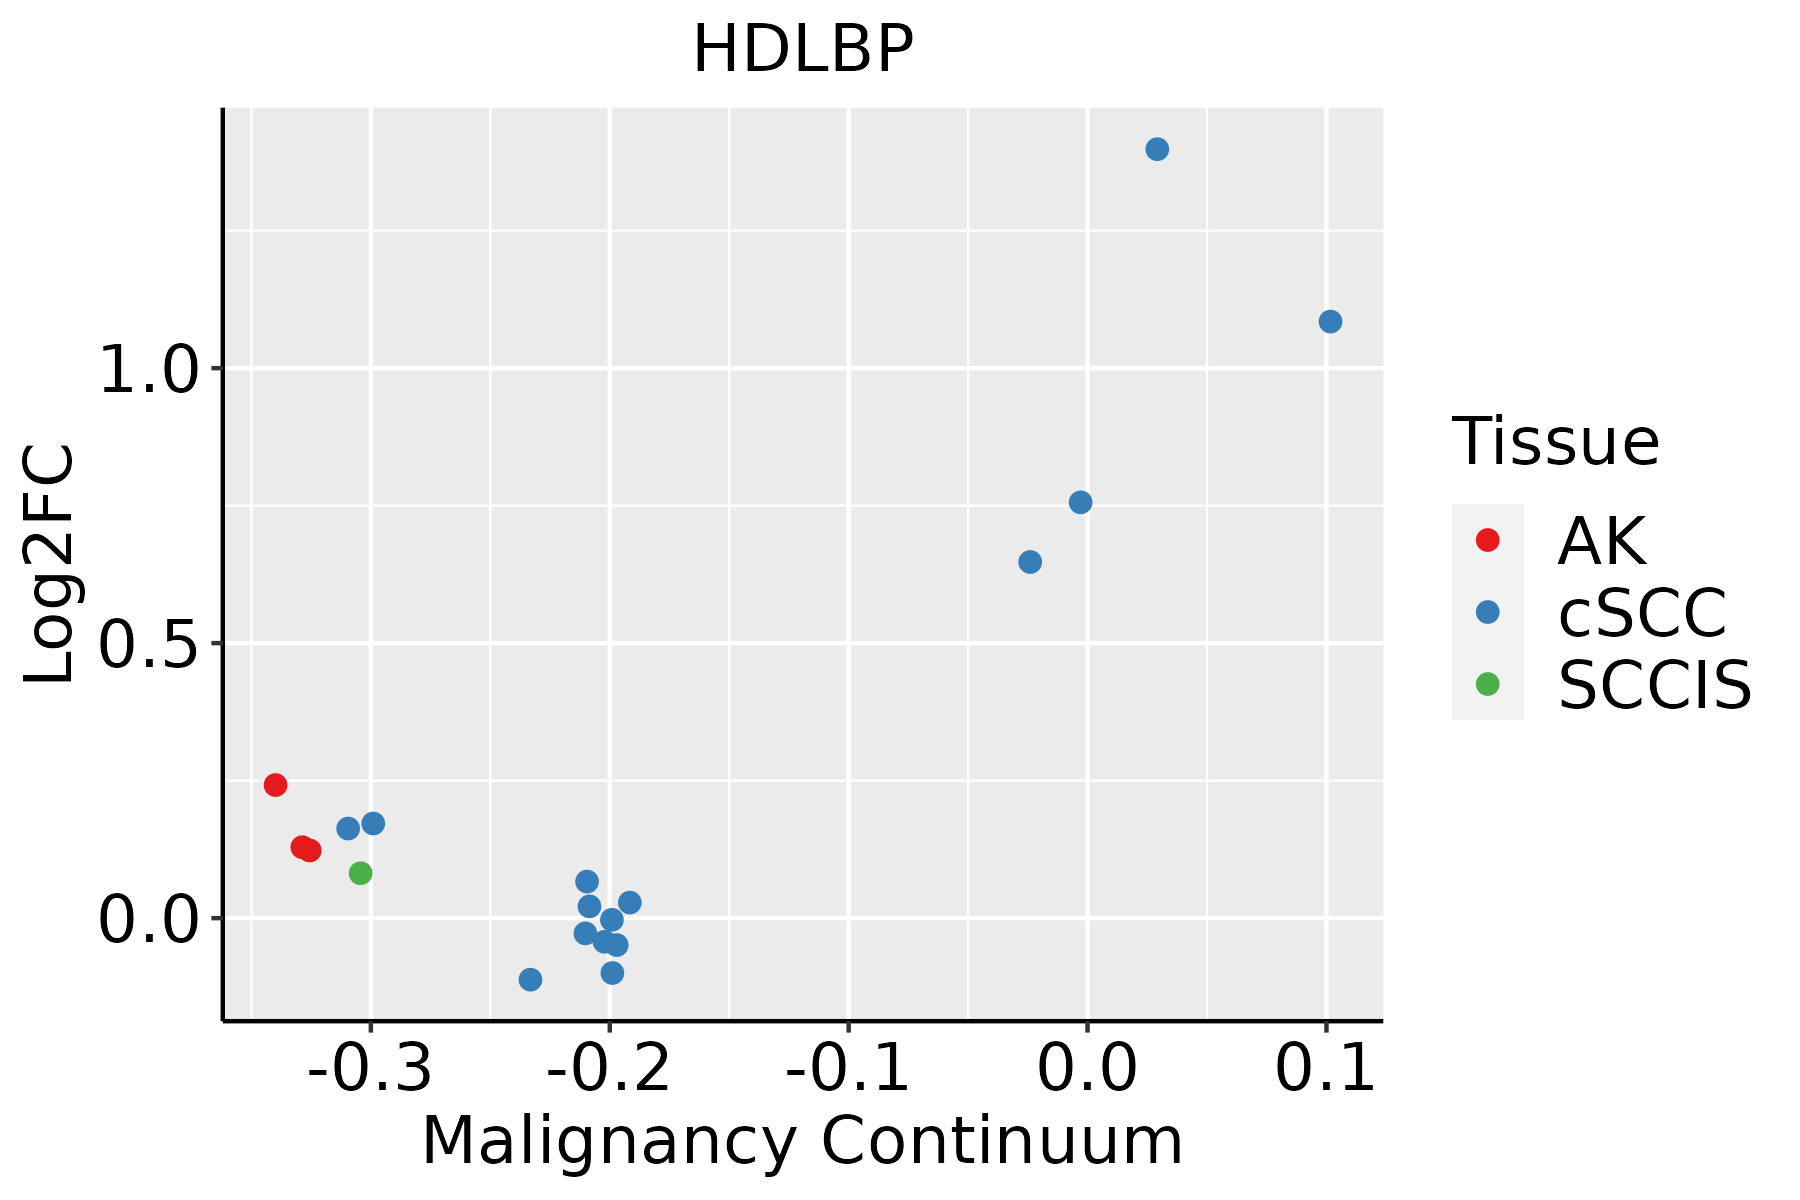 | AK: Actinic keratosis |
| cSCC: Cutaneous squamous cell carcinoma | ||
| SCCIS:squamous cell carcinoma in situ | ||
| Thyroid | 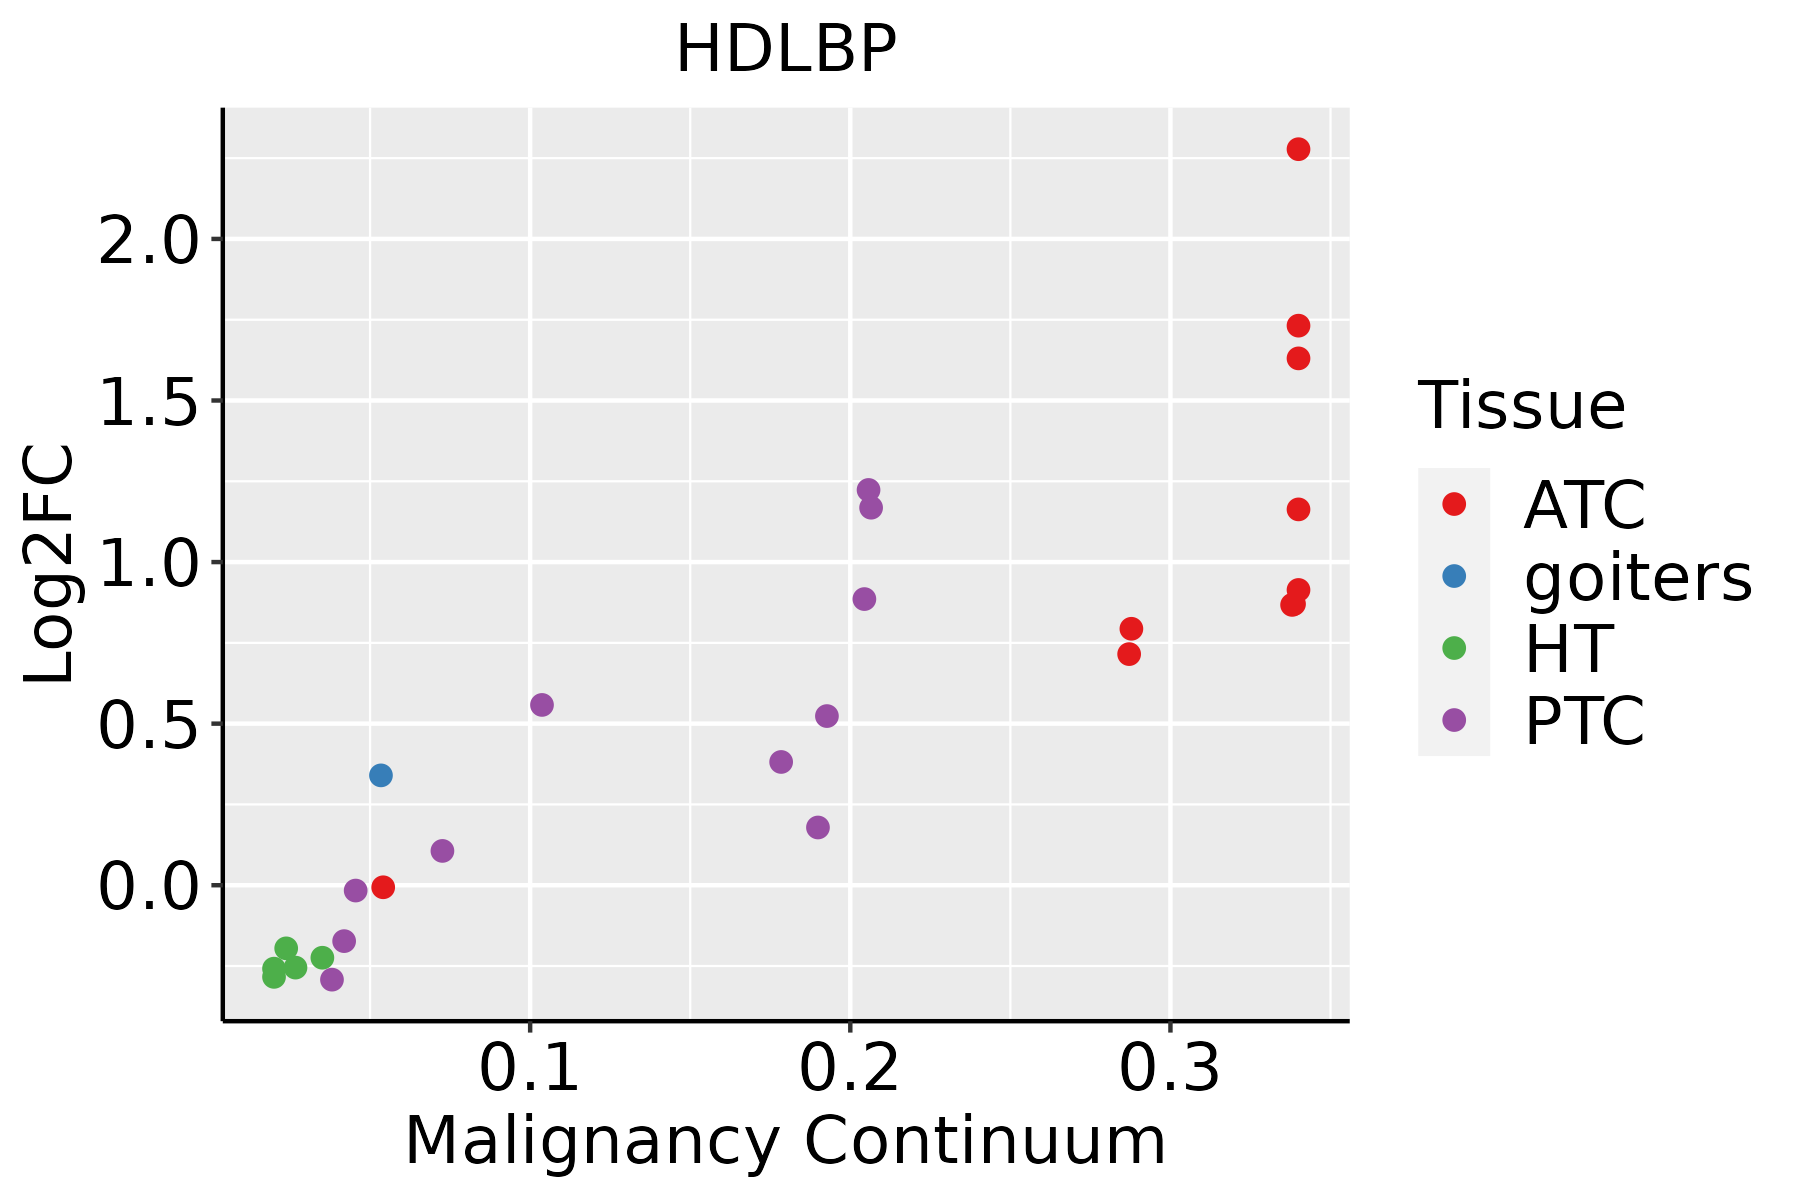 | ATC: Anaplastic thyroid cancer |
| HT: Hashimoto's thyroiditis | ||
| PTC: Papillary thyroid cancer |
| ∗log2FC in expression of this searched gene in stem-like cells from each diseased tissue sample relative to stem-like cells in normal samples in each tissue plotted against the malignancy continuum. Samples are colored based on if they are from different disease stage. |
Top |
Malignant transformation related pathway analysis |
| Find out the enriched GO biological processes and KEGG pathways involved in transition from healthy to precancer to cancer |
| Tissue | Disease Stage | Enriched GO biological Processes |
| Colorectum | AD |  |
| Colorectum | SER |  |
| Colorectum | MSS |  |
| Colorectum | MSI-H |  |
| Colorectum | FAP |  |
| ∗Top 15 enriched GO BP terms are showed in the bar plot of each disease state in each tissue. Each row represents a significant GO biological process which is colored according to the -log10(p.adjust). |
| Page: 1 2 3 4 5 6 7 8 9 |
| GO ID | Tissue | Disease Stage | Description | Gene Ratio | Bg Ratio | pvalue | p.adjust | Count |
| GO:0006066 | Colorectum | AD | alcohol metabolic process | 106/3918 | 353/18723 | 3.02e-05 | 5.57e-04 | 106 |
| GO:0010876 | Colorectum | AD | lipid localization | 120/3918 | 448/18723 | 1.59e-03 | 1.33e-02 | 120 |
| GO:0006869 | Colorectum | AD | lipid transport | 108/3918 | 398/18723 | 1.67e-03 | 1.39e-02 | 108 |
| GO:0008202 | Colorectum | AD | steroid metabolic process | 85/3918 | 319/18723 | 8.07e-03 | 4.75e-02 | 85 |
| GO:00060661 | Colorectum | SER | alcohol metabolic process | 79/2897 | 353/18723 | 3.50e-04 | 5.50e-03 | 79 |
| GO:00060662 | Colorectum | MSS | alcohol metabolic process | 92/3467 | 353/18723 | 2.57e-04 | 3.46e-03 | 92 |
| GO:00108761 | Colorectum | MSS | lipid localization | 104/3467 | 448/18723 | 6.76e-03 | 4.38e-02 | 104 |
| GO:00068691 | Colorectum | FAP | lipid transport | 81/2622 | 398/18723 | 2.84e-04 | 3.76e-03 | 81 |
| GO:00108762 | Colorectum | FAP | lipid localization | 85/2622 | 448/18723 | 1.92e-03 | 1.63e-02 | 85 |
| GO:00060663 | Colorectum | FAP | alcohol metabolic process | 69/2622 | 353/18723 | 2.29e-03 | 1.85e-02 | 69 |
| GO:00068692 | Colorectum | CRC | lipid transport | 63/2078 | 398/18723 | 2.36e-03 | 2.26e-02 | 63 |
| GO:00060664 | Colorectum | CRC | alcohol metabolic process | 57/2078 | 353/18723 | 2.37e-03 | 2.27e-02 | 57 |
| GO:00108763 | Colorectum | CRC | lipid localization | 68/2078 | 448/18723 | 4.60e-03 | 3.58e-02 | 68 |
| GO:00060668 | Esophagus | ESCC | alcohol metabolic process | 202/8552 | 353/18723 | 7.32e-06 | 7.26e-05 | 202 |
| GO:19026524 | Esophagus | ESCC | secondary alcohol metabolic process | 87/8552 | 147/18723 | 6.58e-04 | 3.50e-03 | 87 |
| GO:00082034 | Esophagus | ESCC | cholesterol metabolic process | 79/8552 | 137/18723 | 3.11e-03 | 1.29e-02 | 79 |
| GO:00161254 | Esophagus | ESCC | sterol metabolic process | 86/8552 | 152/18723 | 4.37e-03 | 1.73e-02 | 86 |
| GO:00082023 | Liver | NAFLD | steroid metabolic process | 69/1882 | 319/18723 | 5.90e-10 | 1.28e-07 | 69 |
| GO:00108765 | Liver | NAFLD | lipid localization | 79/1882 | 448/18723 | 4.75e-07 | 2.92e-05 | 79 |
| GO:00068694 | Liver | NAFLD | lipid transport | 71/1882 | 398/18723 | 1.16e-06 | 5.59e-05 | 71 |
| Page: 1 2 3 |
| Pathway ID | Tissue | Disease Stage | Description | Gene Ratio | Bg Ratio | pvalue | p.adjust | qvalue | Count |
| Page: 1 |
Top |
Cell-cell communication analysis |
| Identification of potential cell-cell interactions between two cell types and their ligand-receptor pairs for different disease states |
| Ligand | Receptor | LRpair | Pathway | Tissue | Disease Stage |
| Page: 1 |
Top |
Single-cell gene regulatory network inference analysis |
| Find out the significant the regulons (TFs) and the target genes of each regulon across cell types for different disease states |
| TF | Cell Type | Tissue | Disease Stage | Target Gene | RSS | Regulon Activity |
| ∗The dot plots of a searched regulon are shown for all cell subpopulations in each disease state of each tissue based on the regulon specific score inferred using pySCENIC and by calculating the average expression. |
| Page: 1 |
Top |
Somatic mutation of malignant transformation related genes |
| Annotation of somatic variants for genes involved in malignant transformation |
| Hugo Symbol | Variant Class | Variant Classification | dbSNP RS | HGVSc | HGVSp | HGVSp Short | SWISSPROT | BIOTYPE | SIFT | PolyPhen | Tumor Sample Barcode | Tissue | Histology | Sex | Age | Stage | Therapy Types | Drugs | Outcome |
| HDLBP | insertion | In_Frame_Ins | novel | c.2442_2443insCAC | p.His814dup | p.H814dup | protein_coding | TCGA-RD-A7C1-01 | Stomach | stomach adenocarcinoma | Male | >=65 | I/II | Unknown | Unknown | PD | |||
| HDLBP | deletion | Frame_Shift_Del | c.2240delN | p.Gly747AlafsTer27 | p.G747Afs*27 | protein_coding | TCGA-VQ-A8PP-01 | Stomach | stomach adenocarcinoma | Male | >=65 | III/IV | Chemotherapy | fluorouracil | PD | ||||
| HDLBP | SNV | Missense_Mutation | c.2223N>G | p.Phe741Leu | p.F741L | protein_coding | deleterious(0) | probably_damaging(0.987) | TCGA-E3-A3E5-01 | Thyroid | thyroid carcinoma | Male | <65 | I/II | Hormone Therapy | cytomel | SD | ||
| HDLBP | SNV | Missense_Mutation | c.2471N>T | p.Arg824Leu | p.R824L | protein_coding | deleterious(0.01) | possibly_damaging(0.633) | TCGA-ET-A39R-01 | Thyroid | thyroid carcinoma | Female | <65 | I/II | Unknown | Unknown | SD |
| Page: 1 2 3 4 5 6 7 8 9 10 11 12 13 14 15 16 17 18 19 20 |
Top |
Related drugs of malignant transformation related genes |
| Identification of chemicals and drugs interact with genes involved in malignant transfromation |
| (DGIdb 4.0) |
| Entrez ID | Symbol | Category | Interaction Types | Drug Claim Name | Drug Name | PMIDs |
| Page: 1 |

Copyright 2023-Present -The University of Texas Health Science Center at Houston |