
|
|||||
|
 | |
| |
| |
| |
| |
| |
|
Gene: COL4A2 |
Gene summary for COL4A2 |
| Gene information | Species | Human | Gene symbol | COL4A2 | Gene ID | 1284 |
| Gene name | collagen type IV alpha 2 chain | |
| Gene Alias | BSVD2 | |
| Cytomap | 13q34 | |
| Gene Type | protein-coding | GO ID | GO:0001525 | UniProtAcc | A0A024RDW8 |
Top |
Malignant transformation analysis |
| Identification of the aberrant gene expression in precancerous and cancerous lesions by comparing the gene expression of stem-like cells in diseased tissues with normal stem cells |
| Entrez ID | Symbol | Replicates | Species | Organ | Tissue | Adj P-value | Log2FC | Malignancy |
| 1284 | COL4A2 | LZE2T | Human | Esophagus | ESCC | 6.05e-08 | 8.38e-01 | 0.082 |
| 1284 | COL4A2 | LZE7T | Human | Esophagus | ESCC | 5.86e-13 | 7.32e-01 | 0.0667 |
| 1284 | COL4A2 | LZE22T | Human | Esophagus | ESCC | 1.17e-03 | 4.73e-01 | 0.068 |
| 1284 | COL4A2 | LZE21T | Human | Esophagus | ESCC | 1.38e-03 | 2.82e-01 | 0.0655 |
| 1284 | COL4A2 | P2T-E | Human | Esophagus | ESCC | 1.26e-79 | 1.45e+00 | 0.1177 |
| 1284 | COL4A2 | P4T-E | Human | Esophagus | ESCC | 2.79e-24 | 8.24e-01 | 0.1323 |
| 1284 | COL4A2 | P5T-E | Human | Esophagus | ESCC | 1.37e-04 | 4.87e-01 | 0.1327 |
| 1284 | COL4A2 | P8T-E | Human | Esophagus | ESCC | 6.52e-08 | 2.33e-01 | 0.0889 |
| 1284 | COL4A2 | P9T-E | Human | Esophagus | ESCC | 9.01e-27 | 1.02e+00 | 0.1131 |
| 1284 | COL4A2 | P10T-E | Human | Esophagus | ESCC | 4.13e-53 | 1.20e+00 | 0.116 |
| 1284 | COL4A2 | P11T-E | Human | Esophagus | ESCC | 2.19e-50 | 2.09e+00 | 0.1426 |
| 1284 | COL4A2 | P12T-E | Human | Esophagus | ESCC | 6.18e-32 | 7.20e-01 | 0.1122 |
| 1284 | COL4A2 | P15T-E | Human | Esophagus | ESCC | 1.20e-23 | 7.83e-01 | 0.1149 |
| 1284 | COL4A2 | P16T-E | Human | Esophagus | ESCC | 1.42e-106 | 2.88e+00 | 0.1153 |
| 1284 | COL4A2 | P17T-E | Human | Esophagus | ESCC | 1.46e-03 | 1.11e+00 | 0.1278 |
| 1284 | COL4A2 | P19T-E | Human | Esophagus | ESCC | 1.54e-16 | 1.98e+00 | 0.1662 |
| 1284 | COL4A2 | P21T-E | Human | Esophagus | ESCC | 2.29e-21 | 8.71e-01 | 0.1617 |
| 1284 | COL4A2 | P22T-E | Human | Esophagus | ESCC | 5.90e-14 | 3.54e-01 | 0.1236 |
| 1284 | COL4A2 | P23T-E | Human | Esophagus | ESCC | 6.44e-04 | 9.90e-01 | 0.108 |
| 1284 | COL4A2 | P24T-E | Human | Esophagus | ESCC | 7.37e-28 | 1.47e+00 | 0.1287 |
| Page: 1 2 3 4 5 |
| Tissue | Expression Dynamics | Abbreviation |
| Esophagus | 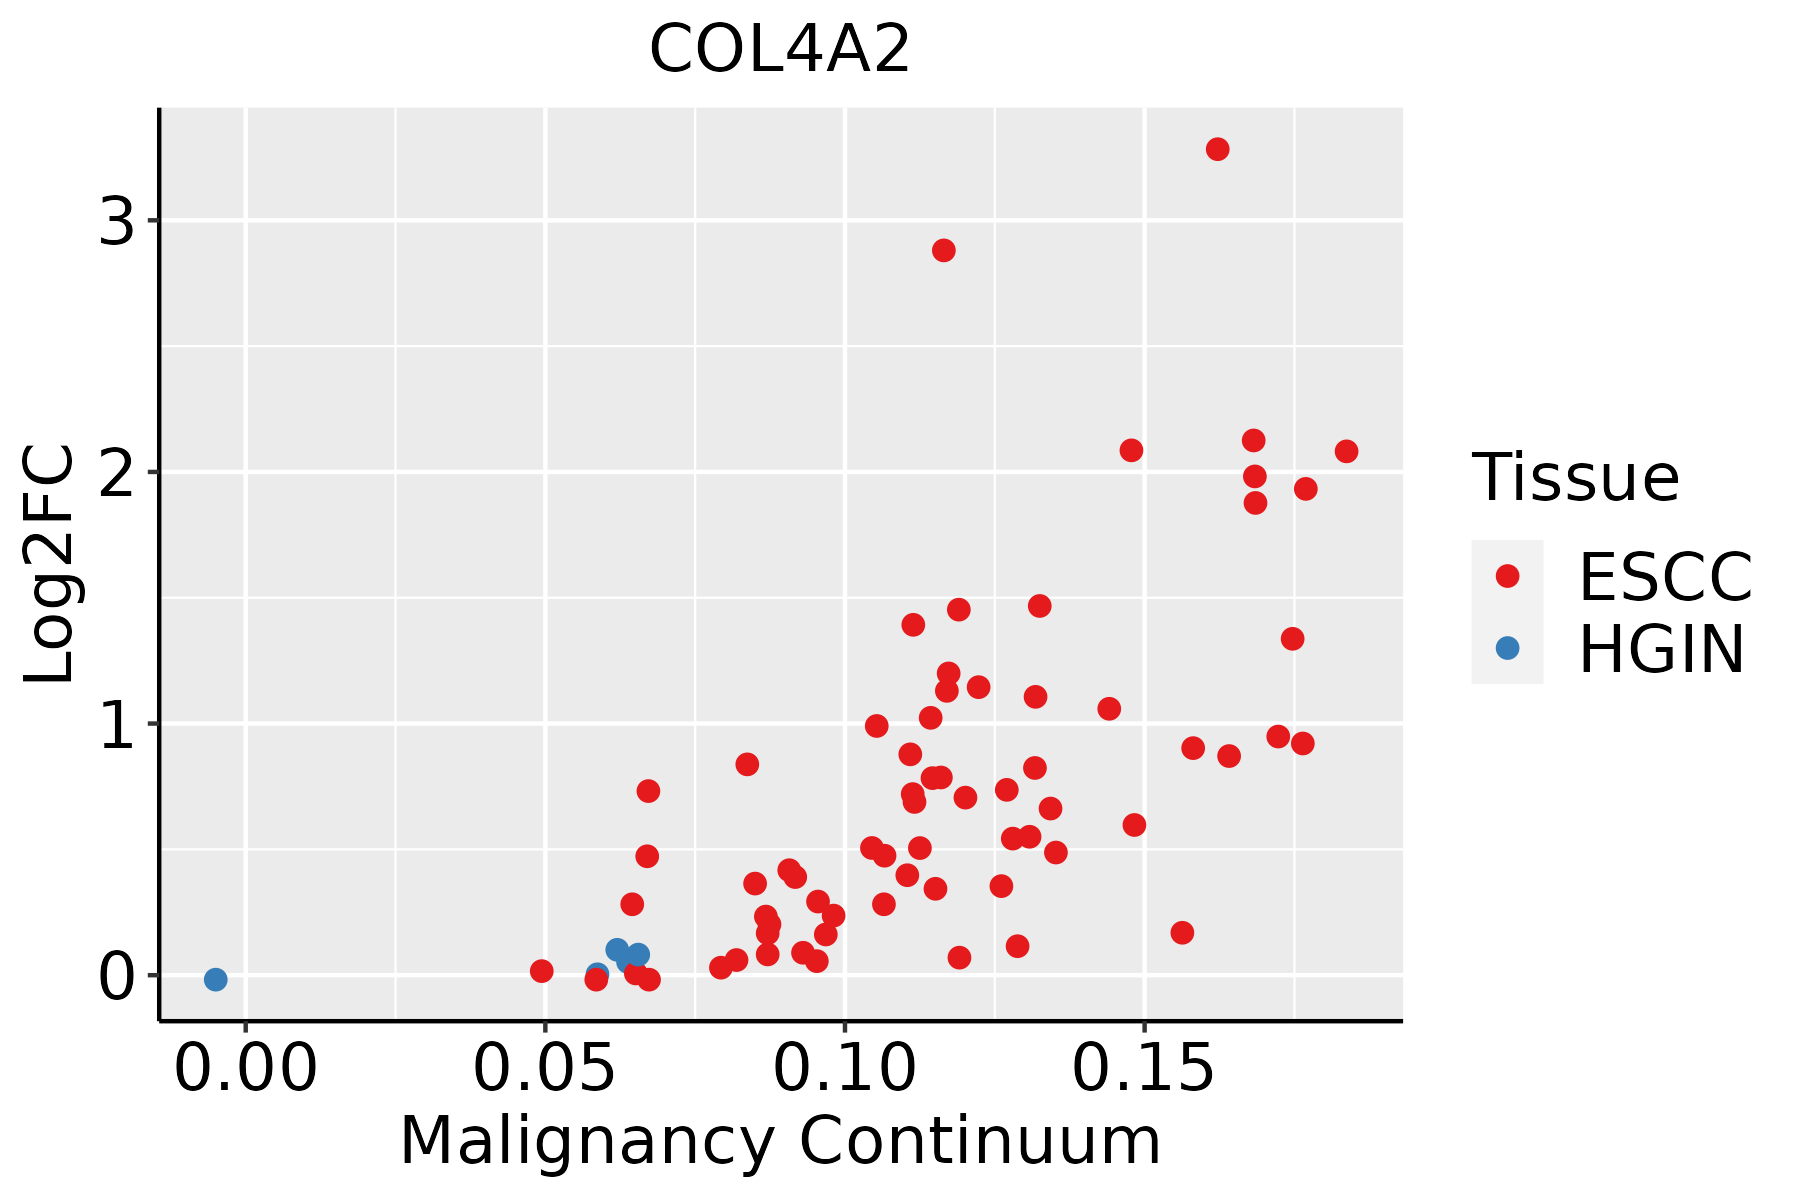 | ESCC: Esophageal squamous cell carcinoma |
| HGIN: High-grade intraepithelial neoplasias | ||
| LGIN: Low-grade intraepithelial neoplasias | ||
| Liver | 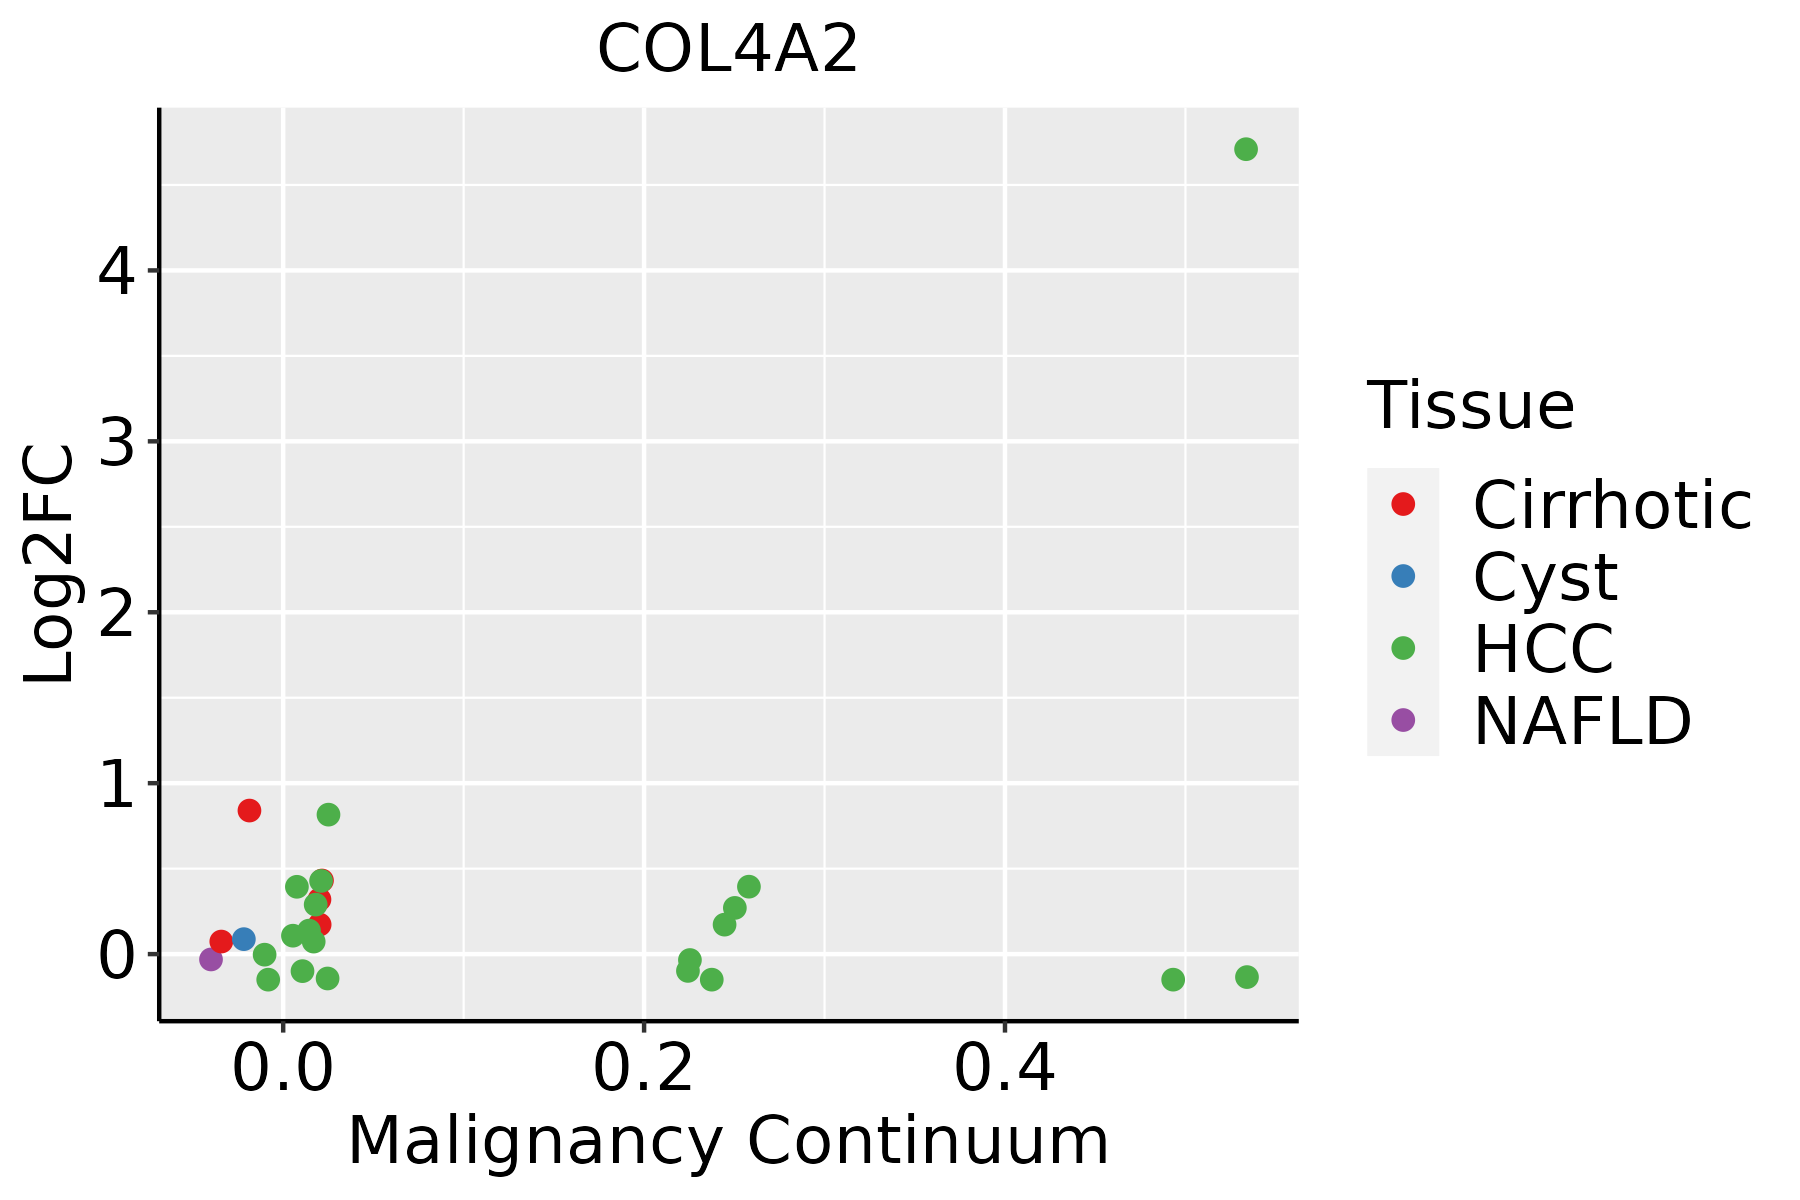 | HCC: Hepatocellular carcinoma |
| NAFLD: Non-alcoholic fatty liver disease | ||
| Oral Cavity |  | EOLP: Erosive Oral lichen planus |
| LP: leukoplakia | ||
| NEOLP: Non-erosive oral lichen planus | ||
| OSCC: Oral squamous cell carcinoma | ||
| Prostate | 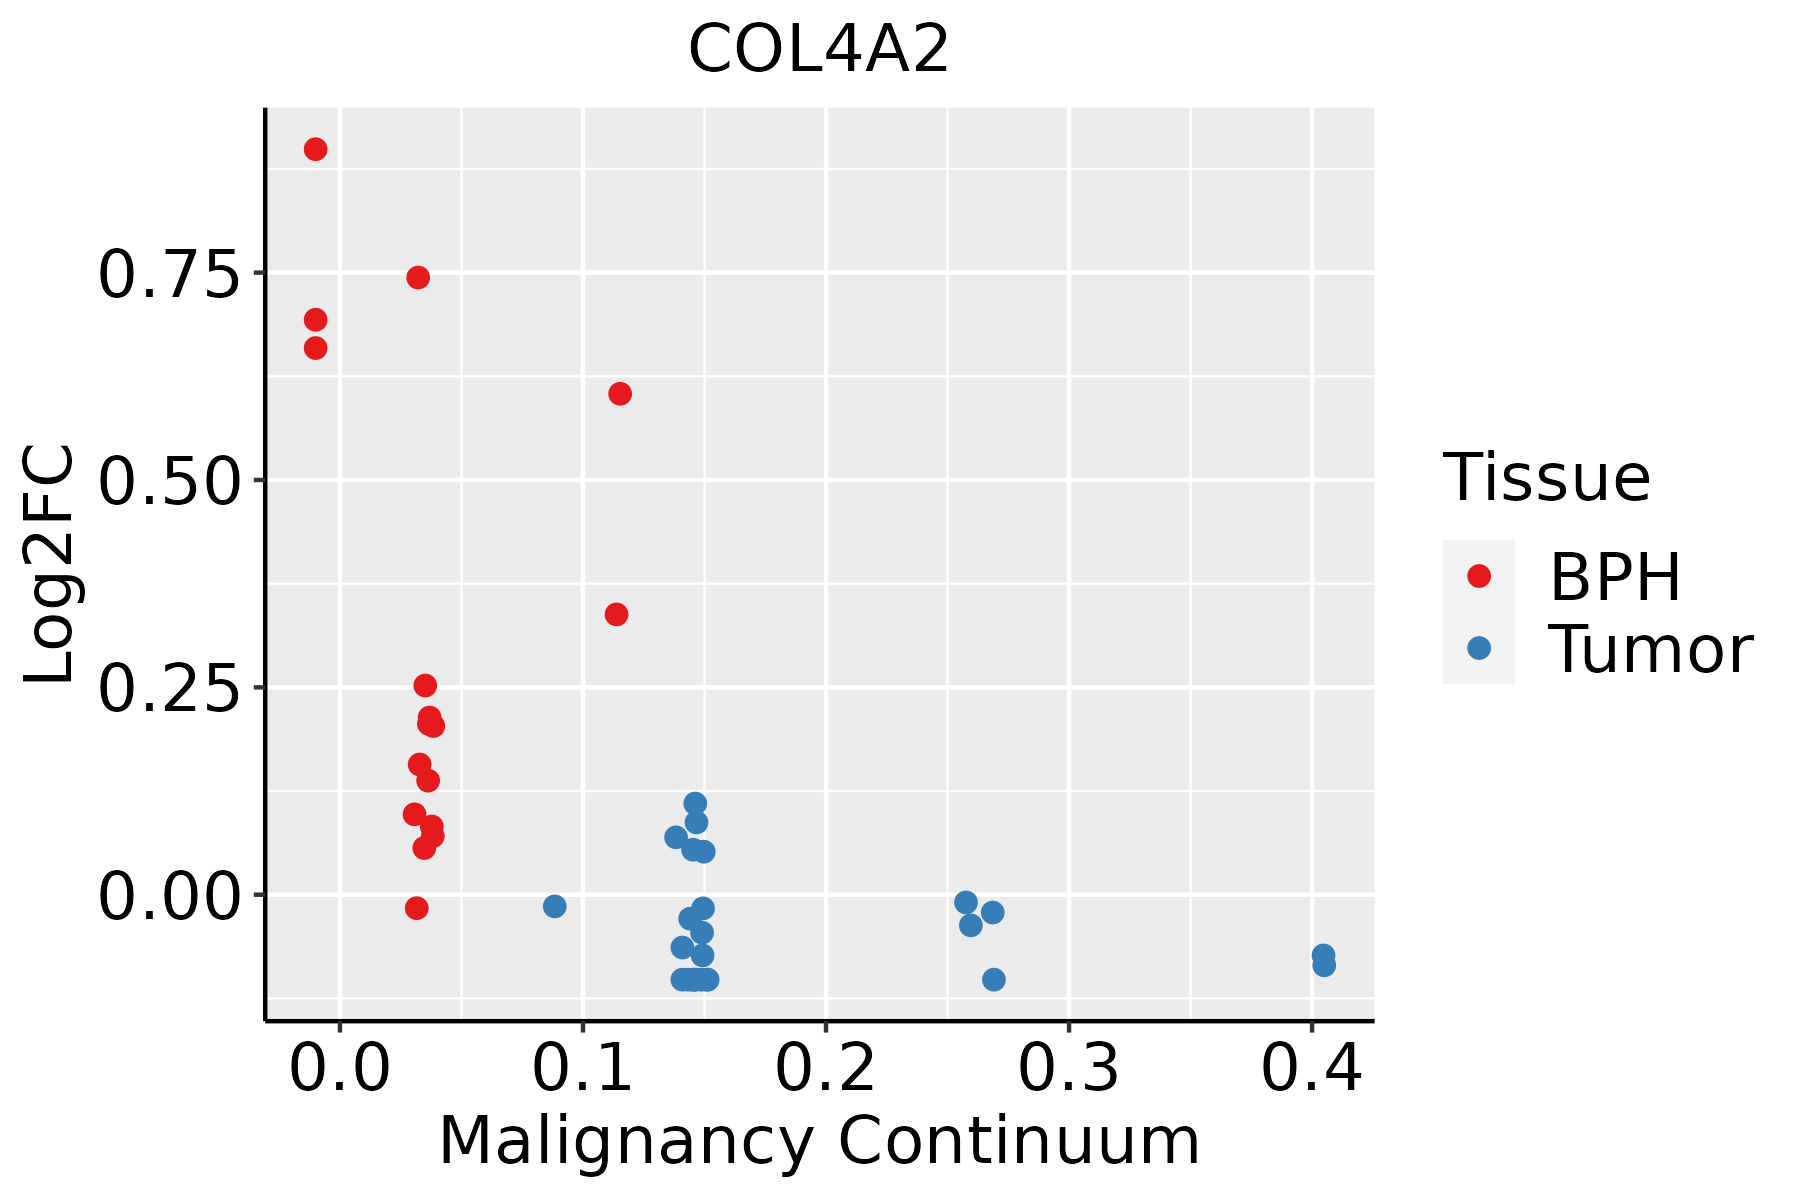 | BPH: Benign Prostatic Hyperplasia |
| Thyroid | 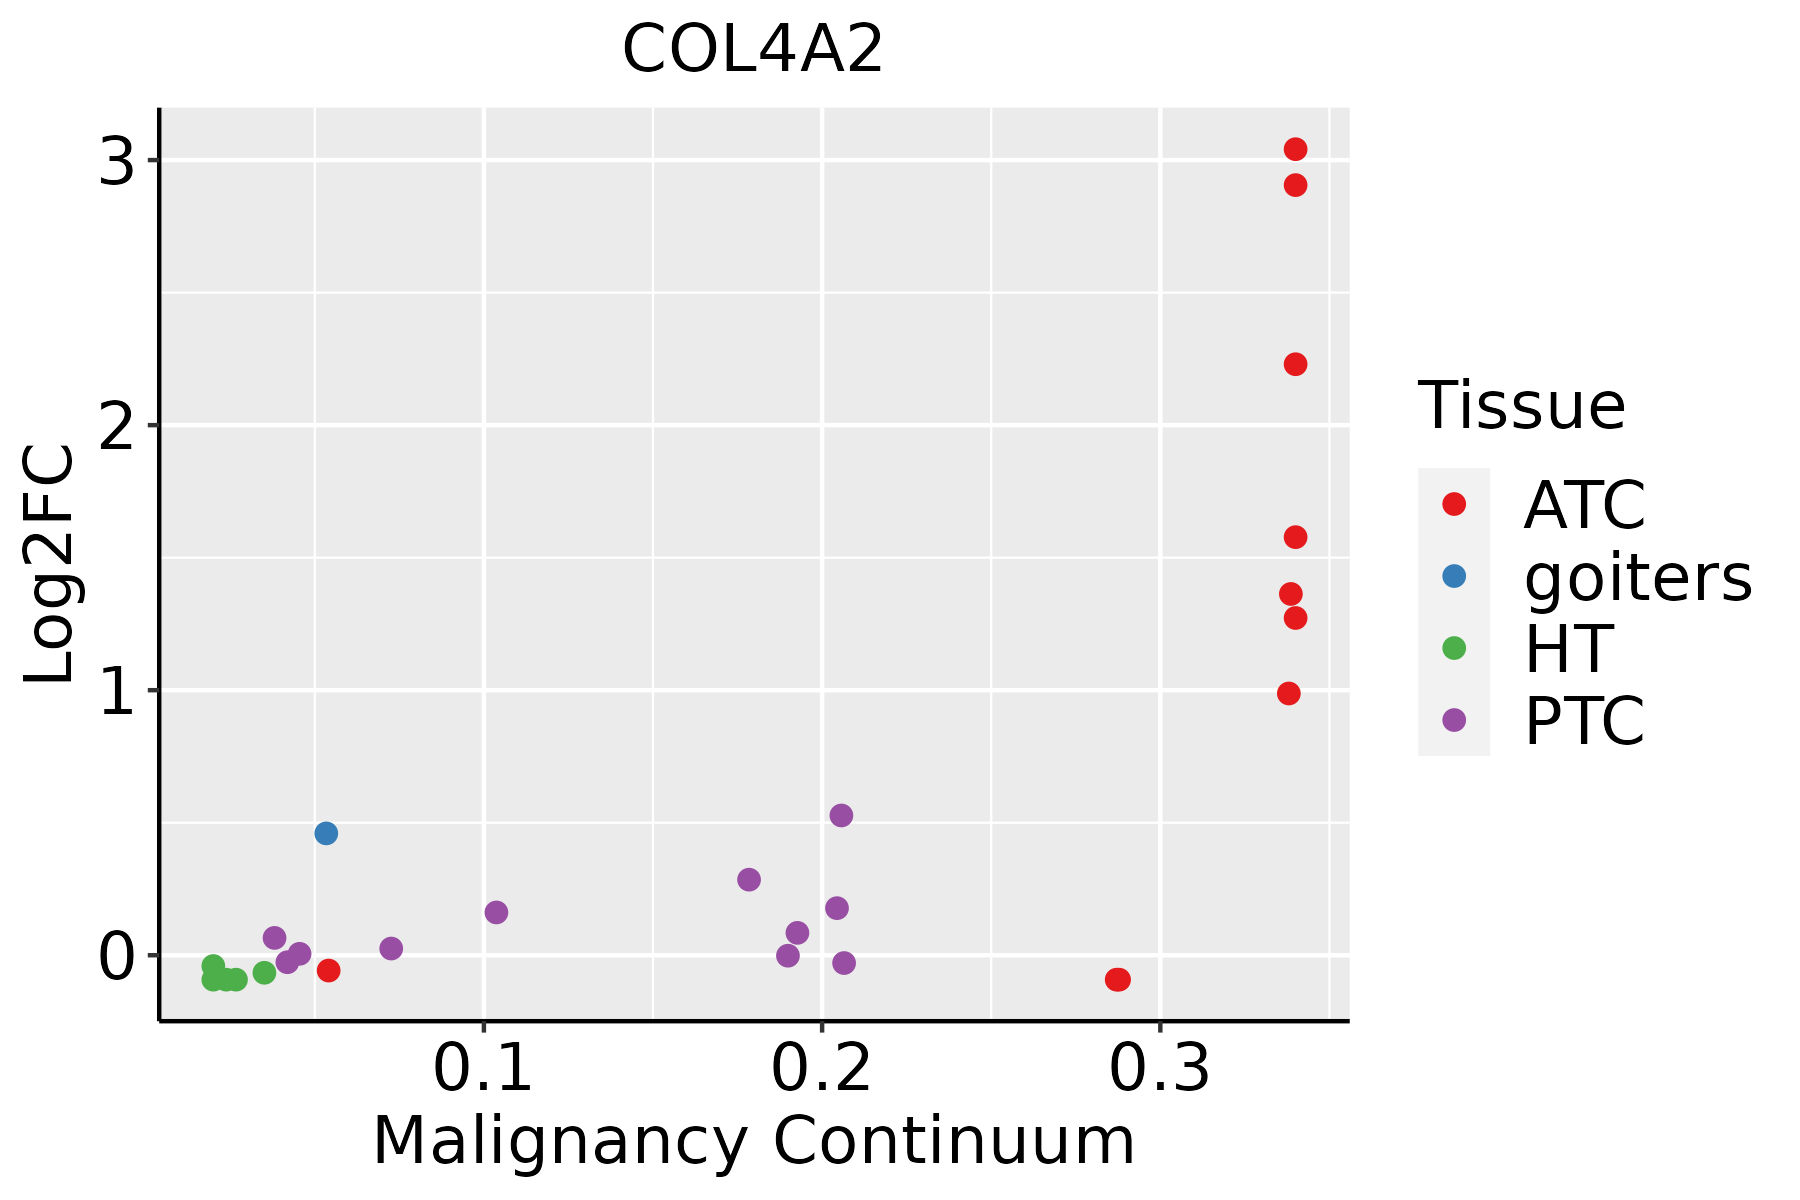 | ATC: Anaplastic thyroid cancer |
| HT: Hashimoto's thyroiditis | ||
| PTC: Papillary thyroid cancer |
| ∗log2FC in expression of this searched gene in stem-like cells from each diseased tissue sample relative to stem-like cells in normal samples in each tissue plotted against the malignancy continuum. Samples are colored based on if they are from different disease stage. |
Top |
Malignant transformation related pathway analysis |
| Find out the enriched GO biological processes and KEGG pathways involved in transition from healthy to precancer to cancer |
| Tissue | Disease Stage | Enriched GO biological Processes |
| Colorectum | AD |  |
| Colorectum | SER |  |
| Colorectum | MSS |  |
| Colorectum | MSI-H |  |
| Colorectum | FAP |  |
| ∗Top 15 enriched GO BP terms are showed in the bar plot of each disease state in each tissue. Each row represents a significant GO biological process which is colored according to the -log10(p.adjust). |
| Page: 1 2 3 4 5 6 7 8 9 |
| GO ID | Tissue | Disease Stage | Description | Gene Ratio | Bg Ratio | pvalue | p.adjust | Count |
| GO:000756820 | Esophagus | ESCC | aging | 201/8552 | 339/18723 | 2.64e-07 | 3.94e-06 | 201 |
| GO:00715599 | Esophagus | ESCC | response to transforming growth factor beta | 157/8552 | 256/18723 | 2.95e-07 | 4.23e-06 | 157 |
| GO:00715609 | Esophagus | ESCC | cellular response to transforming growth factor beta stimulus | 151/8552 | 250/18723 | 1.78e-06 | 2.10e-05 | 151 |
| GO:00073698 | Esophagus | ESCC | gastrulation | 115/8552 | 185/18723 | 4.35e-06 | 4.64e-05 | 115 |
| GO:00074926 | Esophagus | ESCC | endoderm development | 54/8552 | 77/18723 | 1.20e-05 | 1.12e-04 | 54 |
| GO:00301984 | Esophagus | ESCC | extracellular matrix organization | 171/8552 | 301/18723 | 6.08e-05 | 4.67e-04 | 171 |
| GO:00430624 | Esophagus | ESCC | extracellular structure organization | 171/8552 | 302/18723 | 7.73e-05 | 5.76e-04 | 171 |
| GO:00452294 | Esophagus | ESCC | external encapsulating structure organization | 172/8552 | 304/18723 | 7.80e-05 | 5.80e-04 | 172 |
| GO:00017064 | Esophagus | ESCC | endoderm formation | 38/8552 | 54/18723 | 2.08e-04 | 1.31e-03 | 38 |
| GO:00017044 | Esophagus | ESCC | formation of primary germ layer | 75/8552 | 121/18723 | 2.17e-04 | 1.36e-03 | 75 |
| GO:00359873 | Esophagus | ESCC | endodermal cell differentiation | 32/8552 | 45/18723 | 4.87e-04 | 2.70e-03 | 32 |
| GO:007155911 | Liver | Cirrhotic | response to transforming growth factor beta | 96/4634 | 256/18723 | 3.55e-06 | 6.09e-05 | 96 |
| GO:007156011 | Liver | Cirrhotic | cellular response to transforming growth factor beta stimulus | 93/4634 | 250/18723 | 7.34e-06 | 1.13e-04 | 93 |
| GO:000756812 | Liver | Cirrhotic | aging | 117/4634 | 339/18723 | 3.13e-05 | 3.91e-04 | 117 |
| GO:0014823 | Liver | Cirrhotic | response to activity | 30/4634 | 76/18723 | 3.19e-03 | 1.80e-02 | 30 |
| GO:0007492 | Liver | Cirrhotic | endoderm development | 29/4634 | 77/18723 | 8.02e-03 | 3.76e-02 | 29 |
| GO:000756822 | Liver | HCC | aging | 185/7958 | 339/18723 | 4.28e-06 | 5.50e-05 | 185 |
| GO:007155921 | Liver | HCC | response to transforming growth factor beta | 141/7958 | 256/18723 | 3.08e-05 | 3.16e-04 | 141 |
| GO:007156021 | Liver | HCC | cellular response to transforming growth factor beta stimulus | 137/7958 | 250/18723 | 5.47e-05 | 5.14e-04 | 137 |
| GO:00148231 | Liver | HCC | response to activity | 45/7958 | 76/18723 | 2.42e-03 | 1.18e-02 | 45 |
| Page: 1 2 3 4 5 |
| Pathway ID | Tissue | Disease Stage | Description | Gene Ratio | Bg Ratio | pvalue | p.adjust | qvalue | Count |
| hsa0516510 | Esophagus | ESCC | Human papillomavirus infection | 215/4205 | 331/8465 | 7.86e-09 | 7.12e-08 | 3.65e-08 | 215 |
| hsa052229 | Esophagus | ESCC | Small cell lung cancer | 69/4205 | 92/8465 | 5.40e-07 | 3.85e-06 | 1.97e-06 | 69 |
| hsa0493310 | Esophagus | ESCC | AGE-RAGE signaling pathway in diabetic complications | 72/4205 | 100/8465 | 4.15e-06 | 2.28e-05 | 1.17e-05 | 72 |
| hsa0451020 | Esophagus | ESCC | Focal adhesion | 127/4205 | 203/8465 | 1.25e-04 | 4.99e-04 | 2.56e-04 | 127 |
| hsa049268 | Esophagus | ESCC | Relaxin signaling pathway | 81/4205 | 129/8465 | 1.72e-03 | 5.09e-03 | 2.61e-03 | 81 |
| hsa041517 | Esophagus | ESCC | PI3K-Akt signaling pathway | 197/4205 | 354/8465 | 1.24e-02 | 2.83e-02 | 1.45e-02 | 197 |
| hsa0516515 | Esophagus | ESCC | Human papillomavirus infection | 215/4205 | 331/8465 | 7.86e-09 | 7.12e-08 | 3.65e-08 | 215 |
| hsa0522216 | Esophagus | ESCC | Small cell lung cancer | 69/4205 | 92/8465 | 5.40e-07 | 3.85e-06 | 1.97e-06 | 69 |
| hsa0493317 | Esophagus | ESCC | AGE-RAGE signaling pathway in diabetic complications | 72/4205 | 100/8465 | 4.15e-06 | 2.28e-05 | 1.17e-05 | 72 |
| hsa04510111 | Esophagus | ESCC | Focal adhesion | 127/4205 | 203/8465 | 1.25e-04 | 4.99e-04 | 2.56e-04 | 127 |
| hsa0492616 | Esophagus | ESCC | Relaxin signaling pathway | 81/4205 | 129/8465 | 1.72e-03 | 5.09e-03 | 2.61e-03 | 81 |
| hsa0415114 | Esophagus | ESCC | PI3K-Akt signaling pathway | 197/4205 | 354/8465 | 1.24e-02 | 2.83e-02 | 1.45e-02 | 197 |
| hsa0451021 | Liver | Cirrhotic | Focal adhesion | 93/2530 | 203/8465 | 9.27e-07 | 1.10e-05 | 6.80e-06 | 93 |
| hsa05165 | Liver | Cirrhotic | Human papillomavirus infection | 124/2530 | 331/8465 | 1.55e-03 | 7.83e-03 | 4.83e-03 | 124 |
| hsa0451031 | Liver | Cirrhotic | Focal adhesion | 93/2530 | 203/8465 | 9.27e-07 | 1.10e-05 | 6.80e-06 | 93 |
| hsa051651 | Liver | Cirrhotic | Human papillomavirus infection | 124/2530 | 331/8465 | 1.55e-03 | 7.83e-03 | 4.83e-03 | 124 |
| hsa0451041 | Liver | HCC | Focal adhesion | 125/4020 | 203/8465 | 3.12e-05 | 1.88e-04 | 1.04e-04 | 125 |
| hsa051652 | Liver | HCC | Human papillomavirus infection | 188/4020 | 331/8465 | 3.34e-04 | 1.49e-03 | 8.29e-04 | 188 |
| hsa049334 | Liver | HCC | AGE-RAGE signaling pathway in diabetic complications | 62/4020 | 100/8465 | 2.35e-03 | 7.95e-03 | 4.42e-03 | 62 |
| hsa052224 | Liver | HCC | Small cell lung cancer | 57/4020 | 92/8465 | 3.54e-03 | 1.12e-02 | 6.22e-03 | 57 |
| Page: 1 2 3 4 5 |
Top |
Cell-cell communication analysis |
| Identification of potential cell-cell interactions between two cell types and their ligand-receptor pairs for different disease states |
| Ligand | Receptor | LRpair | Pathway | Tissue | Disease Stage |
| COL4A2 | ITGA1_ITGB1 | COL4A2_ITGA1_ITGB1 | COLLAGEN | Breast | ADJ |
| COL4A2 | ITGA2_ITGB1 | COL4A2_ITGA2_ITGB1 | COLLAGEN | Breast | ADJ |
| COL4A2 | CD44 | COL4A2_CD44 | COLLAGEN | Breast | ADJ |
| COL4A2 | SDC4 | COL4A2_SDC4 | COLLAGEN | Breast | ADJ |
| COL4A2 | ITGA1_ITGB1 | COL4A2_ITGA1_ITGB1 | COLLAGEN | Breast | DCIS |
| COL4A2 | ITGA2_ITGB1 | COL4A2_ITGA2_ITGB1 | COLLAGEN | Breast | DCIS |
| COL4A2 | CD44 | COL4A2_CD44 | COLLAGEN | Breast | DCIS |
| COL4A2 | SDC1 | COL4A2_SDC1 | COLLAGEN | Breast | DCIS |
| COL4A2 | SDC4 | COL4A2_SDC4 | COLLAGEN | Breast | DCIS |
| COL4A2 | ITGA1_ITGB1 | COL4A2_ITGA1_ITGB1 | COLLAGEN | Breast | Healthy |
| COL4A2 | ITGA2_ITGB1 | COL4A2_ITGA2_ITGB1 | COLLAGEN | Breast | Healthy |
| COL4A2 | ITGAV_ITGB8 | COL4A2_ITGAV_ITGB8 | COLLAGEN | Breast | Healthy |
| COL4A2 | CD44 | COL4A2_CD44 | COLLAGEN | Breast | Healthy |
| COL4A2 | SDC1 | COL4A2_SDC1 | COLLAGEN | Breast | Healthy |
| COL4A2 | SDC4 | COL4A2_SDC4 | COLLAGEN | Breast | Healthy |
| COL4A2 | ITGA1_ITGB1 | COL4A2_ITGA1_ITGB1 | COLLAGEN | Breast | IDC |
| COL4A2 | CD44 | COL4A2_CD44 | COLLAGEN | Breast | IDC |
| COL4A2 | SDC1 | COL4A2_SDC1 | COLLAGEN | Breast | IDC |
| COL4A2 | SDC4 | COL4A2_SDC4 | COLLAGEN | Breast | IDC |
| COL4A2 | ITGA1_ITGB1 | COL4A2_ITGA1_ITGB1 | COLLAGEN | Breast | Precancer |
| Page: 1 2 3 4 5 6 7 8 9 10 11 12 13 14 15 |
Top |
Single-cell gene regulatory network inference analysis |
| Find out the significant the regulons (TFs) and the target genes of each regulon across cell types for different disease states |
| TF | Cell Type | Tissue | Disease Stage | Target Gene | RSS | Regulon Activity |
| ∗The dot plots of a searched regulon are shown for all cell subpopulations in each disease state of each tissue based on the regulon specific score inferred using pySCENIC and by calculating the average expression. |
| Page: 1 |
Top |
Somatic mutation of malignant transformation related genes |
| Annotation of somatic variants for genes involved in malignant transformation |
| Hugo Symbol | Variant Class | Variant Classification | dbSNP RS | HGVSc | HGVSp | HGVSp Short | SWISSPROT | BIOTYPE | SIFT | PolyPhen | Tumor Sample Barcode | Tissue | Histology | Sex | Age | Stage | Therapy Types | Drugs | Outcome |
| COL4A2 | SNV | Missense_Mutation | rs773874575 | c.359N>T | p.Pro120Leu | p.P120L | P08572 | protein_coding | deleterious(0.01) | probably_damaging(0.999) | TCGA-FY-A4B0-01 | Thyroid | thyroid carcinoma | Male | >=65 | I/II | Hormone Therapy | synthroid | SD |
| COL4A2 | deletion | Frame_Shift_Del | novel | c.4669delN | p.Tyr1557MetfsTer19 | p.Y1557Mfs*19 | P08572 | protein_coding | TCGA-EM-A2P2-01 | Thyroid | thyroid carcinoma | Male | <65 | III/IV | Unknown | Unknown | SD |
| Page: 1 2 3 4 5 6 7 8 9 10 11 12 13 14 15 16 17 18 19 20 |
Top |
Related drugs of malignant transformation related genes |
| Identification of chemicals and drugs interact with genes involved in malignant transfromation |
| (DGIdb 4.0) |
| Entrez ID | Symbol | Category | Interaction Types | Drug Claim Name | Drug Name | PMIDs |
| 1284 | COL4A2 | DRUGGABLE GENOME | NLG919 | NAVOXIMOD | ||
| 1284 | COL4A2 | DRUGGABLE GENOME | CHEMBL2095222 | OCRIPLASMIN | ||
| 1284 | COL4A2 | DRUGGABLE GENOME | CHEMBL2108709 | COLLAGENASE CLOSTRIDIUM HISTOLYTICUM | ||
| 1284 | COL4A2 | DRUGGABLE GENOME | AK107 |
| Page: 1 |

Copyright 2023-Present -The University of Texas Health Science Center at Houston |