
|
|||||
|
 | |
| |
| |
| |
| |
| |
|
Gene: COL15A1 |
Gene summary for COL15A1 |
| Gene information | Species | Human | Gene symbol | COL15A1 | Gene ID | 1306 |
| Gene name | collagen type XV alpha 1 chain | |
| Gene Alias | COL15A1 | |
| Cytomap | 9q22.33 | |
| Gene Type | protein-coding | GO ID | GO:0000902 | UniProtAcc | B3KTP7 |
Top |
Malignant transformation analysis |
| Identification of the aberrant gene expression in precancerous and cancerous lesions by comparing the gene expression of stem-like cells in diseased tissues with normal stem cells |
| Entrez ID | Symbol | Replicates | Species | Organ | Tissue | Adj P-value | Log2FC | Malignancy |
| 1306 | COL15A1 | PTC07 | Human | Thyroid | PTC | 3.89e-02 | 2.60e-02 | 0.2044 |
| 1306 | COL15A1 | ATC11 | Human | Thyroid | ATC | 1.88e-02 | 6.96e-01 | 0.3386 |
| 1306 | COL15A1 | ATC12 | Human | Thyroid | ATC | 8.04e-23 | 1.50e+00 | 0.34 |
| 1306 | COL15A1 | ATC3 | Human | Thyroid | ATC | 8.44e-03 | 6.06e-01 | 0.338 |
| 1306 | COL15A1 | ATC4 | Human | Thyroid | ATC | 7.89e-25 | 1.88e+00 | 0.34 |
| Page: 1 |
| Tissue | Expression Dynamics | Abbreviation |
| Thyroid | 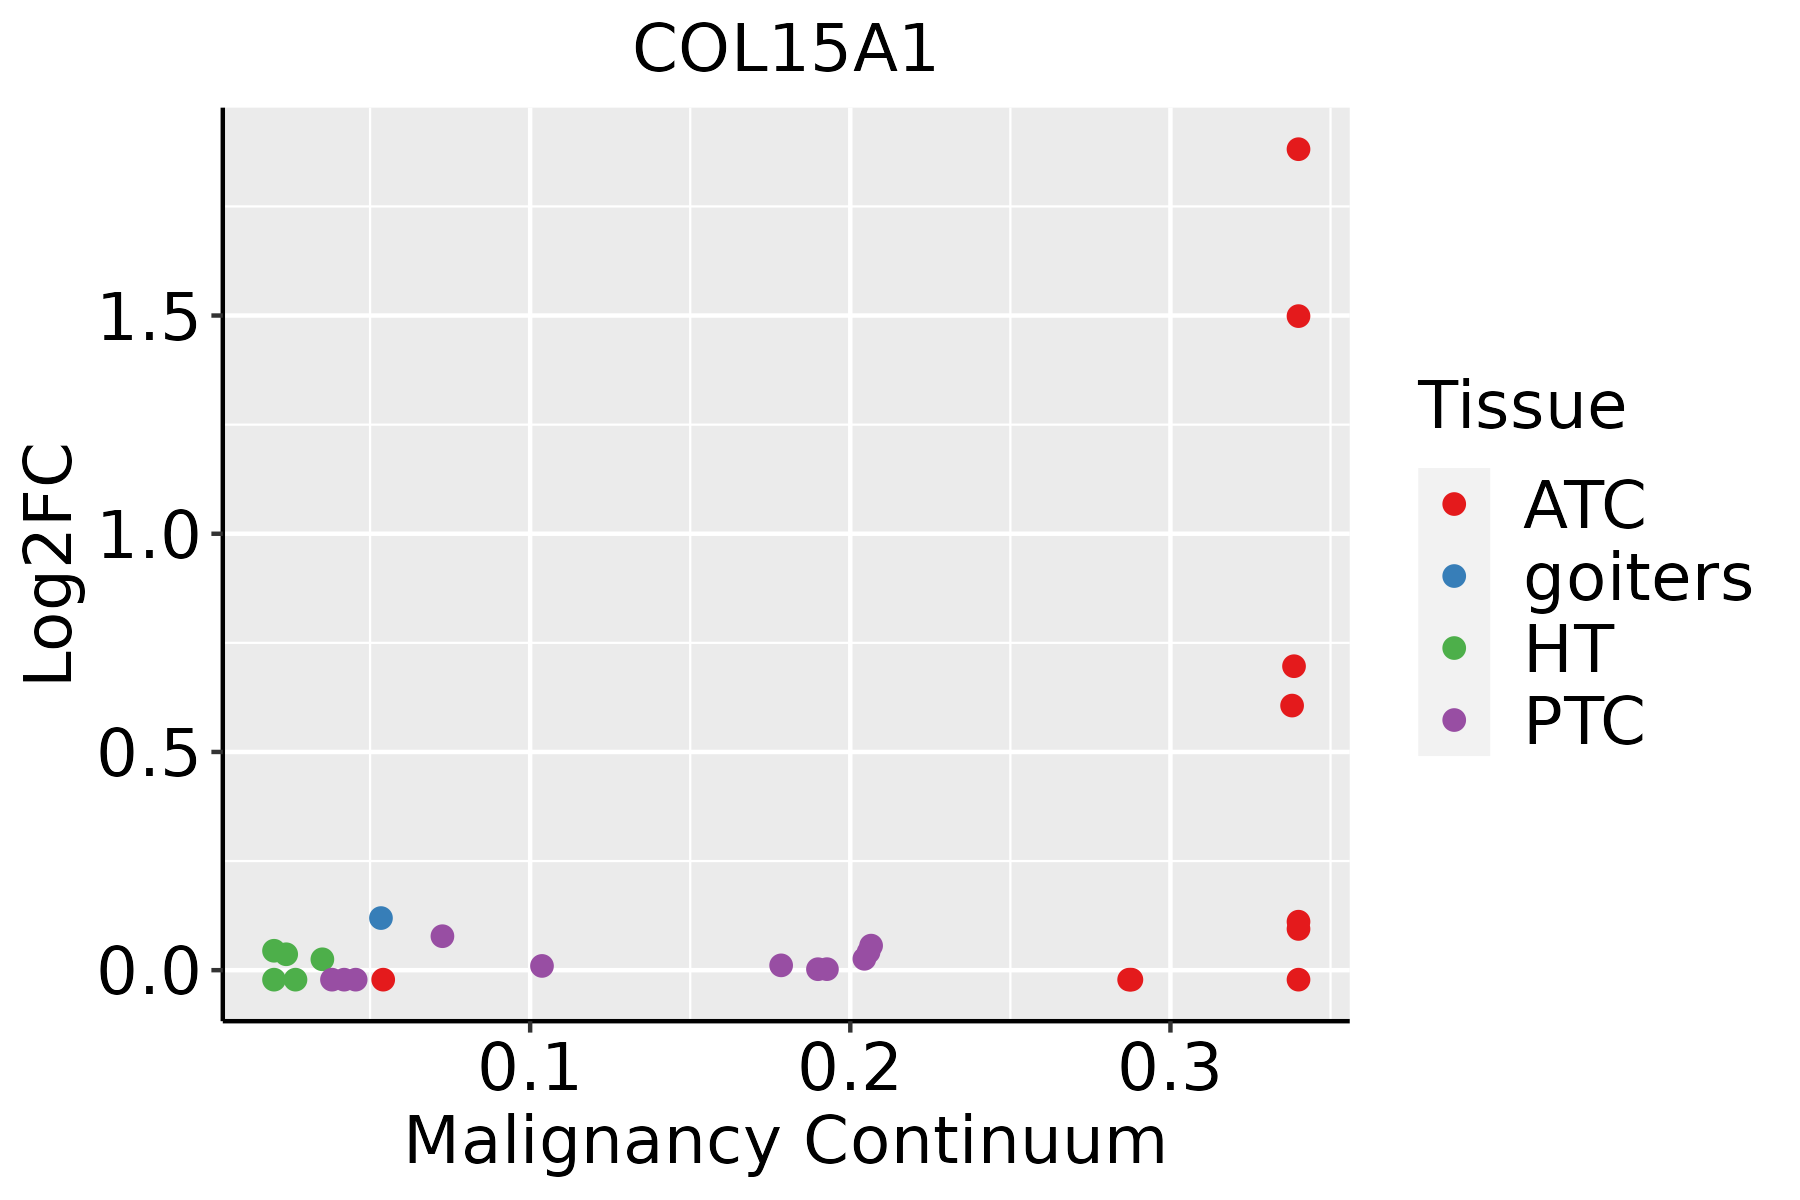 | ATC: Anaplastic thyroid cancer |
| HT: Hashimoto's thyroiditis | ||
| PTC: Papillary thyroid cancer |
| ∗log2FC in expression of this searched gene in stem-like cells from each diseased tissue sample relative to stem-like cells in normal samples in each tissue plotted against the malignancy continuum. Samples are colored based on if they are from different disease stage. |
Top |
Malignant transformation related pathway analysis |
| Find out the enriched GO biological processes and KEGG pathways involved in transition from healthy to precancer to cancer |
| Tissue | Disease Stage | Enriched GO biological Processes |
| Colorectum | AD |  |
| Colorectum | SER |  |
| Colorectum | MSS |  |
| Colorectum | MSI-H |  |
| Colorectum | FAP |  |
| ∗Top 15 enriched GO BP terms are showed in the bar plot of each disease state in each tissue. Each row represents a significant GO biological process which is colored according to the -log10(p.adjust). |
| Page: 1 2 3 4 5 6 7 8 9 |
| GO ID | Tissue | Disease Stage | Description | Gene Ratio | Bg Ratio | pvalue | p.adjust | Count |
| GO:0002064112 | Thyroid | PTC | epithelial cell development | 101/5968 | 220/18723 | 8.53e-06 | 9.74e-05 | 101 |
| GO:000188519 | Thyroid | PTC | endothelial cell development | 37/5968 | 64/18723 | 1.62e-05 | 1.70e-04 | 37 |
| GO:00301986 | Thyroid | PTC | extracellular matrix organization | 124/5968 | 301/18723 | 3.75e-04 | 2.53e-03 | 124 |
| GO:00430626 | Thyroid | PTC | extracellular structure organization | 124/5968 | 302/18723 | 4.38e-04 | 2.92e-03 | 124 |
| GO:0003158111 | Thyroid | PTC | endothelium development | 62/5968 | 136/18723 | 5.45e-04 | 3.48e-03 | 62 |
| GO:004544619 | Thyroid | PTC | endothelial cell differentiation | 55/5968 | 118/18723 | 5.64e-04 | 3.59e-03 | 55 |
| GO:00452296 | Thyroid | PTC | external encapsulating structure organization | 124/5968 | 304/18723 | 5.96e-04 | 3.79e-03 | 124 |
| GO:003019812 | Thyroid | ATC | extracellular matrix organization | 152/6293 | 301/18723 | 8.63e-10 | 2.24e-08 | 152 |
| GO:004306212 | Thyroid | ATC | extracellular structure organization | 152/6293 | 302/18723 | 1.17e-09 | 2.94e-08 | 152 |
| GO:004522912 | Thyroid | ATC | external encapsulating structure organization | 152/6293 | 304/18723 | 2.11e-09 | 5.08e-08 | 152 |
| GO:000206428 | Thyroid | ATC | epithelial cell development | 103/6293 | 220/18723 | 3.06e-05 | 2.55e-04 | 103 |
| GO:000188526 | Thyroid | ATC | endothelial cell development | 36/6293 | 64/18723 | 1.62e-04 | 1.11e-03 | 36 |
| GO:000315825 | Thyroid | ATC | endothelium development | 66/6293 | 136/18723 | 2.16e-04 | 1.42e-03 | 66 |
| GO:004544623 | Thyroid | ATC | endothelial cell differentiation | 56/6293 | 118/18723 | 1.23e-03 | 6.44e-03 | 56 |
| Page: 1 |
| Pathway ID | Tissue | Disease Stage | Description | Gene Ratio | Bg Ratio | pvalue | p.adjust | qvalue | Count |
| Page: 1 |
Top |
Cell-cell communication analysis |
| Identification of potential cell-cell interactions between two cell types and their ligand-receptor pairs for different disease states |
| Ligand | Receptor | LRpair | Pathway | Tissue | Disease Stage |
| Page: 1 |
Top |
Single-cell gene regulatory network inference analysis |
| Find out the significant the regulons (TFs) and the target genes of each regulon across cell types for different disease states |
| TF | Cell Type | Tissue | Disease Stage | Target Gene | RSS | Regulon Activity |
| ∗The dot plots of a searched regulon are shown for all cell subpopulations in each disease state of each tissue based on the regulon specific score inferred using pySCENIC and by calculating the average expression. |
| Page: 1 |
Top |
Somatic mutation of malignant transformation related genes |
| Annotation of somatic variants for genes involved in malignant transformation |
| Hugo Symbol | Variant Class | Variant Classification | dbSNP RS | HGVSc | HGVSp | HGVSp Short | SWISSPROT | BIOTYPE | SIFT | PolyPhen | Tumor Sample Barcode | Tissue | Histology | Sex | Age | Stage | Therapy Types | Drugs | Outcome |
| COL15A1 | SNV | Missense_Mutation | rs199564502 | c.308G>A | p.Arg103His | p.R103H | P39059 | protein_coding | tolerated(0.15) | benign(0.056) | TCGA-CG-5721-01 | Stomach | stomach adenocarcinoma | Male | <65 | III/IV | Unknown | Unknown | SD |
| COL15A1 | SNV | Missense_Mutation | c.3265N>A | p.Phe1089Ile | p.F1089I | P39059 | protein_coding | tolerated(0.21) | benign(0.062) | TCGA-D7-6822-01 | Stomach | stomach adenocarcinoma | Male | >=65 | I/II | Unknown | Unknown | SD | |
| COL15A1 | SNV | Missense_Mutation | c.3710N>A | p.Cys1237Tyr | p.C1237Y | P39059 | protein_coding | deleterious(0) | probably_damaging(1) | TCGA-F1-6874-01 | Stomach | stomach adenocarcinoma | Male | >=65 | I/II | Unknown | Unknown | SD | |
| COL15A1 | SNV | Missense_Mutation | c.3371N>A | p.Gly1124Glu | p.G1124E | P39059 | protein_coding | deleterious(0) | probably_damaging(0.999) | TCGA-HU-A4GU-01 | Stomach | stomach adenocarcinoma | Male | >=65 | I/II | Unknown | Unknown | SD | |
| COL15A1 | SNV | Missense_Mutation | novel | c.656N>G | p.Leu219Arg | p.L219R | P39059 | protein_coding | deleterious(0) | benign(0.226) | TCGA-R5-A7O7-01 | Stomach | stomach adenocarcinoma | Male | <65 | III/IV | Unknown | Unknown | SD |
| COL15A1 | SNV | Missense_Mutation | c.1577N>A | p.Ser526Tyr | p.S526Y | P39059 | protein_coding | tolerated_low_confidence(0.33) | benign(0.011) | TCGA-VQ-A8P2-01 | Stomach | stomach adenocarcinoma | Male | >=65 | III/IV | Unspecific | Complete Response | ||
| COL15A1 | SNV | Missense_Mutation | novel | c.2275C>G | p.Pro759Ala | p.P759A | P39059 | protein_coding | tolerated(0.05) | probably_damaging(0.991) | TCGA-VQ-A8PH-01 | Stomach | stomach adenocarcinoma | Male | <65 | III/IV | Unknown | Unknown | PD |
| COL15A1 | insertion | Frame_Shift_Ins | novel | c.291_292insA | p.Pro99AlafsTer14 | p.P99Afs*14 | P39059 | protein_coding | TCGA-BR-6802-01 | Stomach | stomach adenocarcinoma | Male | >=65 | III/IV | Ancillary | leucovorin | CR | ||
| COL15A1 | deletion | Frame_Shift_Del | novel | c.3294delN | p.Pro1101ArgfsTer52 | p.P1101Rfs*52 | P39059 | protein_coding | TCGA-BR-8372-01 | Stomach | stomach adenocarcinoma | Male | <65 | III/IV | Chemotherapy | etoposide | CR | ||
| COL15A1 | insertion | Nonsense_Mutation | novel | c.3214_3215insGTTGCACAGCTAGGCAGTAGTGCAACCAGGA | p.Val1072GlyfsTer7 | p.V1072Gfs*7 | P39059 | protein_coding | TCGA-CG-4444-01 | Stomach | stomach adenocarcinoma | Male | >=65 | III/IV | Chemotherapy | 5-fluorouracil | CR |
| Page: 1 2 3 4 5 6 7 8 9 10 11 12 13 14 15 16 17 18 19 20 21 |
Top |
Related drugs of malignant transformation related genes |
| Identification of chemicals and drugs interact with genes involved in malignant transfromation |
| (DGIdb 4.0) |
| Entrez ID | Symbol | Category | Interaction Types | Drug Claim Name | Drug Name | PMIDs |
| 1306 | COL15A1 | DRUGGABLE GENOME | CHEMBL2108709 | COLLAGENASE CLOSTRIDIUM HISTOLYTICUM | ||
| 1306 | COL15A1 | DRUGGABLE GENOME | CHEMBL2095222 | OCRIPLASMIN |
| Page: 1 |

Copyright 2023-Present -The University of Texas Health Science Center at Houston |