
|
|||||
|
 | |
| |
| |
| |
| |
| |
|
Gene: ZBTB7B |
Gene summary for ZBTB7B |
| Gene information | Species | Human | Gene symbol | ZBTB7B | Gene ID | 51043 |
| Gene name | zinc finger and BTB domain containing 7B | |
| Gene Alias | CKROX | |
| Cytomap | 1q21.3 | |
| Gene Type | protein-coding | GO ID | GO:0000122 | UniProtAcc | O15156 |
Top |
Malignant transformation analysis |
| Identification of the aberrant gene expression in precancerous and cancerous lesions by comparing the gene expression of stem-like cells in diseased tissues with normal stem cells |
| Entrez ID | Symbol | Replicates | Species | Organ | Tissue | Adj P-value | Log2FC | Malignancy |
| 51043 | ZBTB7B | HTA11_7663_2000001011 | Human | Colorectum | SER | 6.48e-06 | 6.39e-01 | 0.0131 |
| 51043 | ZBTB7B | HTA11_10623_2000001011 | Human | Colorectum | AD | 1.59e-06 | 6.76e-01 | -0.0177 |
| 51043 | ZBTB7B | HTA11_10711_2000001011 | Human | Colorectum | AD | 6.85e-16 | 7.16e-01 | 0.0338 |
| 51043 | ZBTB7B | HTA11_7696_3000711011 | Human | Colorectum | AD | 1.19e-02 | 2.42e-01 | 0.0674 |
| 51043 | ZBTB7B | HTA11_6818_2000001011 | Human | Colorectum | AD | 9.00e-27 | 1.61e+00 | 0.0112 |
| 51043 | ZBTB7B | HTA11_6818_2000001021 | Human | Colorectum | AD | 7.53e-18 | 1.02e+00 | 0.0588 |
| 51043 | ZBTB7B | HTA11_99999974143_84620 | Human | Colorectum | MSS | 1.45e-57 | 1.40e+00 | 0.3005 |
| 51043 | ZBTB7B | LZE7T | Human | Esophagus | ESCC | 2.17e-11 | 1.79e-01 | 0.0667 |
| 51043 | ZBTB7B | LZE20T | Human | Esophagus | ESCC | 4.95e-09 | 6.50e-02 | 0.0662 |
| 51043 | ZBTB7B | LZE24T | Human | Esophagus | ESCC | 4.44e-07 | 2.46e-01 | 0.0596 |
| 51043 | ZBTB7B | P1T-E | Human | Esophagus | ESCC | 8.18e-04 | 4.04e-01 | 0.0875 |
| 51043 | ZBTB7B | P2T-E | Human | Esophagus | ESCC | 3.30e-12 | 2.77e-02 | 0.1177 |
| 51043 | ZBTB7B | P4T-E | Human | Esophagus | ESCC | 7.44e-10 | 5.52e-02 | 0.1323 |
| 51043 | ZBTB7B | P5T-E | Human | Esophagus | ESCC | 1.92e-17 | 1.58e-01 | 0.1327 |
| 51043 | ZBTB7B | P8T-E | Human | Esophagus | ESCC | 2.68e-10 | 6.64e-02 | 0.0889 |
| 51043 | ZBTB7B | P9T-E | Human | Esophagus | ESCC | 1.65e-09 | 2.76e-02 | 0.1131 |
| 51043 | ZBTB7B | P10T-E | Human | Esophagus | ESCC | 9.30e-11 | -6.31e-03 | 0.116 |
| 51043 | ZBTB7B | P11T-E | Human | Esophagus | ESCC | 2.17e-03 | 8.62e-02 | 0.1426 |
| 51043 | ZBTB7B | P12T-E | Human | Esophagus | ESCC | 7.17e-09 | 1.32e-01 | 0.1122 |
| 51043 | ZBTB7B | P15T-E | Human | Esophagus | ESCC | 8.10e-13 | 2.35e-01 | 0.1149 |
| Page: 1 2 3 4 5 |
| Tissue | Expression Dynamics | Abbreviation |
| Colorectum (GSE201348) | 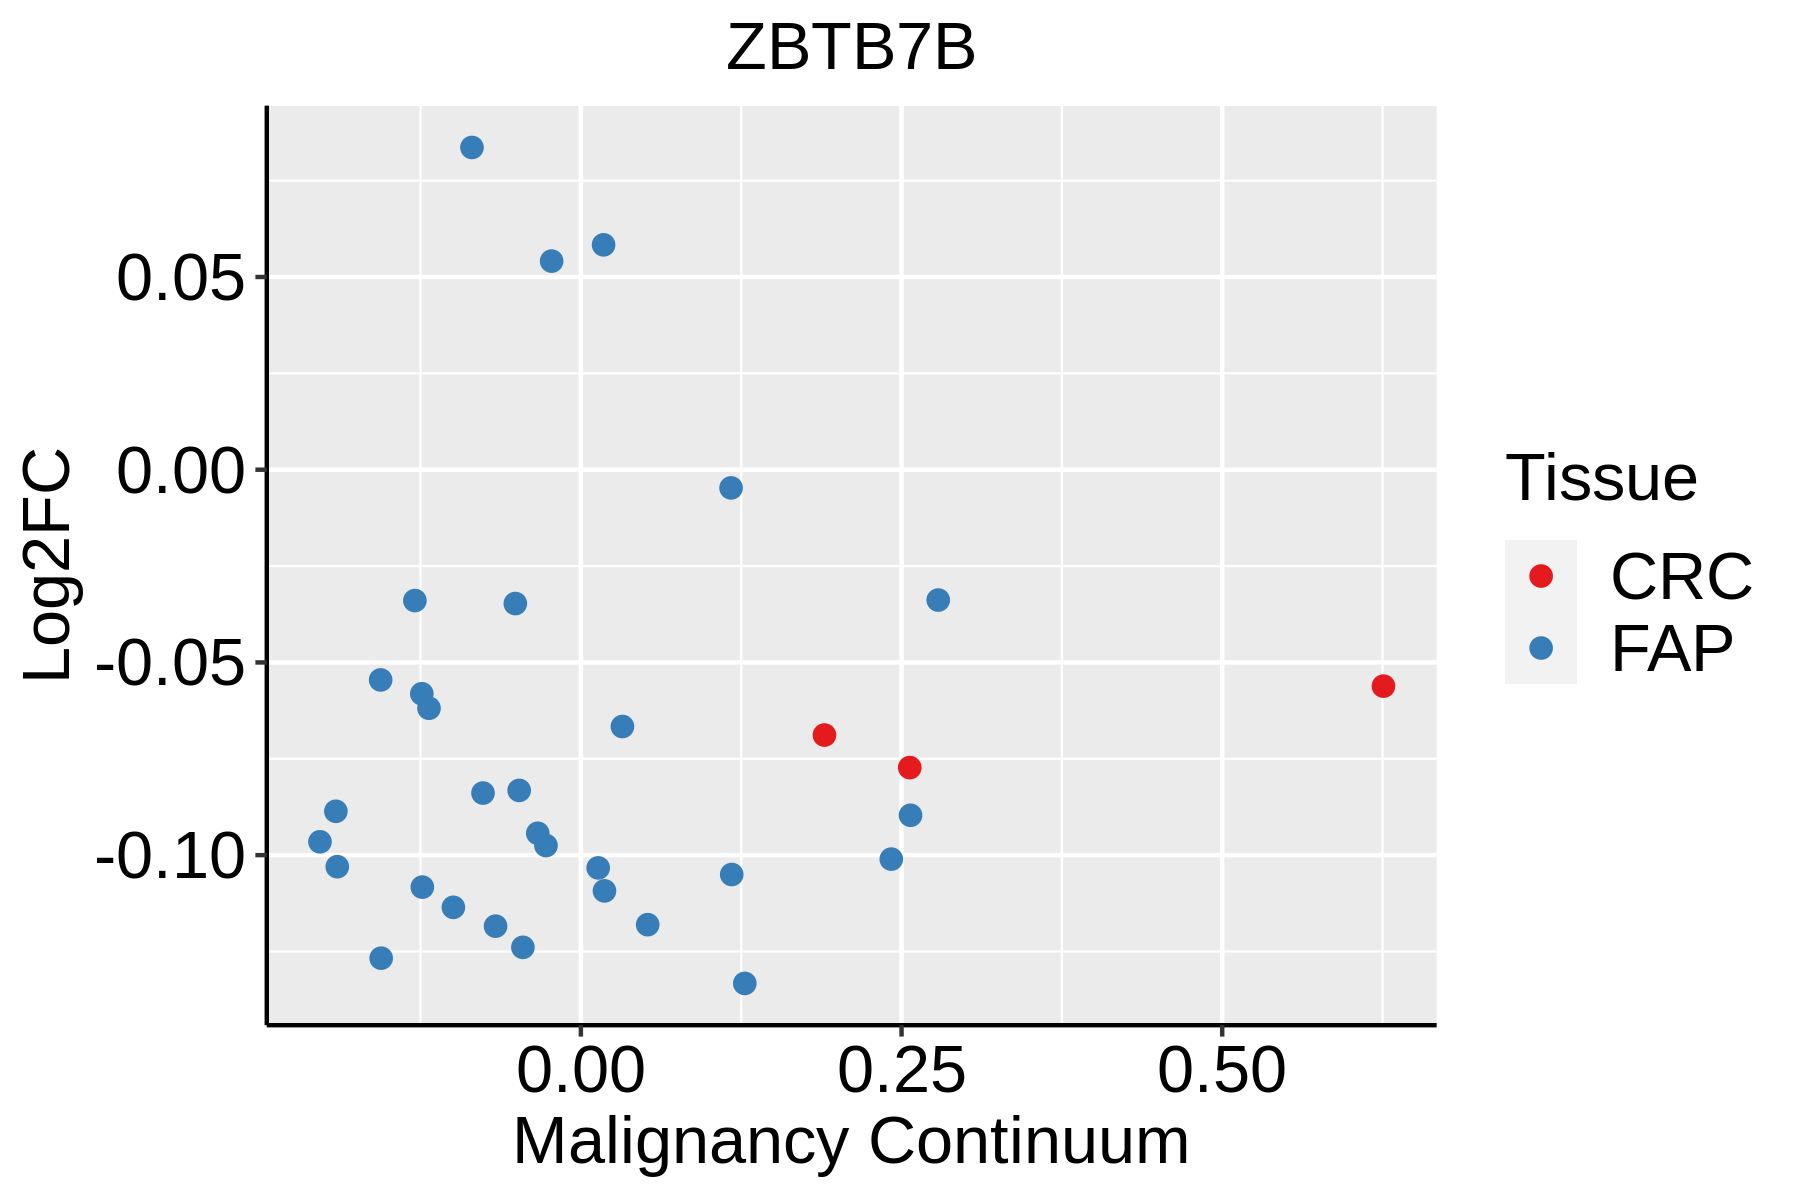 | FAP: Familial adenomatous polyposis |
| CRC: Colorectal cancer | ||
| Colorectum (HTA11) | 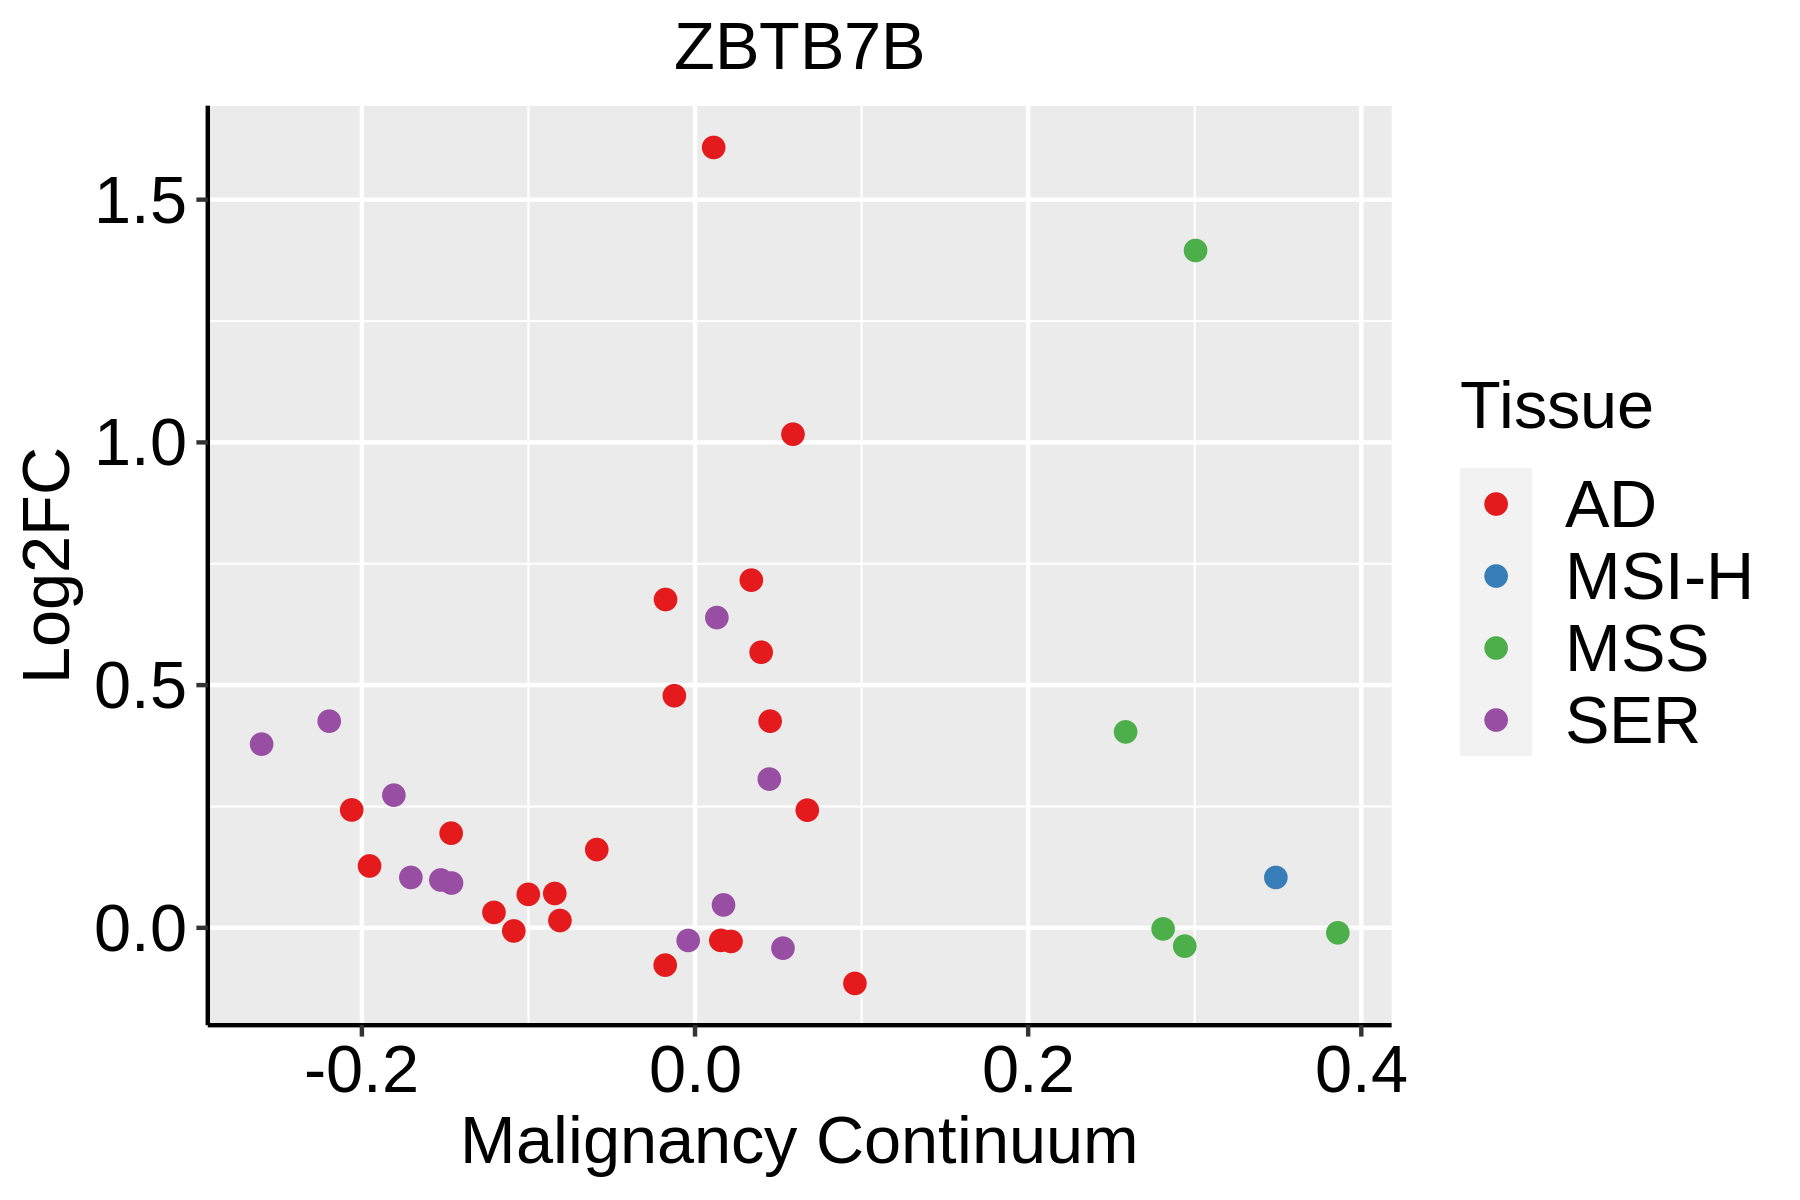 | AD: Adenomas |
| SER: Sessile serrated lesions | ||
| MSI-H: Microsatellite-high colorectal cancer | ||
| MSS: Microsatellite stable colorectal cancer | ||
| Esophagus |  | ESCC: Esophageal squamous cell carcinoma |
| HGIN: High-grade intraepithelial neoplasias | ||
| LGIN: Low-grade intraepithelial neoplasias | ||
| GC | 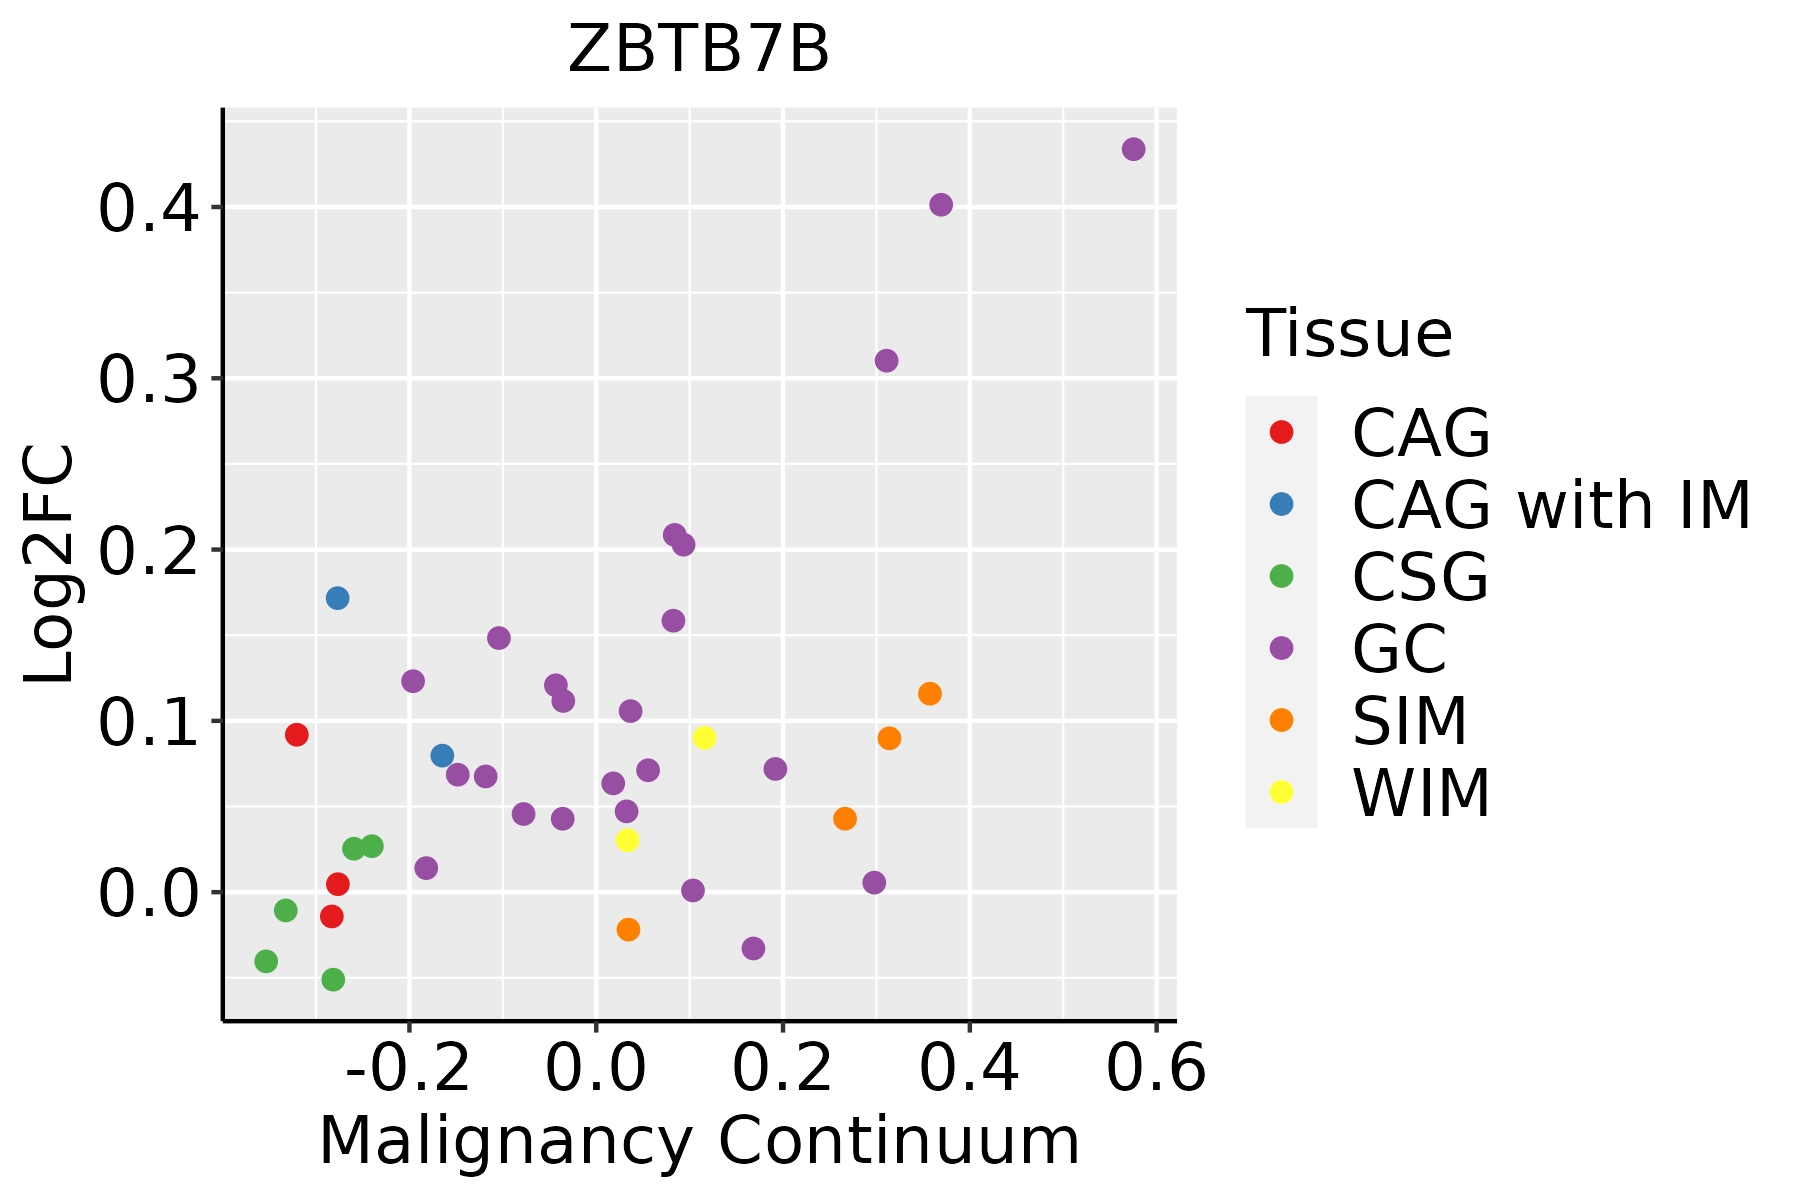 | CAG: Chronic atrophic gastritis |
| CAG with IM: Chronic atrophic gastritis with intestinal metaplasia | ||
| CSG: Chronic superficial gastritis | ||
| GC: Gastric cancer | ||
| SIM: Severe intestinal metaplasia | ||
| WIM: Wild intestinal metaplasia | ||
| Liver | 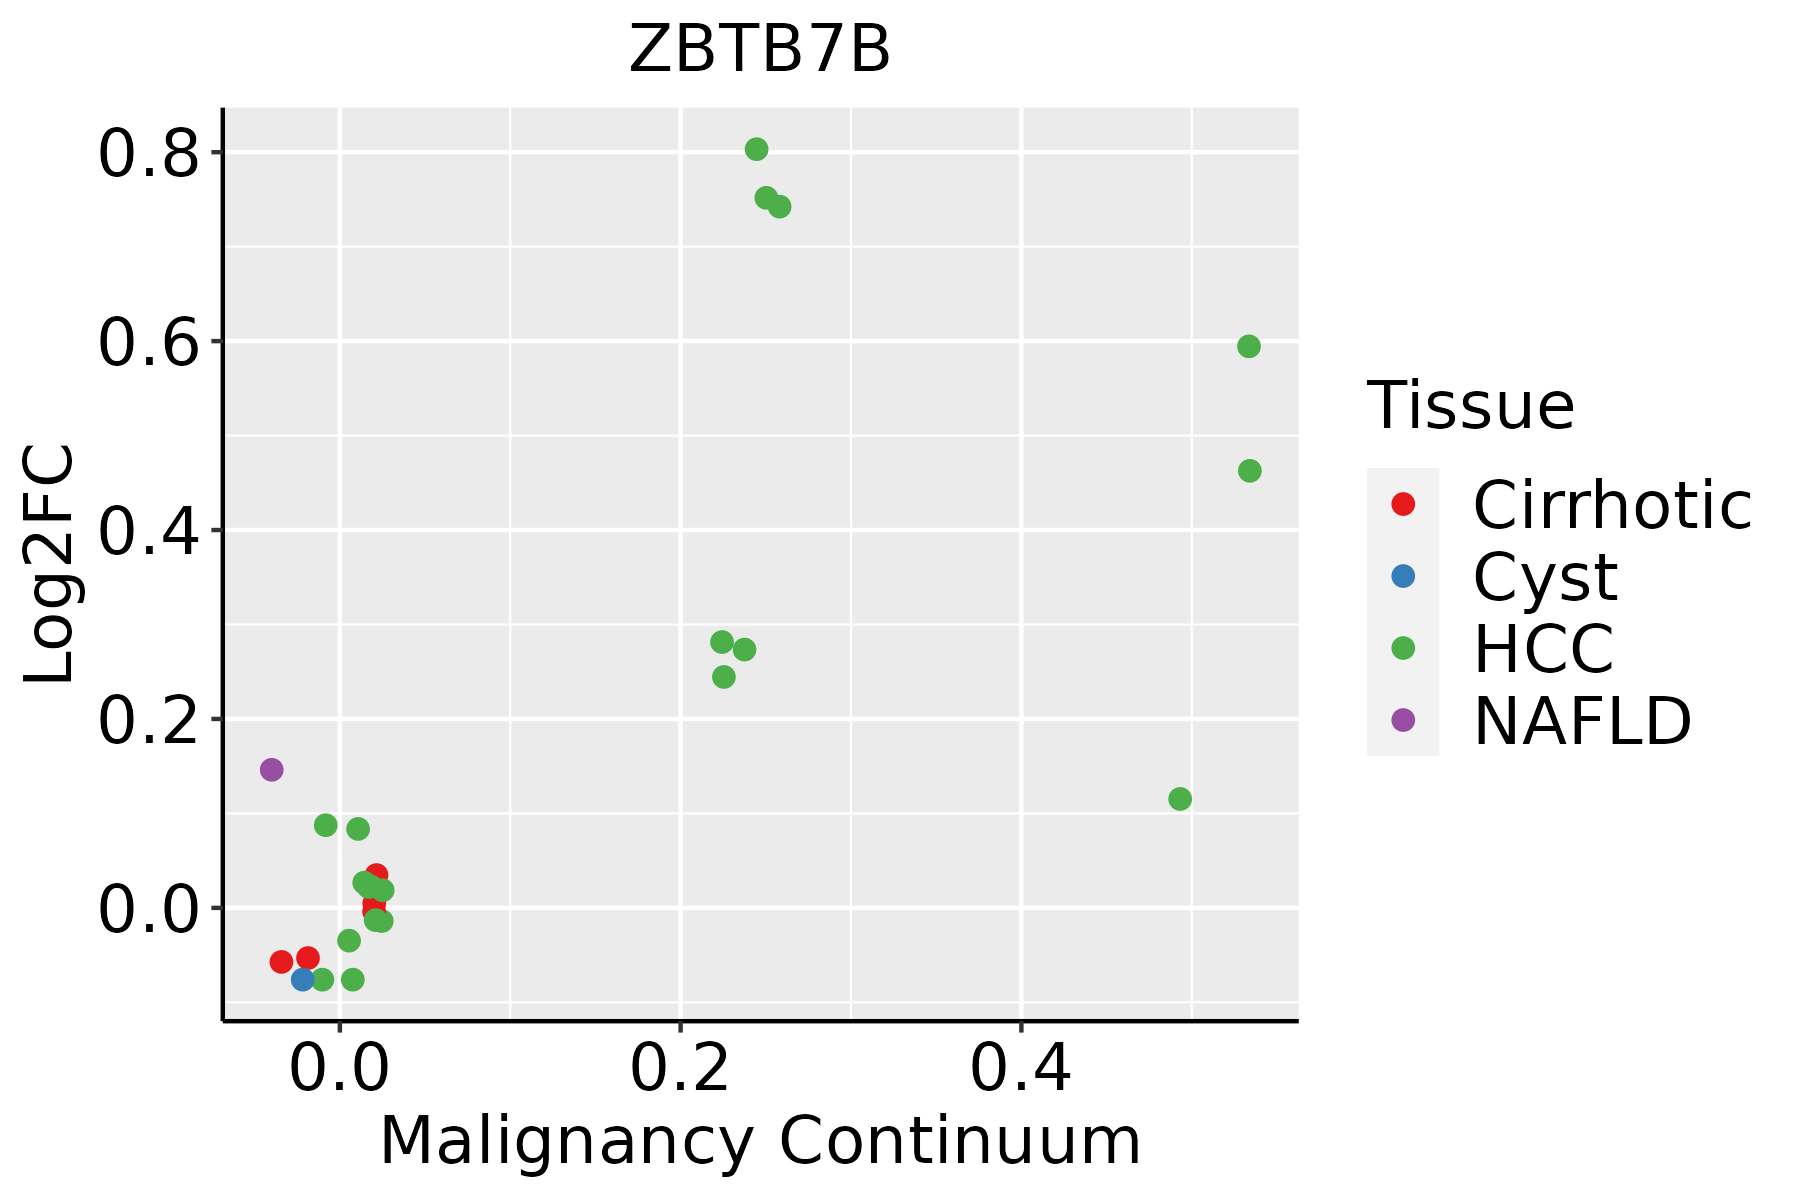 | HCC: Hepatocellular carcinoma |
| NAFLD: Non-alcoholic fatty liver disease | ||
| Oral Cavity |  | EOLP: Erosive Oral lichen planus |
| LP: leukoplakia | ||
| NEOLP: Non-erosive oral lichen planus | ||
| OSCC: Oral squamous cell carcinoma | ||
| Skin |  | AK: Actinic keratosis |
| cSCC: Cutaneous squamous cell carcinoma | ||
| SCCIS:squamous cell carcinoma in situ |
| ∗log2FC in expression of this searched gene in stem-like cells from each diseased tissue sample relative to stem-like cells in normal samples in each tissue plotted against the malignancy continuum. Samples are colored based on if they are from different disease stage. |
Top |
Malignant transformation related pathway analysis |
| Find out the enriched GO biological processes and KEGG pathways involved in transition from healthy to precancer to cancer |
| Tissue | Disease Stage | Enriched GO biological Processes |
| Colorectum | AD |  |
| Colorectum | SER |  |
| Colorectum | MSS |  |
| Colorectum | MSI-H |  |
| Colorectum | FAP |  |
| ∗Top 15 enriched GO BP terms are showed in the bar plot of each disease state in each tissue. Each row represents a significant GO biological process which is colored according to the -log10(p.adjust). |
| Page: 1 2 3 4 5 6 7 8 9 |
| GO ID | Tissue | Disease Stage | Description | Gene Ratio | Bg Ratio | pvalue | p.adjust | Count |
| GO:0048732 | Colorectum | AD | gland development | 149/3918 | 436/18723 | 6.07e-11 | 6.33e-09 | 149 |
| GO:0032868 | Colorectum | AD | response to insulin | 91/3918 | 264/18723 | 2.02e-07 | 8.48e-06 | 91 |
| GO:1901653 | Colorectum | AD | cellular response to peptide | 114/3918 | 359/18723 | 8.32e-07 | 2.88e-05 | 114 |
| GO:0032869 | Colorectum | AD | cellular response to insulin stimulus | 72/3918 | 203/18723 | 1.10e-06 | 3.68e-05 | 72 |
| GO:0030879 | Colorectum | AD | mammary gland development | 53/3918 | 137/18723 | 1.46e-06 | 4.58e-05 | 53 |
| GO:0071375 | Colorectum | AD | cellular response to peptide hormone stimulus | 95/3918 | 290/18723 | 1.50e-06 | 4.66e-05 | 95 |
| GO:0043434 | Colorectum | AD | response to peptide hormone | 126/3918 | 414/18723 | 2.70e-06 | 7.86e-05 | 126 |
| GO:0006984 | Colorectum | AD | ER-nucleus signaling pathway | 21/3918 | 46/18723 | 1.47e-04 | 2.08e-03 | 21 |
| GO:0050878 | Colorectum | AD | regulation of body fluid levels | 108/3918 | 379/18723 | 2.54e-04 | 3.20e-03 | 108 |
| GO:0045785 | Colorectum | AD | positive regulation of cell adhesion | 122/3918 | 437/18723 | 2.65e-04 | 3.28e-03 | 122 |
| GO:0007589 | Colorectum | AD | body fluid secretion | 33/3918 | 93/18723 | 8.26e-04 | 8.13e-03 | 33 |
| GO:0032933 | Colorectum | AD | SREBP signaling pathway | 9/3918 | 15/18723 | 1.11e-03 | 1.01e-02 | 9 |
| GO:0071501 | Colorectum | AD | cellular response to sterol depletion | 9/3918 | 16/18723 | 2.06e-03 | 1.64e-02 | 9 |
| GO:1903706 | Colorectum | AD | regulation of hemopoiesis | 99/3918 | 367/18723 | 3.08e-03 | 2.28e-02 | 99 |
| GO:0120162 | Colorectum | AD | positive regulation of cold-induced thermogenesis | 32/3918 | 97/18723 | 3.74e-03 | 2.63e-02 | 32 |
| GO:0007595 | Colorectum | AD | lactation | 18/3918 | 47/18723 | 4.81e-03 | 3.25e-02 | 18 |
| GO:0006991 | Colorectum | AD | response to sterol depletion | 9/3918 | 18/18723 | 5.82e-03 | 3.67e-02 | 9 |
| GO:0031056 | Colorectum | AD | regulation of histone modification | 45/3918 | 152/18723 | 7.05e-03 | 4.31e-02 | 45 |
| GO:0106106 | Colorectum | AD | cold-induced thermogenesis | 43/3918 | 144/18723 | 7.05e-03 | 4.31e-02 | 43 |
| GO:0120161 | Colorectum | AD | regulation of cold-induced thermogenesis | 43/3918 | 144/18723 | 7.05e-03 | 4.31e-02 | 43 |
| Page: 1 2 3 4 5 6 7 8 9 10 11 12 13 14 15 16 |
| Pathway ID | Tissue | Disease Stage | Description | Gene Ratio | Bg Ratio | pvalue | p.adjust | qvalue | Count |
| Page: 1 |
Top |
Cell-cell communication analysis |
| Identification of potential cell-cell interactions between two cell types and their ligand-receptor pairs for different disease states |
| Ligand | Receptor | LRpair | Pathway | Tissue | Disease Stage |
| Page: 1 |
Top |
Single-cell gene regulatory network inference analysis |
| Find out the significant the regulons (TFs) and the target genes of each regulon across cell types for different disease states |
| TF | Cell Type | Tissue | Disease Stage | Target Gene | RSS | Regulon Activity |
| ZBTB7B | MLUM | Breast | IDC | ENC1,FASN,SIM2, etc. | 5.52e-01 |  |
| ZBTB7B | TREG | Cervix | CC | CORO1B,ZNF700,CD40LG, etc. | 1.29e-01 |  |
| ZBTB7B | CD4TN | Cervix | Healthy | CORO1B,ZNF700,CD40LG, etc. | 1.55e-01 |  |
| ZBTB7B | CD8TEXP | Cervix | Healthy | CORO1B,ZNF700,CD40LG, etc. | 1.10e-01 | |
| ZBTB7B | TREG | Cervix | Healthy | CORO1B,ZNF700,CD40LG, etc. | 1.03e-01 | |
| ZBTB7B | TFH | Cervix | Healthy | CORO1B,ZNF700,CD40LG, etc. | 1.24e-01 | |
| ZBTB7B | TREG | Cervix | HSIL_HPV | CORO1B,ZNF700,CD40LG, etc. | 1.07e-01 |  |
| ZBTB7B | TFH | Cervix | HSIL_HPV | CORO1B,ZNF700,CD40LG, etc. | 1.36e-01 | |
| ZBTB7B | CD4TN | Cervix | N_HPV | CORO1B,ZNF700,CD40LG, etc. | 2.56e-01 |  |
| ZBTB7B | TREG | Cervix | N_HPV | CORO1B,ZNF700,CD40LG, etc. | 8.11e-02 | |
| ∗The dot plots of a searched regulon are shown for all cell subpopulations in each disease state of each tissue based on the regulon specific score inferred using pySCENIC and by calculating the average expression. |
| Page: 1 2 3 |
Top |
Somatic mutation of malignant transformation related genes |
| Annotation of somatic variants for genes involved in malignant transformation |
| Hugo Symbol | Variant Class | Variant Classification | dbSNP RS | HGVSc | HGVSp | HGVSp Short | SWISSPROT | BIOTYPE | SIFT | PolyPhen | Tumor Sample Barcode | Tissue | Histology | Sex | Age | Stage | Therapy Types | Drugs | Outcome |
| ZBTB7B | SNV | Missense_Mutation | c.580C>T | p.Arg194Cys | p.R194C | O15156 | protein_coding | deleterious(0) | probably_damaging(0.93) | TCGA-CM-4743-01 | Colorectum | colon adenocarcinoma | Male | >=65 | I/II | Chemotherapy | capecitabine | SD | |
| ZBTB7B | SNV | Missense_Mutation | c.925G>A | p.Gly309Ser | p.G309S | O15156 | protein_coding | tolerated(0.13) | benign(0.235) | TCGA-G4-6322-01 | Colorectum | colon adenocarcinoma | Male | >=65 | III/IV | Chemotherapy | oxaliplatin | PD | |
| ZBTB7B | SNV | Missense_Mutation | novel | c.1507N>A | p.Pro503Thr | p.P503T | O15156 | protein_coding | tolerated_low_confidence(0.14) | possibly_damaging(0.79) | TCGA-AG-A00Y-01 | Colorectum | rectum adenocarcinoma | Male | >=65 | I/II | Unknown | Unknown | PD |
| ZBTB7B | deletion | In_Frame_Del | c.1261_1263delGAC | p.Asp421del | p.D421del | O15156 | protein_coding | TCGA-F4-6856-01 | Colorectum | colon adenocarcinoma | Male | <65 | I/II | Ancillary | leucovorin | CR | |||
| ZBTB7B | SNV | Missense_Mutation | novel | c.868N>A | p.Pro290Thr | p.P290T | O15156 | protein_coding | tolerated(0.27) | benign(0.013) | TCGA-A5-A0G1-01 | Endometrium | uterine corpus endometrioid carcinoma | Female | >=65 | I/II | Unknown | Unknown | SD |
| ZBTB7B | SNV | Missense_Mutation | novel | c.1078N>A | p.Leu360Met | p.L360M | O15156 | protein_coding | tolerated(0.08) | probably_damaging(0.968) | TCGA-A5-A0G2-01 | Endometrium | uterine corpus endometrioid carcinoma | Female | <65 | III/IV | Unknown | Unknown | SD |
| ZBTB7B | SNV | Missense_Mutation | novel | c.1199G>T | p.Arg400Met | p.R400M | O15156 | protein_coding | deleterious(0) | probably_damaging(0.999) | TCGA-A5-A1OF-01 | Endometrium | uterine corpus endometrioid carcinoma | Female | <65 | I/II | Unknown | Unknown | SD |
| ZBTB7B | SNV | Missense_Mutation | novel | c.1094A>G | p.Asp365Gly | p.D365G | O15156 | protein_coding | tolerated(0.14) | possibly_damaging(0.897) | TCGA-AJ-A23O-01 | Endometrium | uterine corpus endometrioid carcinoma | Female | >=65 | I/II | Unknown | Unknown | SD |
| ZBTB7B | SNV | Missense_Mutation | c.185N>A | p.Arg62His | p.R62H | O15156 | protein_coding | deleterious(0) | probably_damaging(0.998) | TCGA-AX-A06H-01 | Endometrium | uterine corpus endometrioid carcinoma | Female | <65 | III/IV | Chemotherapy | paclitaxel | SD | |
| ZBTB7B | SNV | Missense_Mutation | c.1190G>A | p.Arg397His | p.R397H | O15156 | protein_coding | deleterious(0) | probably_damaging(0.996) | TCGA-AX-A2HA-01 | Endometrium | uterine corpus endometrioid carcinoma | Female | <65 | I/II | Unknown | Unknown | SD |
| Page: 1 2 3 4 5 6 7 8 |
Top |
Related drugs of malignant transformation related genes |
| Identification of chemicals and drugs interact with genes involved in malignant transfromation |
| (DGIdb 4.0) |
| Entrez ID | Symbol | Category | Interaction Types | Drug Claim Name | Drug Name | PMIDs |
| Page: 1 |

Copyright 2023-Present -The University of Texas Health Science Center at Houston |