
|
|||||
|
 | |
| |
| |
| |
| |
| |
|
Gene: ZBTB16 |
Gene summary for ZBTB16 |
| Gene information | Species | Human | Gene symbol | ZBTB16 | Gene ID | 7704 |
| Gene name | zinc finger and BTB domain containing 16 | |
| Gene Alias | PLZF | |
| Cytomap | 11q23.2 | |
| Gene Type | protein-coding | GO ID | GO:0000003 | UniProtAcc | A0A024R3C6 |
Top |
Malignant transformation analysis |
| Identification of the aberrant gene expression in precancerous and cancerous lesions by comparing the gene expression of stem-like cells in diseased tissues with normal stem cells |
| Entrez ID | Symbol | Replicates | Species | Organ | Tissue | Adj P-value | Log2FC | Malignancy |
| 7704 | ZBTB16 | HTA11_3410_2000001011 | Human | Colorectum | AD | 3.35e-25 | -7.67e-01 | 0.0155 |
| 7704 | ZBTB16 | HTA11_2487_2000001011 | Human | Colorectum | SER | 4.46e-09 | -6.94e-01 | -0.1808 |
| 7704 | ZBTB16 | HTA11_1938_2000001011 | Human | Colorectum | AD | 2.71e-09 | -7.46e-01 | -0.0811 |
| 7704 | ZBTB16 | HTA11_78_2000001011 | Human | Colorectum | AD | 5.50e-13 | -7.22e-01 | -0.1088 |
| 7704 | ZBTB16 | HTA11_347_2000001011 | Human | Colorectum | AD | 6.24e-19 | -7.12e-01 | -0.1954 |
| 7704 | ZBTB16 | HTA11_3361_2000001011 | Human | Colorectum | AD | 9.33e-10 | -7.47e-01 | -0.1207 |
| 7704 | ZBTB16 | HTA11_83_2000001011 | Human | Colorectum | SER | 1.58e-10 | -7.72e-01 | -0.1526 |
| 7704 | ZBTB16 | HTA11_696_2000001011 | Human | Colorectum | AD | 3.42e-25 | -7.08e-01 | -0.1464 |
| 7704 | ZBTB16 | HTA11_866_2000001011 | Human | Colorectum | AD | 4.22e-19 | -6.92e-01 | -0.1001 |
| 7704 | ZBTB16 | HTA11_1391_2000001011 | Human | Colorectum | AD | 2.36e-14 | -7.09e-01 | -0.059 |
| 7704 | ZBTB16 | HTA11_5212_2000001011 | Human | Colorectum | AD | 1.65e-03 | -7.47e-01 | -0.2061 |
| 7704 | ZBTB16 | HTA11_546_2000001011 | Human | Colorectum | AD | 6.40e-06 | -7.37e-01 | -0.0842 |
| 7704 | ZBTB16 | HTA11_7862_2000001011 | Human | Colorectum | AD | 2.65e-07 | -7.72e-01 | -0.0179 |
| 7704 | ZBTB16 | HTA11_866_3004761011 | Human | Colorectum | AD | 6.36e-20 | -7.53e-01 | 0.096 |
| 7704 | ZBTB16 | HTA11_4255_2000001011 | Human | Colorectum | SER | 1.69e-03 | -7.72e-01 | 0.0446 |
| 7704 | ZBTB16 | HTA11_8622_2000001021 | Human | Colorectum | SER | 6.49e-04 | -7.48e-01 | 0.0528 |
| 7704 | ZBTB16 | HTA11_10623_2000001011 | Human | Colorectum | AD | 6.88e-04 | -7.28e-01 | -0.0177 |
| 7704 | ZBTB16 | HTA11_6801_2000001011 | Human | Colorectum | SER | 4.90e-03 | -7.72e-01 | 0.0171 |
| 7704 | ZBTB16 | HTA11_10711_2000001011 | Human | Colorectum | AD | 5.25e-12 | -7.51e-01 | 0.0338 |
| 7704 | ZBTB16 | HTA11_7696_3000711011 | Human | Colorectum | AD | 5.65e-31 | -7.64e-01 | 0.0674 |
| Page: 1 2 3 4 5 6 |
| Tissue | Expression Dynamics | Abbreviation |
| Colorectum (GSE201348) |  | FAP: Familial adenomatous polyposis |
| CRC: Colorectal cancer | ||
| Colorectum (HTA11) |  | AD: Adenomas |
| SER: Sessile serrated lesions | ||
| MSI-H: Microsatellite-high colorectal cancer | ||
| MSS: Microsatellite stable colorectal cancer | ||
| Liver | 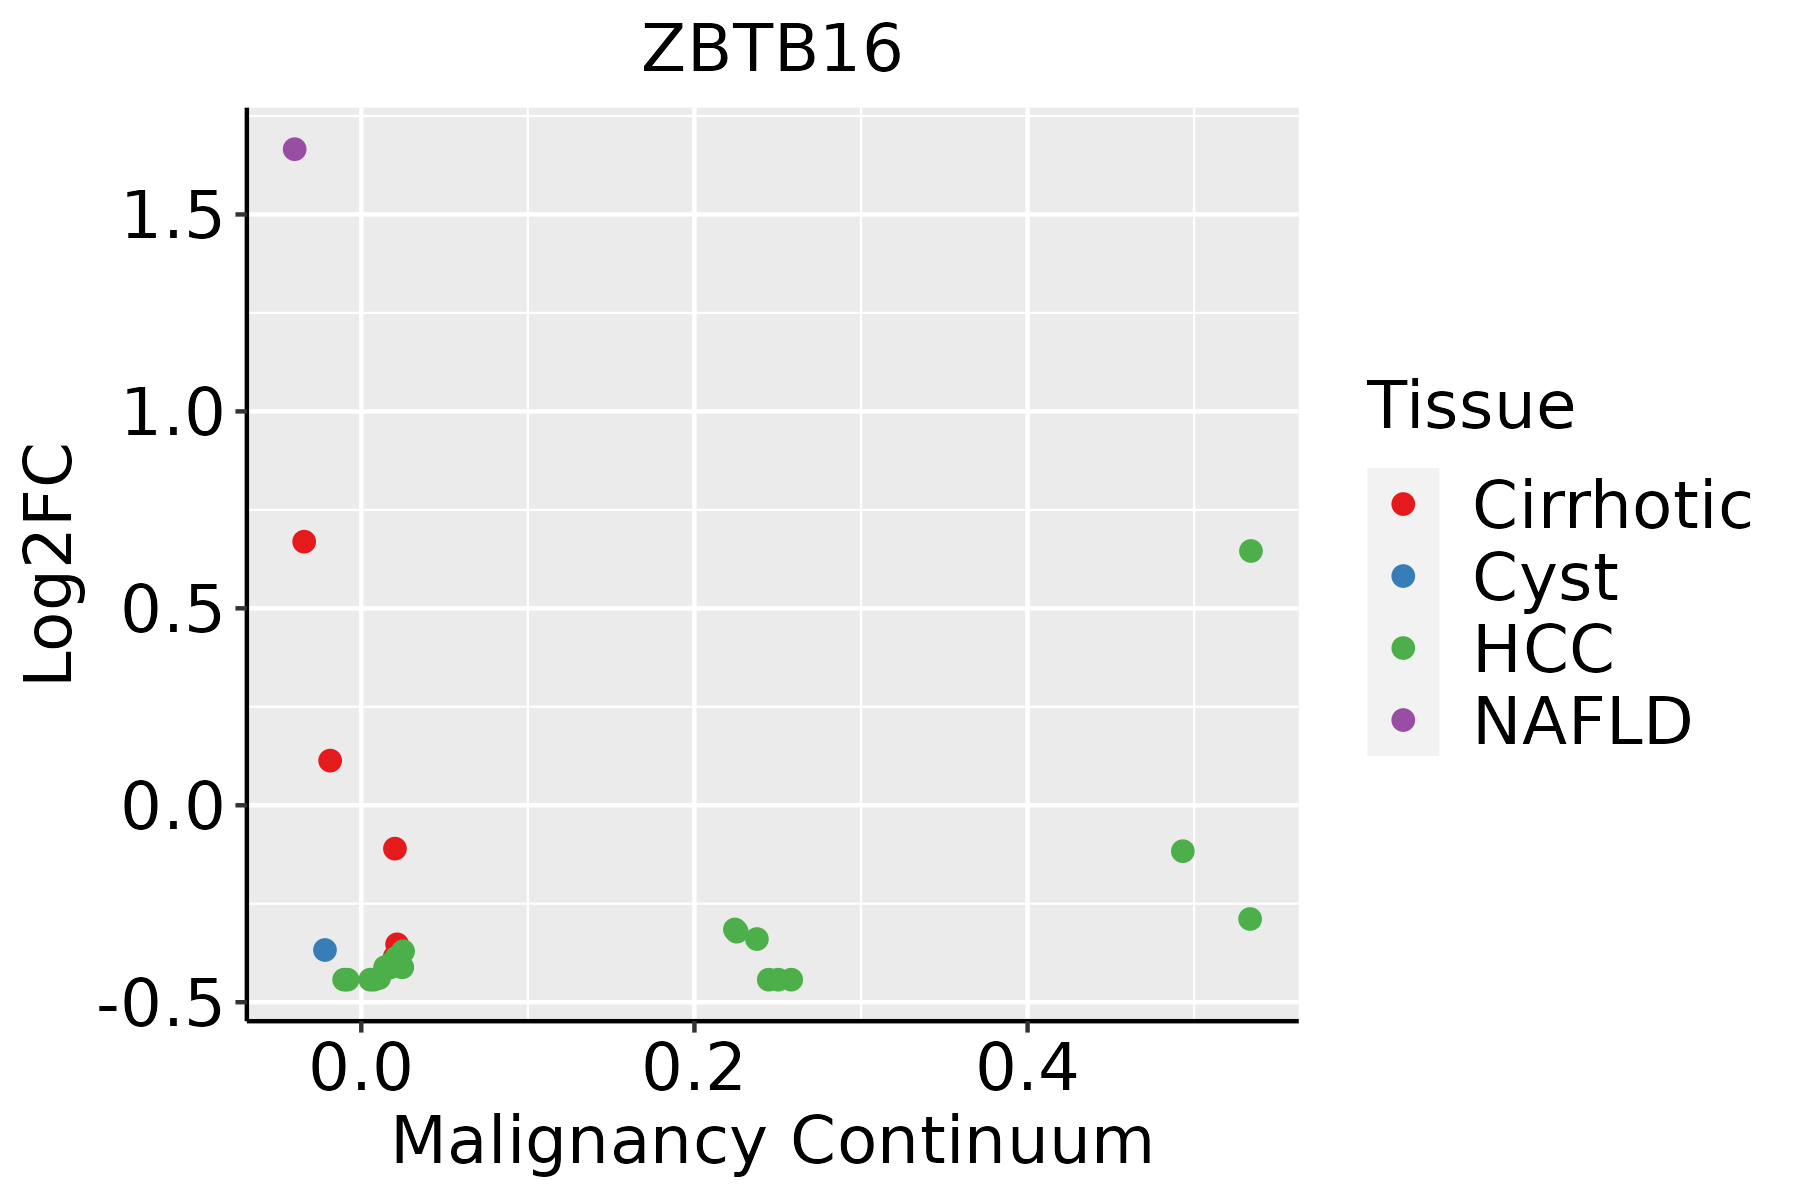 | HCC: Hepatocellular carcinoma |
| NAFLD: Non-alcoholic fatty liver disease | ||
| Lung |  | AAH: Atypical adenomatous hyperplasia |
| AIS: Adenocarcinoma in situ | ||
| IAC: Invasive lung adenocarcinoma | ||
| MIA: Minimally invasive adenocarcinoma | ||
| Prostate |  | BPH: Benign Prostatic Hyperplasia |
| Thyroid | 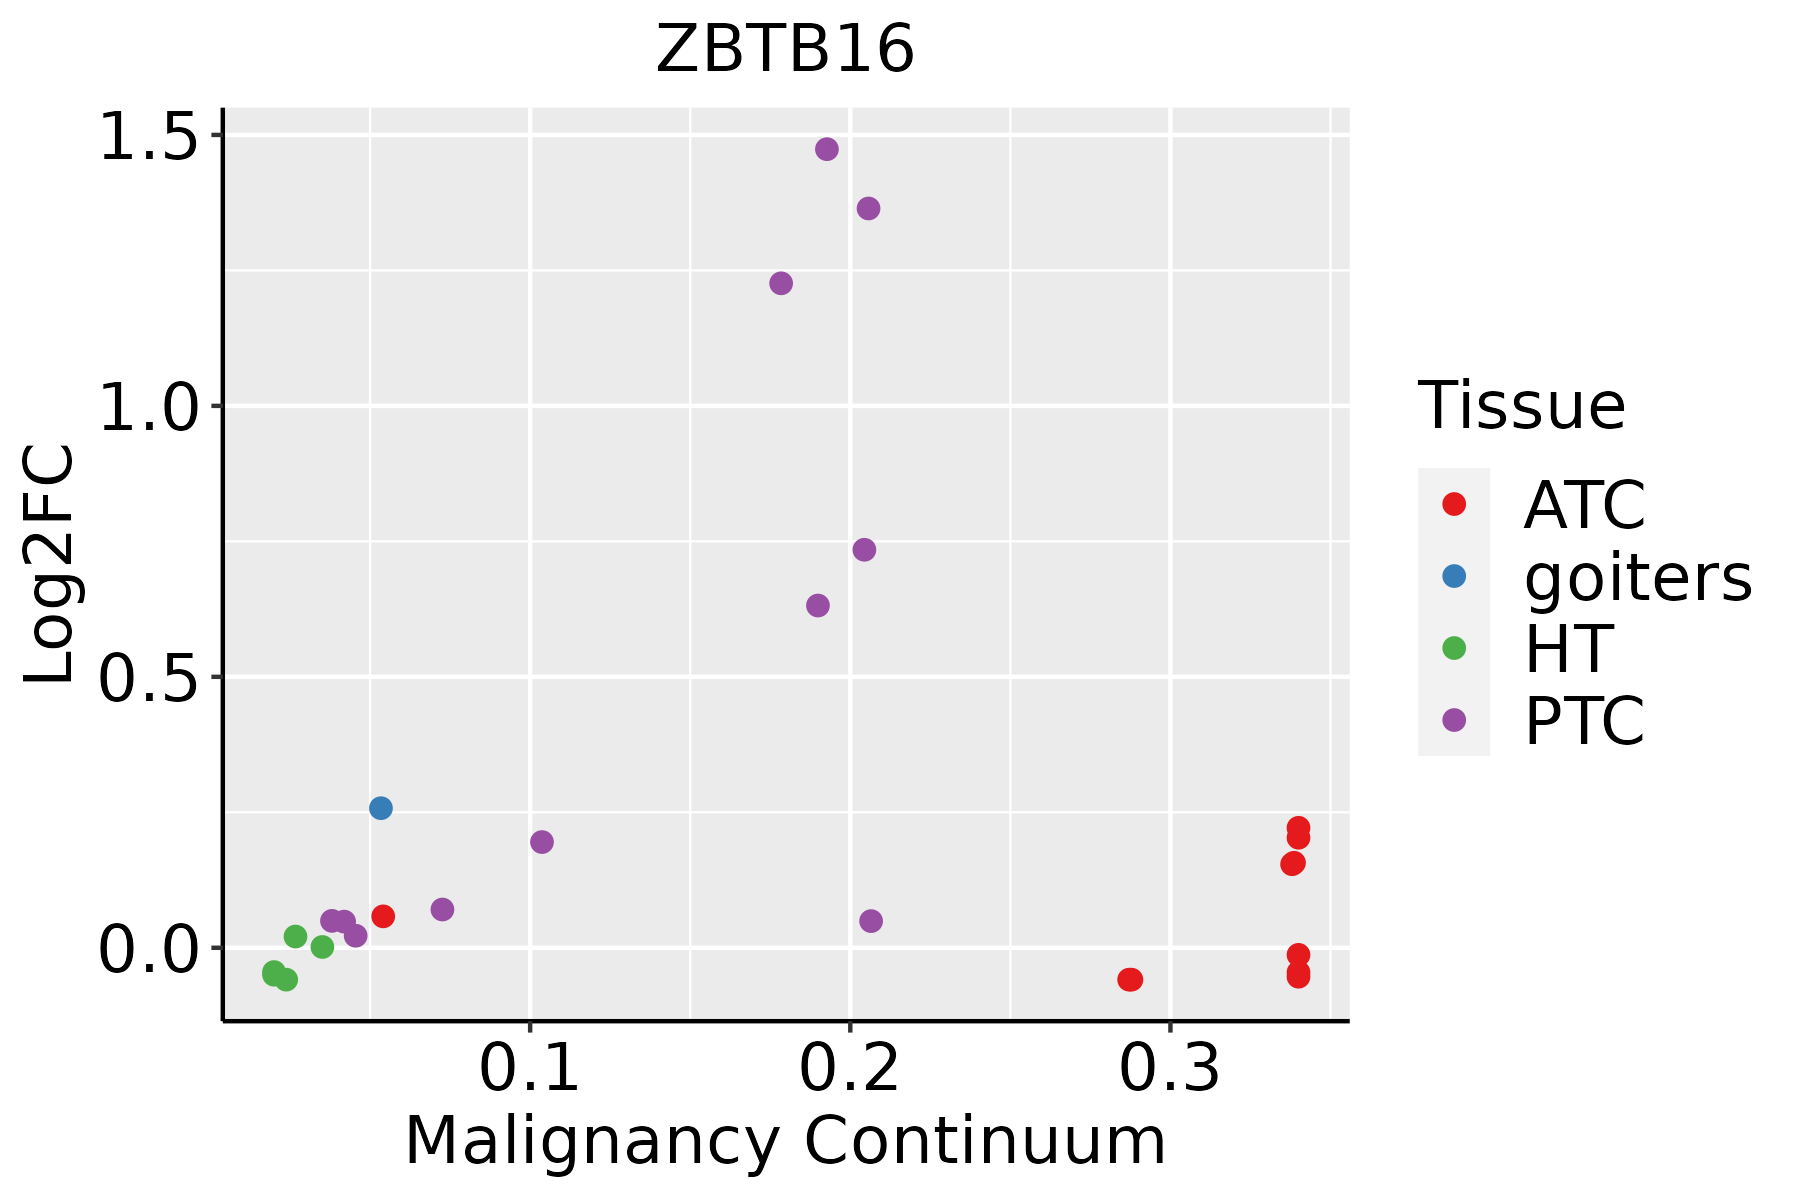 | ATC: Anaplastic thyroid cancer |
| HT: Hashimoto's thyroiditis | ||
| PTC: Papillary thyroid cancer |
| ∗log2FC in expression of this searched gene in stem-like cells from each diseased tissue sample relative to stem-like cells in normal samples in each tissue plotted against the malignancy continuum. Samples are colored based on if they are from different disease stage. |
Top |
Malignant transformation related pathway analysis |
| Find out the enriched GO biological processes and KEGG pathways involved in transition from healthy to precancer to cancer |
| Tissue | Disease Stage | Enriched GO biological Processes |
| Colorectum | AD |  |
| Colorectum | SER |  |
| Colorectum | MSS |  |
| Colorectum | MSI-H |  |
| Colorectum | FAP |  |
| ∗Top 15 enriched GO BP terms are showed in the bar plot of each disease state in each tissue. Each row represents a significant GO biological process which is colored according to the -log10(p.adjust). |
| Page: 1 2 3 4 5 6 7 8 9 |
| GO ID | Tissue | Disease Stage | Description | Gene Ratio | Bg Ratio | pvalue | p.adjust | Count |
| GO:0030099 | Colorectum | AD | myeloid cell differentiation | 119/3918 | 381/18723 | 1.24e-06 | 4.01e-05 | 119 |
| GO:0034504 | Colorectum | AD | protein localization to nucleus | 94/3918 | 290/18723 | 2.83e-06 | 8.09e-05 | 94 |
| GO:0045785 | Colorectum | AD | positive regulation of cell adhesion | 122/3918 | 437/18723 | 2.65e-04 | 3.28e-03 | 122 |
| GO:1903706 | Colorectum | AD | regulation of hemopoiesis | 99/3918 | 367/18723 | 3.08e-03 | 2.28e-02 | 99 |
| GO:0045637 | Colorectum | AD | regulation of myeloid cell differentiation | 61/3918 | 210/18723 | 3.17e-03 | 2.35e-02 | 61 |
| GO:0048736 | Colorectum | AD | appendage development | 51/3918 | 172/18723 | 4.20e-03 | 2.89e-02 | 51 |
| GO:0060173 | Colorectum | AD | limb development | 51/3918 | 172/18723 | 4.20e-03 | 2.89e-02 | 51 |
| GO:0001503 | Colorectum | AD | ossification | 106/3918 | 408/18723 | 7.68e-03 | 4.64e-02 | 106 |
| GO:0001865 | Colorectum | AD | NK T cell differentiation | 6/3918 | 10/18723 | 8.03e-03 | 4.73e-02 | 6 |
| GO:00345041 | Colorectum | SER | protein localization to nucleus | 74/2897 | 290/18723 | 5.74e-06 | 2.05e-04 | 74 |
| GO:00457851 | Colorectum | SER | positive regulation of cell adhesion | 93/2897 | 437/18723 | 6.78e-04 | 9.04e-03 | 93 |
| GO:00487361 | Colorectum | SER | appendage development | 42/2897 | 172/18723 | 1.43e-03 | 1.55e-02 | 42 |
| GO:00601731 | Colorectum | SER | limb development | 42/2897 | 172/18723 | 1.43e-03 | 1.55e-02 | 42 |
| GO:00300991 | Colorectum | SER | myeloid cell differentiation | 80/2897 | 381/18723 | 2.28e-03 | 2.18e-02 | 80 |
| GO:0045444 | Colorectum | SER | fat cell differentiation | 51/2897 | 229/18723 | 3.96e-03 | 3.26e-02 | 51 |
| GO:0045600 | Colorectum | SER | positive regulation of fat cell differentiation | 19/2897 | 66/18723 | 4.29e-03 | 3.45e-02 | 19 |
| GO:0035107 | Colorectum | SER | appendage morphogenesis | 33/2897 | 138/18723 | 6.10e-03 | 4.42e-02 | 33 |
| GO:0035108 | Colorectum | SER | limb morphogenesis | 33/2897 | 138/18723 | 6.10e-03 | 4.42e-02 | 33 |
| GO:00015031 | Colorectum | SER | ossification | 82/2897 | 408/18723 | 6.76e-03 | 4.78e-02 | 82 |
| GO:00345042 | Colorectum | MSS | protein localization to nucleus | 92/3467 | 290/18723 | 3.66e-08 | 1.98e-06 | 92 |
| Page: 1 2 3 4 5 6 7 8 9 10 11 |
| Pathway ID | Tissue | Disease Stage | Description | Gene Ratio | Bg Ratio | pvalue | p.adjust | qvalue | Count |
| hsa05202 | Colorectum | FAP | Transcriptional misregulation in cancer | 45/1404 | 193/8465 | 9.19e-03 | 3.33e-02 | 2.03e-02 | 45 |
| hsa052021 | Colorectum | FAP | Transcriptional misregulation in cancer | 45/1404 | 193/8465 | 9.19e-03 | 3.33e-02 | 2.03e-02 | 45 |
| hsa052026 | Lung | IAC | Transcriptional misregulation in cancer | 40/1053 | 193/8465 | 6.90e-04 | 5.90e-03 | 3.92e-03 | 40 |
| hsa0520211 | Lung | IAC | Transcriptional misregulation in cancer | 40/1053 | 193/8465 | 6.90e-04 | 5.90e-03 | 3.92e-03 | 40 |
| hsa052022 | Lung | AIS | Transcriptional misregulation in cancer | 39/961 | 193/8465 | 2.15e-04 | 2.41e-03 | 1.54e-03 | 39 |
| hsa052023 | Lung | AIS | Transcriptional misregulation in cancer | 39/961 | 193/8465 | 2.15e-04 | 2.41e-03 | 1.54e-03 | 39 |
| hsa052024 | Lung | MIAC | Transcriptional misregulation in cancer | 22/507 | 193/8465 | 2.64e-03 | 2.26e-02 | 1.64e-02 | 22 |
| hsa052025 | Lung | MIAC | Transcriptional misregulation in cancer | 22/507 | 193/8465 | 2.64e-03 | 2.26e-02 | 1.64e-02 | 22 |
| hsa052027 | Prostate | BPH | Transcriptional misregulation in cancer | 53/1718 | 193/8465 | 9.56e-03 | 2.92e-02 | 1.81e-02 | 53 |
| hsa0520212 | Prostate | BPH | Transcriptional misregulation in cancer | 53/1718 | 193/8465 | 9.56e-03 | 2.92e-02 | 1.81e-02 | 53 |
| hsa0520221 | Prostate | Tumor | Transcriptional misregulation in cancer | 59/1791 | 193/8465 | 1.22e-03 | 5.26e-03 | 3.26e-03 | 59 |
| hsa0520231 | Prostate | Tumor | Transcriptional misregulation in cancer | 59/1791 | 193/8465 | 1.22e-03 | 5.26e-03 | 3.26e-03 | 59 |
| Page: 1 |
Top |
Cell-cell communication analysis |
| Identification of potential cell-cell interactions between two cell types and their ligand-receptor pairs for different disease states |
| Ligand | Receptor | LRpair | Pathway | Tissue | Disease Stage |
| Page: 1 |
Top |
Single-cell gene regulatory network inference analysis |
| Find out the significant the regulons (TFs) and the target genes of each regulon across cell types for different disease states |
| TF | Cell Type | Tissue | Disease Stage | Target Gene | RSS | Regulon Activity |
| ZBTB16 | EE | Stomach | Healthy | ERO1B,ERP27,PABPC4, etc. | 3.39e-01 |  |
| ∗The dot plots of a searched regulon are shown for all cell subpopulations in each disease state of each tissue based on the regulon specific score inferred using pySCENIC and by calculating the average expression. |
| Page: 1 |
Top |
Somatic mutation of malignant transformation related genes |
| Annotation of somatic variants for genes involved in malignant transformation |
| Hugo Symbol | Variant Class | Variant Classification | dbSNP RS | HGVSc | HGVSp | HGVSp Short | SWISSPROT | BIOTYPE | SIFT | PolyPhen | Tumor Sample Barcode | Tissue | Histology | Sex | Age | Stage | Therapy Types | Drugs | Outcome |
| ZBTB16 | SNV | Missense_Mutation | c.817G>A | p.Glu273Lys | p.E273K | Q05516 | protein_coding | tolerated(0.52) | benign(0.015) | TCGA-EK-A2RB-01 | Cervix | cervical & endocervical cancer | Female | <65 | I/II | Unknown | Unknown | SD | |
| ZBTB16 | SNV | Missense_Mutation | c.1568N>C | p.Cys523Ser | p.C523S | Q05516 | protein_coding | deleterious(0.01) | probably_damaging(0.997) | TCGA-FU-A3WB-01 | Cervix | cervical & endocervical cancer | Female | <65 | I/II | Chemotherapy | cisplatin | CR | |
| ZBTB16 | SNV | Missense_Mutation | novel | c.1816N>G | p.Leu606Val | p.L606V | Q05516 | protein_coding | deleterious(0.01) | probably_damaging(0.992) | TCGA-5M-AAT4-01 | Colorectum | colon adenocarcinoma | Male | >=65 | III/IV | Unknown | Unknown | PD |
| ZBTB16 | SNV | Missense_Mutation | c.257N>G | p.Tyr86Cys | p.Y86C | Q05516 | protein_coding | deleterious(0) | probably_damaging(0.999) | TCGA-AA-3815-01 | Colorectum | colon adenocarcinoma | Female | >=65 | I/II | Unknown | Unknown | SD | |
| ZBTB16 | SNV | Missense_Mutation | c.1492N>T | p.Arg498Cys | p.R498C | Q05516 | protein_coding | deleterious(0.04) | probably_damaging(0.994) | TCGA-AA-3815-01 | Colorectum | colon adenocarcinoma | Female | >=65 | I/II | Unknown | Unknown | SD | |
| ZBTB16 | SNV | Missense_Mutation | c.848N>T | p.Pro283Leu | p.P283L | Q05516 | protein_coding | deleterious(0) | probably_damaging(0.997) | TCGA-AA-3966-01 | Colorectum | colon adenocarcinoma | Female | >=65 | I/II | Unknown | Unknown | SD | |
| ZBTB16 | SNV | Missense_Mutation | rs750494052 | c.1081N>T | p.Ala361Ser | p.A361S | Q05516 | protein_coding | tolerated(0.52) | benign(0.003) | TCGA-AA-3994-01 | Colorectum | colon adenocarcinoma | Male | >=65 | III/IV | Chemotherapy | capecitabine | CR |
| ZBTB16 | SNV | Missense_Mutation | c.346G>A | p.Glu116Lys | p.E116K | Q05516 | protein_coding | deleterious(0.01) | probably_damaging(0.994) | TCGA-AA-A00N-01 | Colorectum | colon adenocarcinoma | Male | >=65 | I/II | Unknown | Unknown | PD | |
| ZBTB16 | SNV | Missense_Mutation | c.1367N>T | p.Ala456Val | p.A456V | Q05516 | protein_coding | deleterious(0) | probably_damaging(0.991) | TCGA-AD-6889-01 | Colorectum | colon adenocarcinoma | Male | >=65 | I/II | Chemotherapy | xeloda | PD | |
| ZBTB16 | SNV | Missense_Mutation | rs763360681 | c.443N>A | p.Arg148His | p.R148H | Q05516 | protein_coding | tolerated(0.07) | benign(0.379) | TCGA-AZ-4313-01 | Colorectum | colon adenocarcinoma | Female | <65 | I/II | Unknown | Unknown | SD |
| Page: 1 2 3 4 5 6 7 8 9 10 11 |
Top |
Related drugs of malignant transformation related genes |
| Identification of chemicals and drugs interact with genes involved in malignant transfromation |
| (DGIdb 4.0) |
| Entrez ID | Symbol | Category | Interaction Types | Drug Claim Name | Drug Name | PMIDs |
| Page: 1 |

Copyright 2023-Present -The University of Texas Health Science Center at Houston |