
|
|||||
|
 | |
| |
| |
| |
| |
| |
|
Gene: TSPAN13 |
Gene summary for TSPAN13 |
| Gene information | Species | Human | Gene symbol | TSPAN13 | Gene ID | 27075 |
| Gene name | tetraspanin 13 | |
| Gene Alias | NET-6 | |
| Cytomap | 7p21.1 | |
| Gene Type | protein-coding | GO ID | GO:0006810 | UniProtAcc | O95857 |
Top |
Malignant transformation analysis |
| Identification of the aberrant gene expression in precancerous and cancerous lesions by comparing the gene expression of stem-like cells in diseased tissues with normal stem cells |
| Entrez ID | Symbol | Replicates | Species | Organ | Tissue | Adj P-value | Log2FC | Malignancy |
| 27075 | TSPAN13 | GSM4909281 | Human | Breast | IDC | 3.52e-03 | 2.80e-01 | 0.21 |
| 27075 | TSPAN13 | GSM4909286 | Human | Breast | IDC | 2.30e-04 | -2.23e-01 | 0.1081 |
| 27075 | TSPAN13 | GSM4909290 | Human | Breast | IDC | 3.00e-07 | 4.02e-01 | 0.2096 |
| 27075 | TSPAN13 | GSM4909296 | Human | Breast | IDC | 5.73e-05 | -1.01e-01 | 0.1524 |
| 27075 | TSPAN13 | GSM4909297 | Human | Breast | IDC | 2.78e-09 | 2.54e-01 | 0.1517 |
| 27075 | TSPAN13 | GSM4909298 | Human | Breast | IDC | 5.91e-25 | 6.60e-01 | 0.1551 |
| 27075 | TSPAN13 | GSM4909302 | Human | Breast | IDC | 1.05e-03 | 2.59e-01 | 0.1545 |
| 27075 | TSPAN13 | GSM4909304 | Human | Breast | IDC | 2.94e-14 | 5.40e-01 | 0.1636 |
| 27075 | TSPAN13 | GSM4909306 | Human | Breast | IDC | 1.45e-07 | 4.34e-01 | 0.1564 |
| 27075 | TSPAN13 | GSM4909307 | Human | Breast | IDC | 3.63e-05 | 3.96e-01 | 0.1569 |
| 27075 | TSPAN13 | GSM4909308 | Human | Breast | IDC | 2.94e-84 | 1.12e+00 | 0.158 |
| 27075 | TSPAN13 | GSM4909311 | Human | Breast | IDC | 1.40e-22 | -1.51e-01 | 0.1534 |
| 27075 | TSPAN13 | GSM4909312 | Human | Breast | IDC | 7.10e-13 | 4.26e-01 | 0.1552 |
| 27075 | TSPAN13 | GSM4909313 | Human | Breast | IDC | 2.17e-07 | 3.35e-01 | 0.0391 |
| 27075 | TSPAN13 | GSM4909315 | Human | Breast | IDC | 4.55e-27 | 6.93e-01 | 0.21 |
| 27075 | TSPAN13 | GSM4909316 | Human | Breast | IDC | 1.04e-20 | 7.08e-01 | 0.21 |
| 27075 | TSPAN13 | GSM4909317 | Human | Breast | IDC | 1.73e-05 | 3.43e-01 | 0.1355 |
| 27075 | TSPAN13 | GSM4909318 | Human | Breast | IDC | 1.17e-03 | 4.01e-01 | 0.2031 |
| 27075 | TSPAN13 | GSM4909319 | Human | Breast | IDC | 1.56e-28 | -1.51e-01 | 0.1563 |
| 27075 | TSPAN13 | GSM4909321 | Human | Breast | IDC | 1.29e-27 | 6.34e-01 | 0.1559 |
| Page: 1 2 3 4 5 6 7 8 |
| Tissue | Expression Dynamics | Abbreviation |
| Breast | 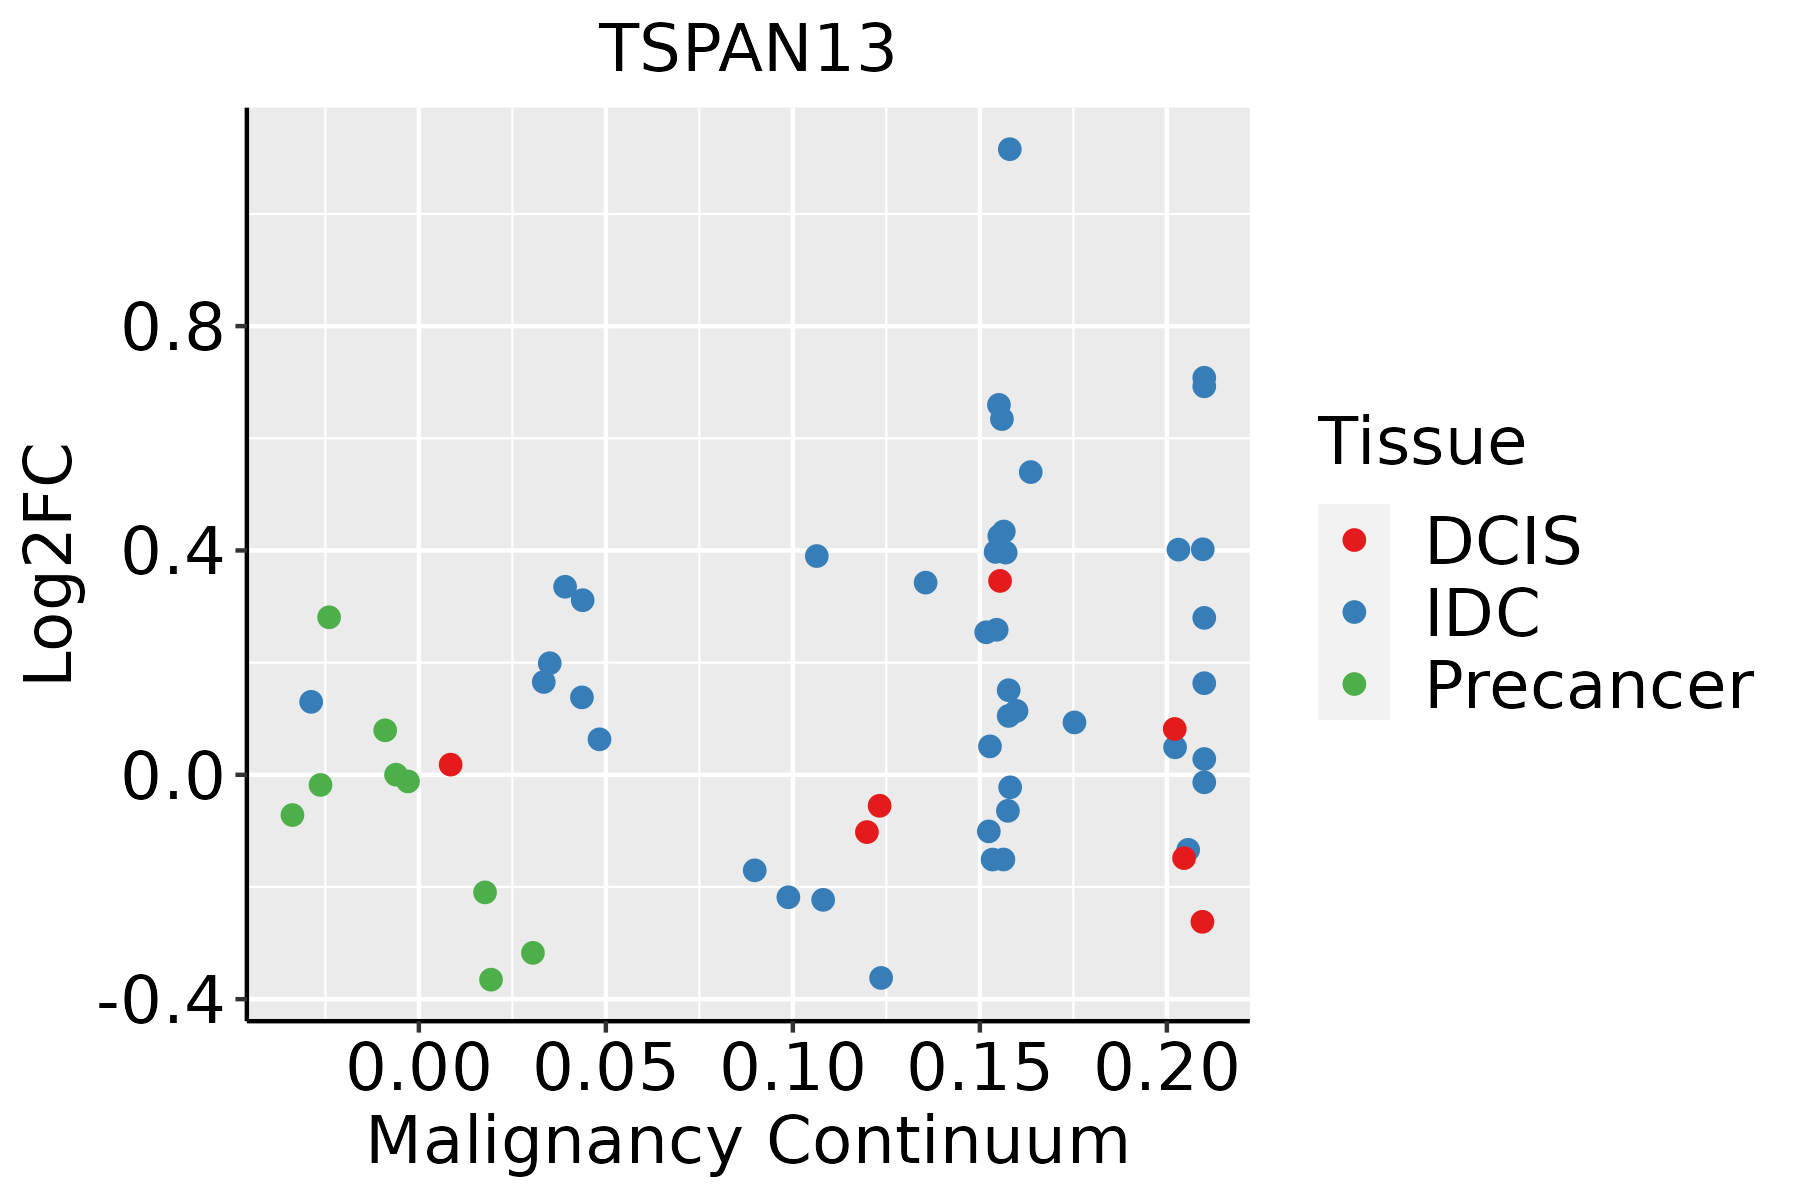 | IDC: Invasive ductal carcinoma |
| DCIS: Ductal carcinoma in situ | ||
| Precancer(BRCA1-mut): Precancerous lesion from BRCA1 mutation carriers | ||
| Cervix | 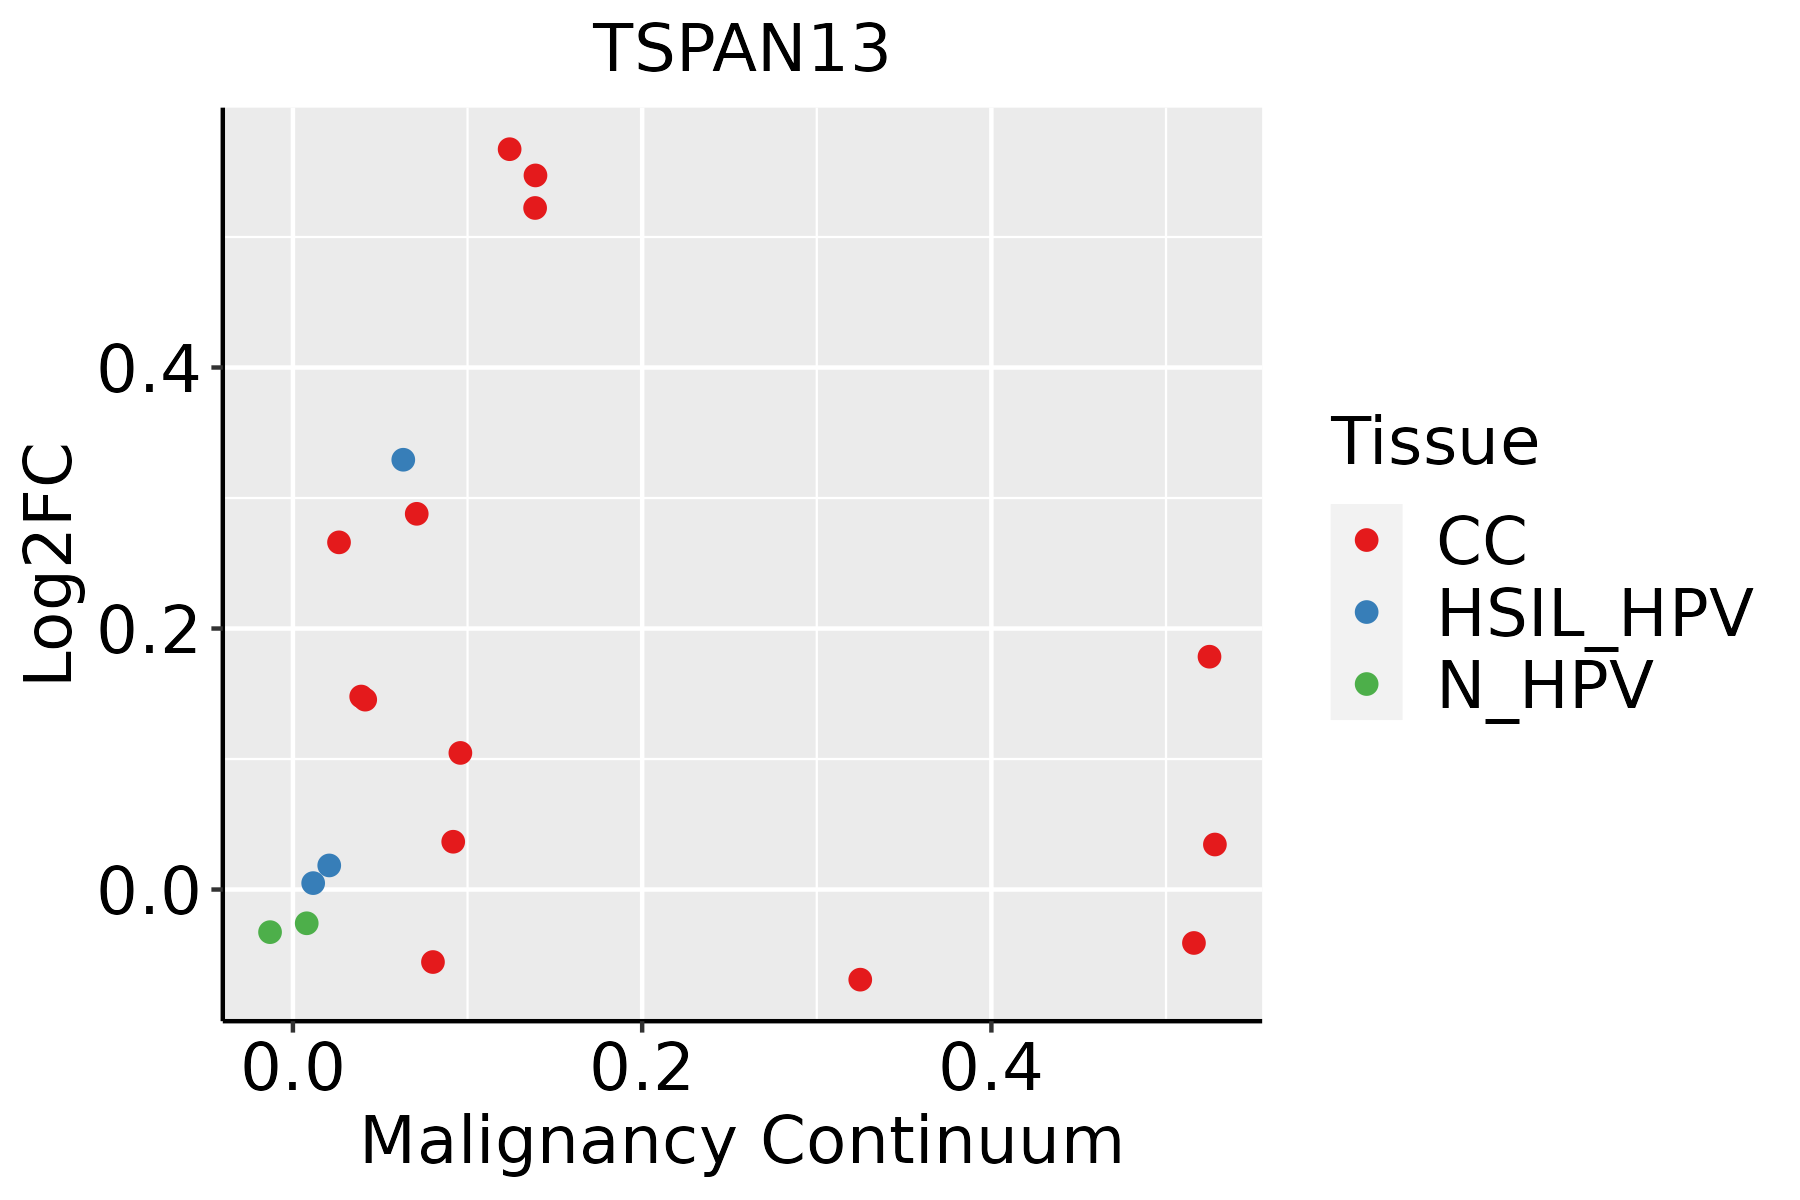 | CC: Cervix cancer |
| HSIL_HPV: HPV-infected high-grade squamous intraepithelial lesions | ||
| N_HPV: HPV-infected normal cervix | ||
| Colorectum (GSE201348) |  | FAP: Familial adenomatous polyposis |
| CRC: Colorectal cancer | ||
| Colorectum (HTA11) |  | AD: Adenomas |
| SER: Sessile serrated lesions | ||
| MSI-H: Microsatellite-high colorectal cancer | ||
| MSS: Microsatellite stable colorectal cancer | ||
| Esophagus | 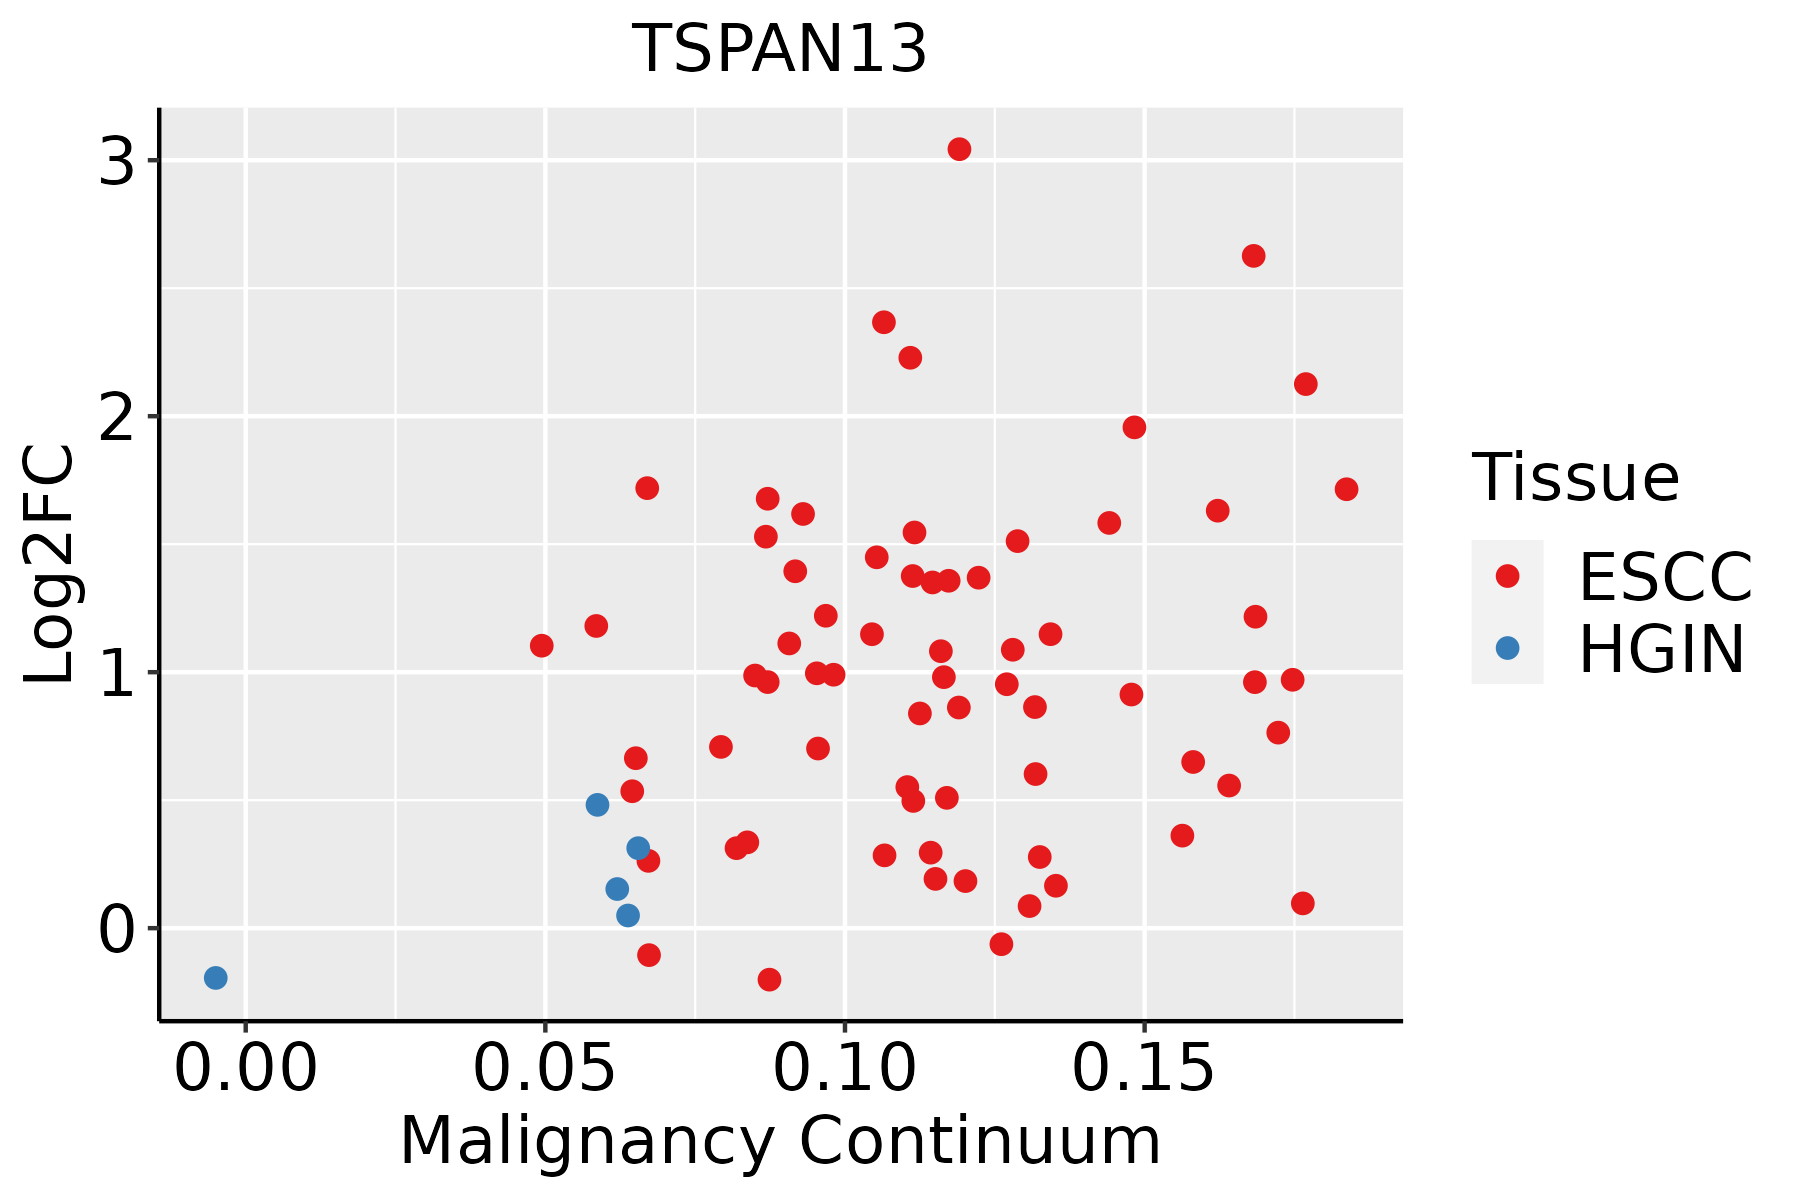 | ESCC: Esophageal squamous cell carcinoma |
| HGIN: High-grade intraepithelial neoplasias | ||
| LGIN: Low-grade intraepithelial neoplasias | ||
| Oral Cavity | 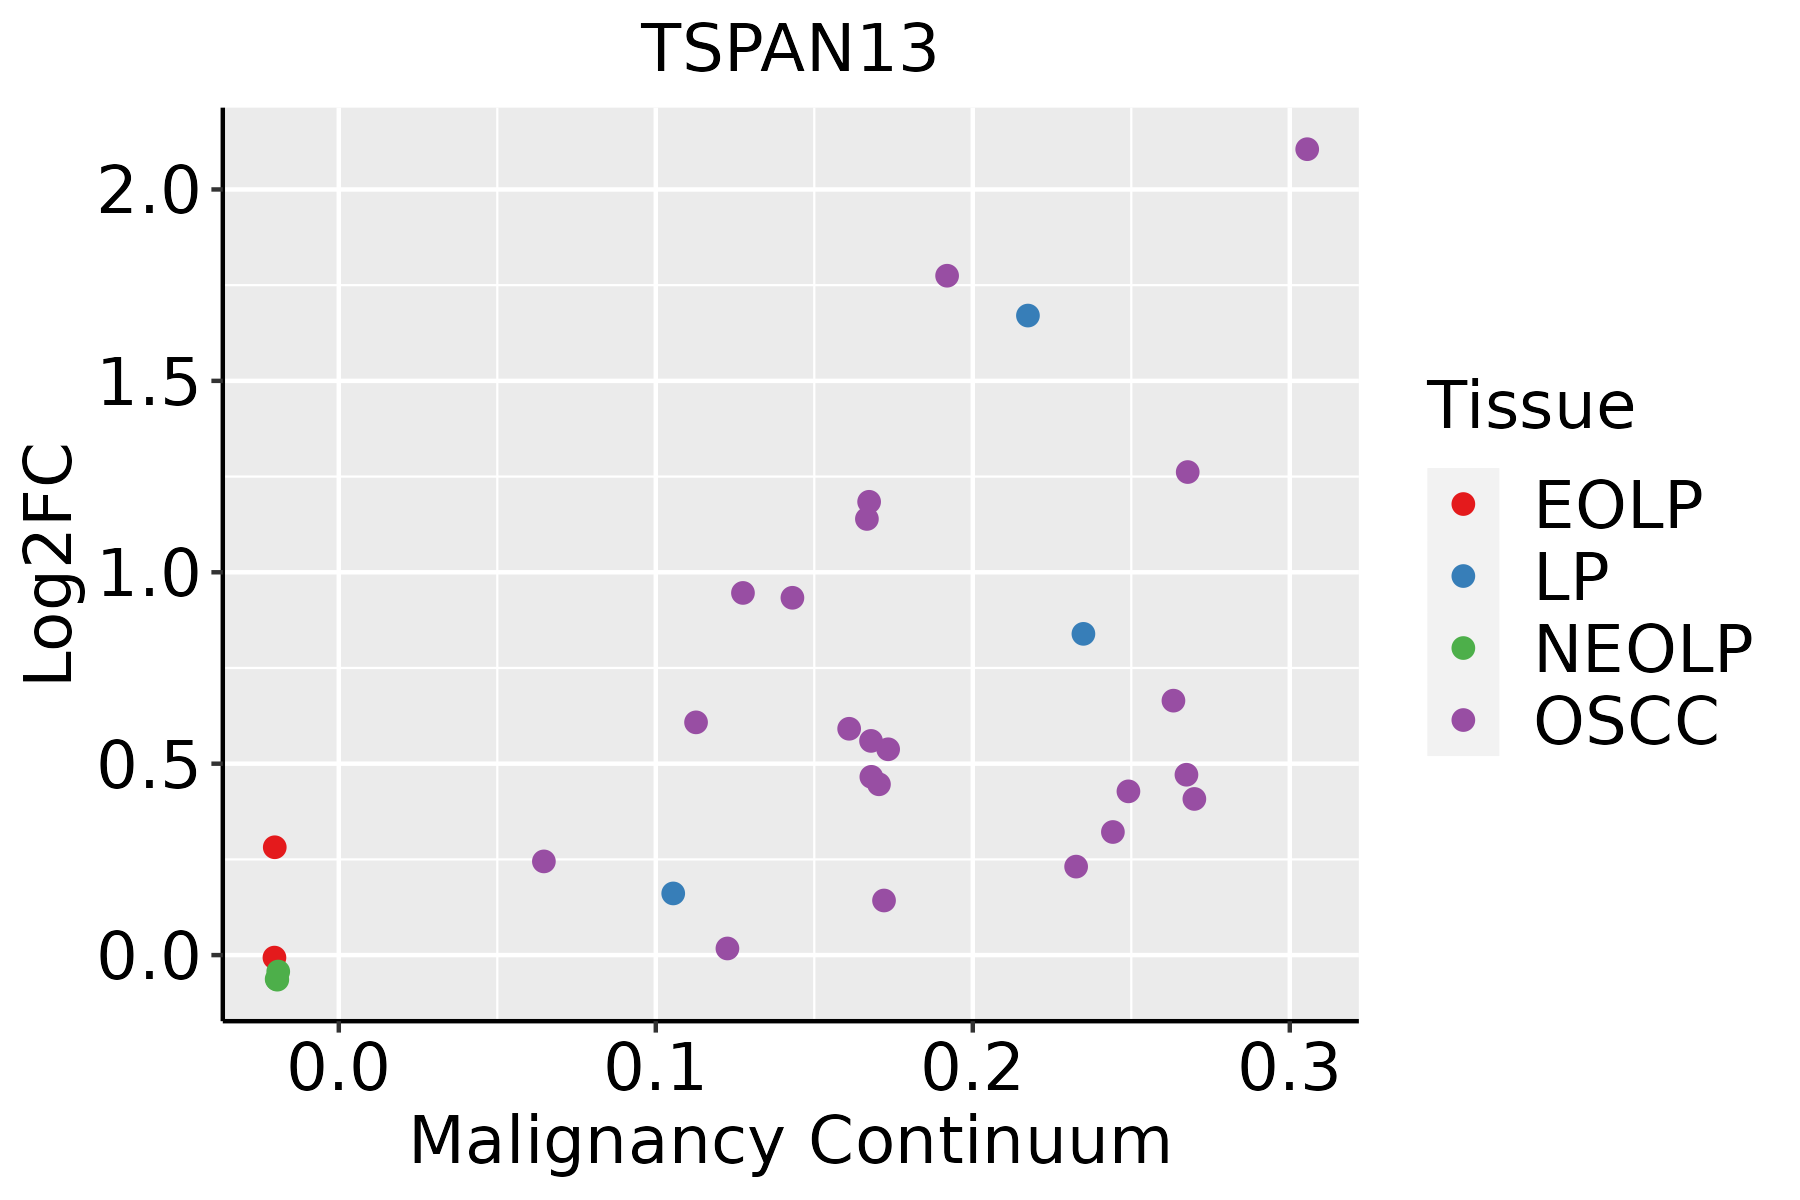 | EOLP: Erosive Oral lichen planus |
| LP: leukoplakia | ||
| NEOLP: Non-erosive oral lichen planus | ||
| OSCC: Oral squamous cell carcinoma | ||
| Prostate |  | BPH: Benign Prostatic Hyperplasia |
| Skin |  | AK: Actinic keratosis |
| cSCC: Cutaneous squamous cell carcinoma | ||
| SCCIS:squamous cell carcinoma in situ | ||
| Thyroid | 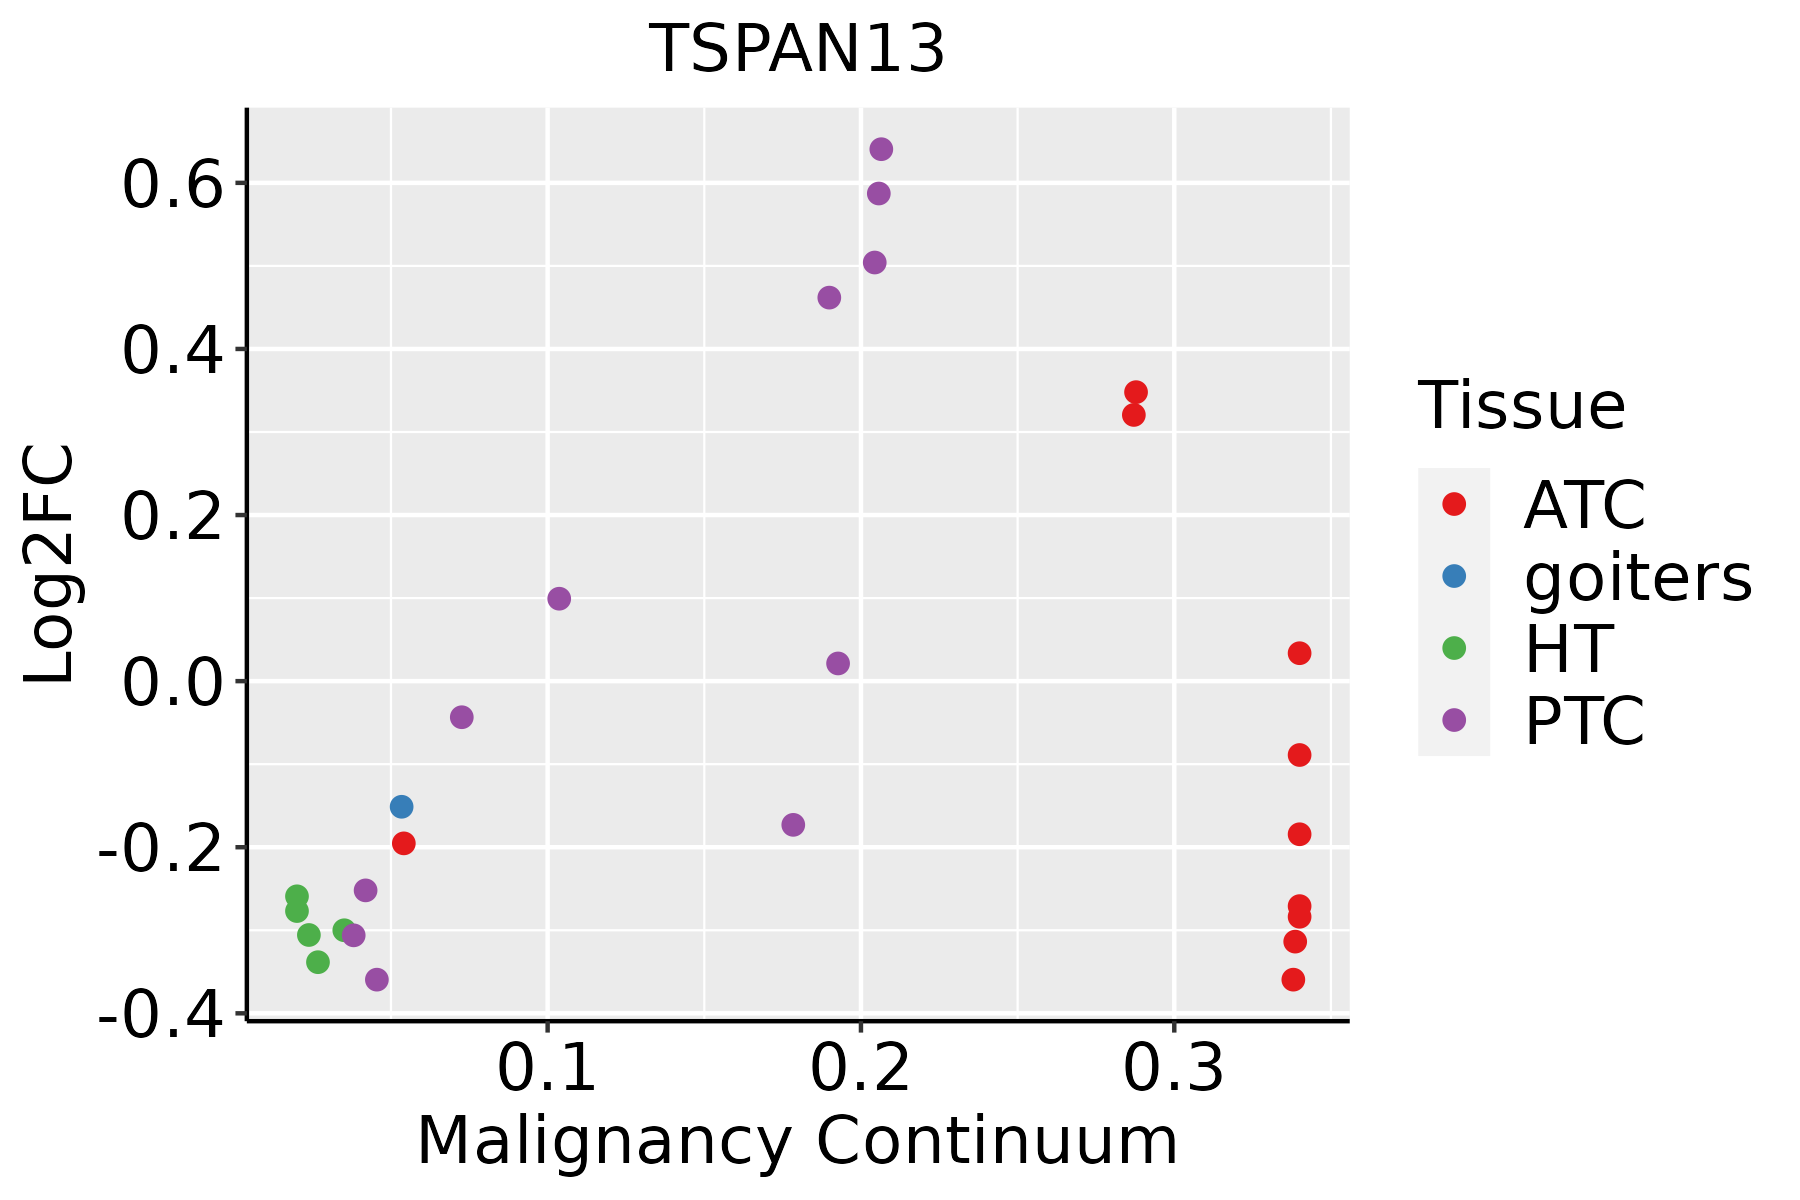 | ATC: Anaplastic thyroid cancer |
| HT: Hashimoto's thyroiditis | ||
| PTC: Papillary thyroid cancer |
| ∗log2FC in expression of this searched gene in stem-like cells from each diseased tissue sample relative to stem-like cells in normal samples in each tissue plotted against the malignancy continuum. Samples are colored based on if they are from different disease stage. |
Top |
Malignant transformation related pathway analysis |
| Find out the enriched GO biological processes and KEGG pathways involved in transition from healthy to precancer to cancer |
| Tissue | Disease Stage | Enriched GO biological Processes |
| Colorectum | AD |  |
| Colorectum | SER |  |
| Colorectum | MSS |  |
| Colorectum | MSI-H |  |
| Colorectum | FAP |  |
| ∗Top 15 enriched GO BP terms are showed in the bar plot of each disease state in each tissue. Each row represents a significant GO biological process which is colored according to the -log10(p.adjust). |
| Page: 1 2 3 4 5 6 7 8 9 |
| GO ID | Tissue | Disease Stage | Description | Gene Ratio | Bg Ratio | pvalue | p.adjust | Count |
| GO:00109596 | Breast | Precancer | regulation of metal ion transport | 37/1080 | 406/18723 | 4.07e-03 | 3.22e-02 | 37 |
| GO:001095913 | Breast | IDC | regulation of metal ion transport | 52/1434 | 406/18723 | 1.76e-04 | 2.97e-03 | 52 |
| GO:0051924 | Breast | IDC | regulation of calcium ion transport | 32/1434 | 255/18723 | 3.94e-03 | 3.22e-02 | 32 |
| GO:001095921 | Breast | DCIS | regulation of metal ion transport | 50/1390 | 406/18723 | 2.86e-04 | 4.22e-03 | 50 |
| GO:0010959 | Colorectum | FAP | regulation of metal ion transport | 83/2622 | 406/18723 | 2.06e-04 | 2.96e-03 | 83 |
| GO:1904062 | Colorectum | FAP | regulation of cation transmembrane transport | 69/2622 | 357/18723 | 3.06e-03 | 2.30e-02 | 69 |
| Page: 1 |
| Pathway ID | Tissue | Disease Stage | Description | Gene Ratio | Bg Ratio | pvalue | p.adjust | qvalue | Count |
| Page: 1 |
Top |
Cell-cell communication analysis |
| Identification of potential cell-cell interactions between two cell types and their ligand-receptor pairs for different disease states |
| Ligand | Receptor | LRpair | Pathway | Tissue | Disease Stage |
| Page: 1 |
Top |
Single-cell gene regulatory network inference analysis |
| Find out the significant the regulons (TFs) and the target genes of each regulon across cell types for different disease states |
| TF | Cell Type | Tissue | Disease Stage | Target Gene | RSS | Regulon Activity |
| ∗The dot plots of a searched regulon are shown for all cell subpopulations in each disease state of each tissue based on the regulon specific score inferred using pySCENIC and by calculating the average expression. |
| Page: 1 |
Top |
Somatic mutation of malignant transformation related genes |
| Annotation of somatic variants for genes involved in malignant transformation |
| Hugo Symbol | Variant Class | Variant Classification | dbSNP RS | HGVSc | HGVSp | HGVSp Short | SWISSPROT | BIOTYPE | SIFT | PolyPhen | Tumor Sample Barcode | Tissue | Histology | Sex | Age | Stage | Therapy Types | Drugs | Outcome |
| TSPAN13 | SNV | Missense_Mutation | novel | c.592G>A | p.Ala198Thr | p.A198T | O95857 | protein_coding | deleterious(0.04) | benign(0.062) | TCGA-VQ-A8PP-01 | Stomach | stomach adenocarcinoma | Male | >=65 | III/IV | Chemotherapy | fluorouracil | PD |
| TSPAN13 | insertion | Frame_Shift_Ins | novel | c.584_585insC | p.Arg197ProfsTer5 | p.R197Pfs*5 | O95857 | protein_coding | TCGA-MX-A5UJ-01 | Stomach | stomach adenocarcinoma | Female | >=65 | III/IV | Unknown | Unknown | SD |
| Page: 1 2 |
Top |
Related drugs of malignant transformation related genes |
| Identification of chemicals and drugs interact with genes involved in malignant transfromation |
| (DGIdb 4.0) |
| Entrez ID | Symbol | Category | Interaction Types | Drug Claim Name | Drug Name | PMIDs |
| Page: 1 |

Copyright 2023-Present -The University of Texas Health Science Center at Houston |