
|
|||||
|
 | |
| |
| |
| |
| |
| |
|
Gene: TP53INP1 |
Gene summary for TP53INP1 |
| Gene information | Species | Human | Gene symbol | TP53INP1 | Gene ID | 94241 |
| Gene name | tumor protein p53 inducible nuclear protein 1 | |
| Gene Alias | SIP | |
| Cytomap | 8q22.1 | |
| Gene Type | protein-coding | GO ID | GO:0000045 | UniProtAcc | Q96A56 |
Top |
Malignant transformation analysis |
| Identification of the aberrant gene expression in precancerous and cancerous lesions by comparing the gene expression of stem-like cells in diseased tissues with normal stem cells |
| Entrez ID | Symbol | Replicates | Species | Organ | Tissue | Adj P-value | Log2FC | Malignancy |
| 94241 | TP53INP1 | LZE24T | Human | Esophagus | ESCC | 1.27e-21 | 6.26e-01 | 0.0596 |
| 94241 | TP53INP1 | P2T-E | Human | Esophagus | ESCC | 1.11e-08 | 1.35e-01 | 0.1177 |
| 94241 | TP53INP1 | P8T-E | Human | Esophagus | ESCC | 7.02e-11 | 1.46e-01 | 0.0889 |
| 94241 | TP53INP1 | P9T-E | Human | Esophagus | ESCC | 4.04e-06 | 9.56e-02 | 0.1131 |
| 94241 | TP53INP1 | P10T-E | Human | Esophagus | ESCC | 2.53e-16 | 3.30e-01 | 0.116 |
| 94241 | TP53INP1 | P12T-E | Human | Esophagus | ESCC | 5.98e-09 | 2.10e-01 | 0.1122 |
| 94241 | TP53INP1 | P15T-E | Human | Esophagus | ESCC | 4.78e-02 | 1.36e-01 | 0.1149 |
| 94241 | TP53INP1 | P16T-E | Human | Esophagus | ESCC | 2.52e-03 | 9.69e-02 | 0.1153 |
| 94241 | TP53INP1 | P20T-E | Human | Esophagus | ESCC | 4.49e-02 | 7.49e-02 | 0.1124 |
| 94241 | TP53INP1 | P21T-E | Human | Esophagus | ESCC | 7.13e-04 | 2.62e-02 | 0.1617 |
| 94241 | TP53INP1 | P22T-E | Human | Esophagus | ESCC | 3.09e-05 | 9.06e-02 | 0.1236 |
| 94241 | TP53INP1 | P23T-E | Human | Esophagus | ESCC | 2.02e-03 | 1.88e-01 | 0.108 |
| 94241 | TP53INP1 | P26T-E | Human | Esophagus | ESCC | 7.09e-04 | 4.77e-02 | 0.1276 |
| 94241 | TP53INP1 | P27T-E | Human | Esophagus | ESCC | 8.37e-08 | 2.14e-01 | 0.1055 |
| 94241 | TP53INP1 | P31T-E | Human | Esophagus | ESCC | 2.50e-09 | 2.06e-01 | 0.1251 |
| 94241 | TP53INP1 | P32T-E | Human | Esophagus | ESCC | 1.71e-02 | 1.75e-02 | 0.1666 |
| 94241 | TP53INP1 | P36T-E | Human | Esophagus | ESCC | 1.49e-05 | 1.65e-01 | 0.1187 |
| 94241 | TP53INP1 | P39T-E | Human | Esophagus | ESCC | 7.08e-04 | 8.66e-02 | 0.0894 |
| 94241 | TP53INP1 | P42T-E | Human | Esophagus | ESCC | 6.12e-03 | 1.10e-01 | 0.1175 |
| 94241 | TP53INP1 | P48T-E | Human | Esophagus | ESCC | 3.52e-05 | 7.99e-02 | 0.0959 |
| Page: 1 2 3 |
| Tissue | Expression Dynamics | Abbreviation |
| Esophagus |  | ESCC: Esophageal squamous cell carcinoma |
| HGIN: High-grade intraepithelial neoplasias | ||
| LGIN: Low-grade intraepithelial neoplasias | ||
| Liver |  | HCC: Hepatocellular carcinoma |
| NAFLD: Non-alcoholic fatty liver disease | ||
| Prostate | 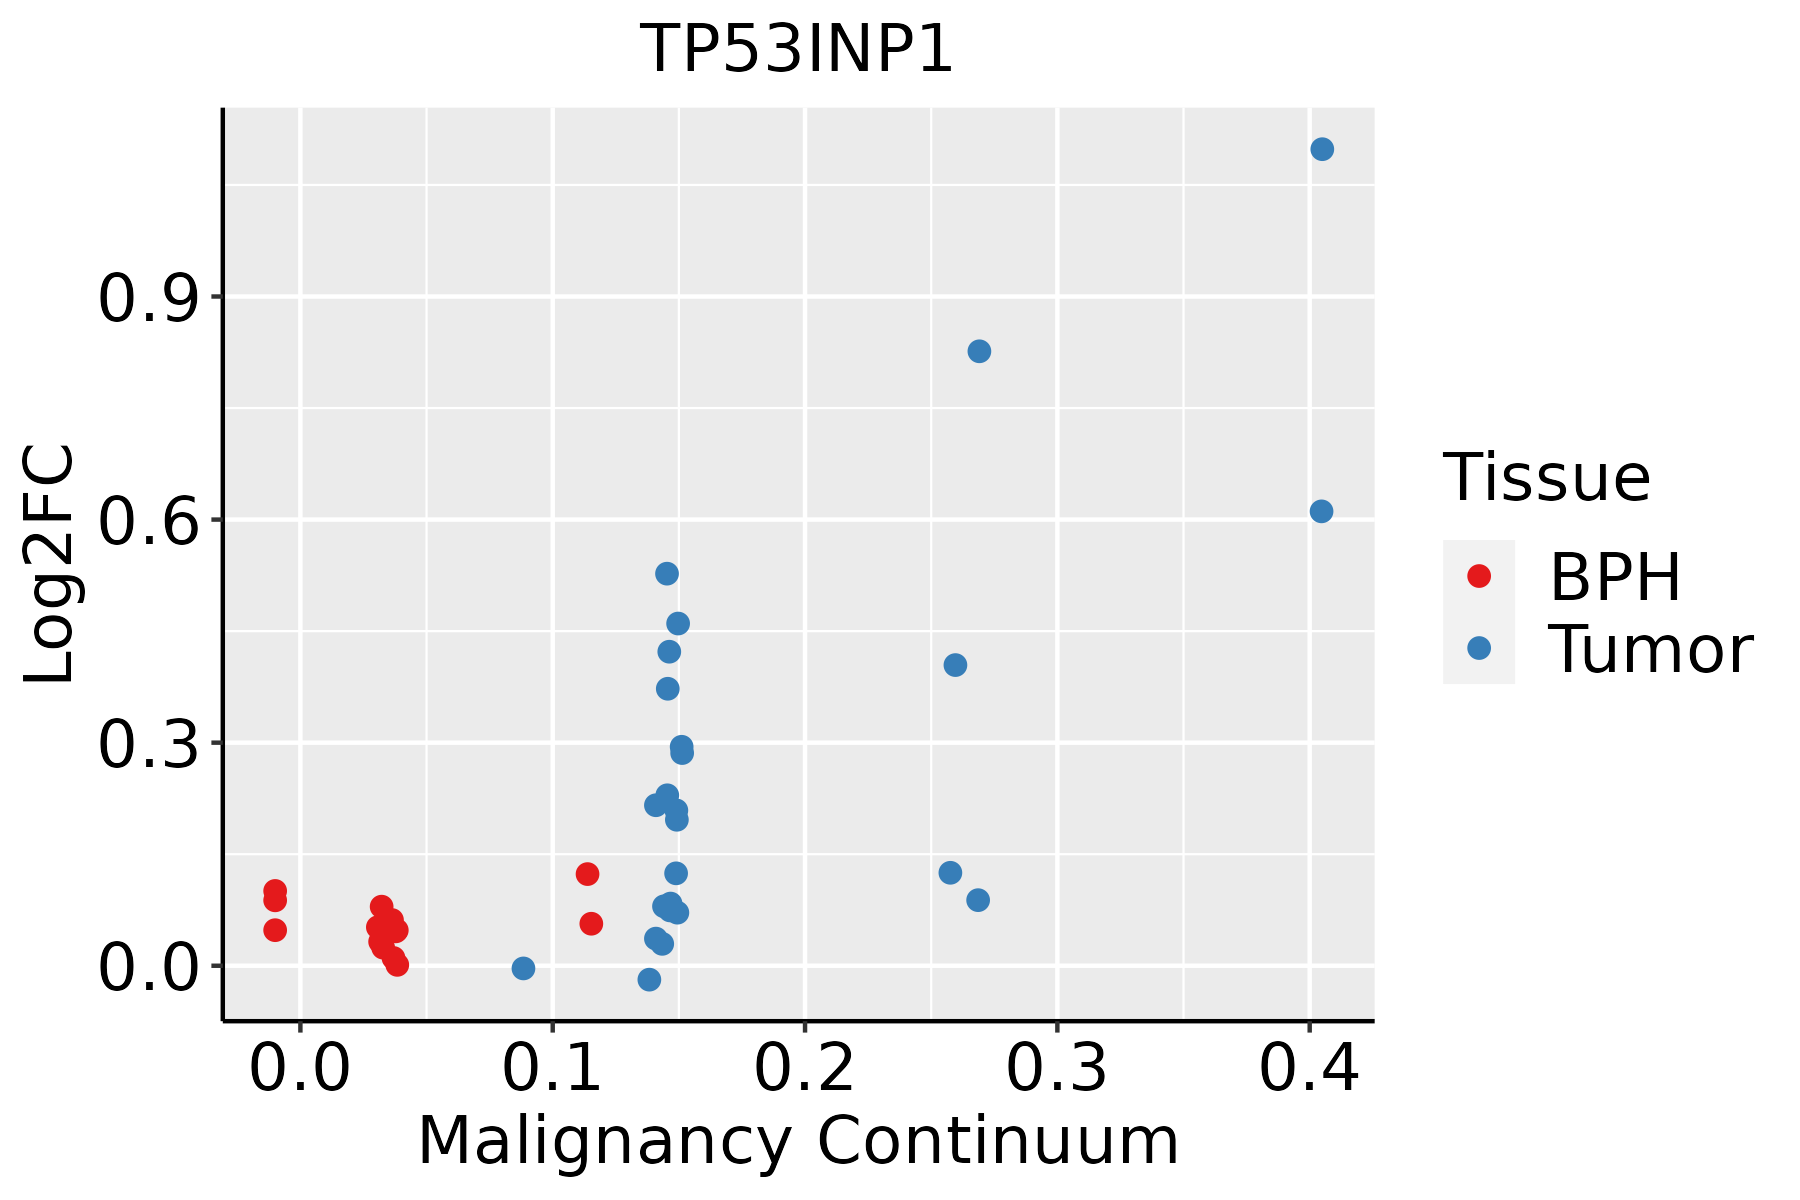 | BPH: Benign Prostatic Hyperplasia |
| Thyroid |  | ATC: Anaplastic thyroid cancer |
| HT: Hashimoto's thyroiditis | ||
| PTC: Papillary thyroid cancer |
| ∗log2FC in expression of this searched gene in stem-like cells from each diseased tissue sample relative to stem-like cells in normal samples in each tissue plotted against the malignancy continuum. Samples are colored based on if they are from different disease stage. |
Top |
Malignant transformation related pathway analysis |
| Find out the enriched GO biological processes and KEGG pathways involved in transition from healthy to precancer to cancer |
| Tissue | Disease Stage | Enriched GO biological Processes |
| Colorectum | AD |  |
| Colorectum | SER |  |
| Colorectum | MSS |  |
| Colorectum | MSI-H |  |
| Colorectum | FAP |  |
| ∗Top 15 enriched GO BP terms are showed in the bar plot of each disease state in each tissue. Each row represents a significant GO biological process which is colored according to the -log10(p.adjust). |
| Page: 1 2 3 4 5 6 7 8 9 |
| GO ID | Tissue | Disease Stage | Description | Gene Ratio | Bg Ratio | pvalue | p.adjust | Count |
| GO:001623617 | Esophagus | ESCC | macroautophagy | 216/8552 | 291/18723 | 1.94e-23 | 4.57e-21 | 216 |
| GO:0009896111 | Esophagus | ESCC | positive regulation of catabolic process | 332/8552 | 492/18723 | 4.36e-23 | 9.22e-21 | 332 |
| GO:0006979111 | Esophagus | ESCC | response to oxidative stress | 303/8552 | 446/18723 | 7.15e-22 | 1.30e-19 | 303 |
| GO:0031331111 | Esophagus | ESCC | positive regulation of cellular catabolic process | 292/8552 | 427/18723 | 8.67e-22 | 1.53e-19 | 292 |
| GO:0062197111 | Esophagus | ESCC | cellular response to chemical stress | 234/8552 | 337/18723 | 5.37e-19 | 5.97e-17 | 234 |
| GO:001050617 | Esophagus | ESCC | regulation of autophagy | 220/8552 | 317/18723 | 6.72e-18 | 6.36e-16 | 220 |
| GO:000941113 | Esophagus | ESCC | response to UV | 115/8552 | 149/18723 | 3.29e-15 | 1.93e-13 | 115 |
| GO:0034599111 | Esophagus | ESCC | cellular response to oxidative stress | 197/8552 | 288/18723 | 3.76e-15 | 2.15e-13 | 197 |
| GO:000703314 | Esophagus | ESCC | vacuole organization | 127/8552 | 180/18723 | 1.04e-11 | 3.85e-10 | 127 |
| GO:000931419 | Esophagus | ESCC | response to radiation | 277/8552 | 456/18723 | 4.42e-11 | 1.43e-09 | 277 |
| GO:003464413 | Esophagus | ESCC | cellular response to UV | 70/8552 | 90/18723 | 4.59e-10 | 1.20e-08 | 70 |
| GO:007121419 | Esophagus | ESCC | cellular response to abiotic stimulus | 206/8552 | 331/18723 | 7.52e-10 | 1.88e-08 | 206 |
| GO:010400419 | Esophagus | ESCC | cellular response to environmental stimulus | 206/8552 | 331/18723 | 7.52e-10 | 1.88e-08 | 206 |
| GO:007147816 | Esophagus | ESCC | cellular response to radiation | 122/8552 | 186/18723 | 3.07e-08 | 5.73e-07 | 122 |
| GO:190503712 | Esophagus | ESCC | autophagosome organization | 73/8552 | 103/18723 | 1.88e-07 | 2.93e-06 | 73 |
| GO:0009408110 | Esophagus | ESCC | response to heat | 77/8552 | 110/18723 | 2.01e-07 | 3.11e-06 | 77 |
| GO:000004513 | Esophagus | ESCC | autophagosome assembly | 69/8552 | 99/18723 | 1.10e-06 | 1.38e-05 | 69 |
| GO:004814414 | Esophagus | ESCC | fibroblast proliferation | 57/8552 | 81/18723 | 5.83e-06 | 6.03e-05 | 57 |
| GO:001050816 | Esophagus | ESCC | positive regulation of autophagy | 81/8552 | 124/18723 | 7.74e-06 | 7.65e-05 | 81 |
| GO:004814514 | Esophagus | ESCC | regulation of fibroblast proliferation | 56/8552 | 80/18723 | 9.08e-06 | 8.71e-05 | 56 |
| Page: 1 2 3 4 5 6 7 8 9 10 11 12 |
| Pathway ID | Tissue | Disease Stage | Description | Gene Ratio | Bg Ratio | pvalue | p.adjust | qvalue | Count |
| Page: 1 |
Top |
Cell-cell communication analysis |
| Identification of potential cell-cell interactions between two cell types and their ligand-receptor pairs for different disease states |
| Ligand | Receptor | LRpair | Pathway | Tissue | Disease Stage |
| Page: 1 |
Top |
Single-cell gene regulatory network inference analysis |
| Find out the significant the regulons (TFs) and the target genes of each regulon across cell types for different disease states |
| TF | Cell Type | Tissue | Disease Stage | Target Gene | RSS | Regulon Activity |
| ∗The dot plots of a searched regulon are shown for all cell subpopulations in each disease state of each tissue based on the regulon specific score inferred using pySCENIC and by calculating the average expression. |
| Page: 1 |
Top |
Somatic mutation of malignant transformation related genes |
| Annotation of somatic variants for genes involved in malignant transformation |
| Hugo Symbol | Variant Class | Variant Classification | dbSNP RS | HGVSc | HGVSp | HGVSp Short | SWISSPROT | BIOTYPE | SIFT | PolyPhen | Tumor Sample Barcode | Tissue | Histology | Sex | Age | Stage | Therapy Types | Drugs | Outcome |
| TP53INP1 | SNV | Missense_Mutation | rs866529450 | c.632N>A | p.Arg211His | p.R211H | Q96A56 | protein_coding | deleterious(0) | benign(0.147) | TCGA-AA-3947-01 | Colorectum | colon adenocarcinoma | Female | <65 | I/II | Unknown | Unknown | SD |
| TP53INP1 | SNV | Missense_Mutation | novel | c.190N>C | p.Ser64Pro | p.S64P | Q96A56 | protein_coding | tolerated(1) | benign(0) | TCGA-AA-A02J-01 | Colorectum | colon adenocarcinoma | Female | >=65 | III/IV | Unknown | Unknown | PD |
| TP53INP1 | SNV | Missense_Mutation | novel | c.139N>A | p.Glu47Lys | p.E47K | Q96A56 | protein_coding | tolerated(0.09) | benign(0.009) | TCGA-AZ-4315-01 | Colorectum | colon adenocarcinoma | Male | <65 | I/II | Unknown | Unknown | SD |
| TP53INP1 | SNV | Missense_Mutation | rs532052124 | c.437N>A | p.Arg146His | p.R146H | Q96A56 | protein_coding | tolerated(0.1) | benign(0.169) | TCGA-WS-AB45-01 | Colorectum | colon adenocarcinoma | Female | <65 | I/II | Unknown | Unknown | SD |
| TP53INP1 | insertion | Frame_Shift_Ins | novel | c.549_550insAT | p.Glu184MetfsTer13 | p.E184Mfs*13 | Q96A56 | protein_coding | TCGA-AM-5820-01 | Colorectum | colon adenocarcinoma | Female | <65 | I/II | Unknown | Unknown | SD | ||
| TP53INP1 | SNV | Missense_Mutation | novel | c.158N>G | p.Asp53Gly | p.D53G | Q96A56 | protein_coding | tolerated(0.51) | benign(0.003) | TCGA-AJ-A3EL-01 | Endometrium | uterine corpus endometrioid carcinoma | Female | <65 | I/II | Unknown | Unknown | SD |
| TP53INP1 | SNV | Missense_Mutation | rs753451554 | c.706N>T | p.Arg236Cys | p.R236C | Q96A56 | protein_coding | deleterious(0) | probably_damaging(0.963) | TCGA-AX-A06F-01 | Endometrium | uterine corpus endometrioid carcinoma | Female | <65 | III/IV | Chemotherapy | carboplatin | SD |
| TP53INP1 | SNV | Missense_Mutation | c.69C>A | p.Phe23Leu | p.F23L | Q96A56 | protein_coding | tolerated(0.3) | benign(0.122) | TCGA-AX-A0J0-01 | Endometrium | uterine corpus endometrioid carcinoma | Female | <65 | I/II | Unknown | Unknown | SD | |
| TP53INP1 | SNV | Missense_Mutation | novel | c.431N>T | p.Ala144Val | p.A144V | Q96A56 | protein_coding | tolerated(0.13) | benign(0.306) | TCGA-AX-A1CE-01 | Endometrium | uterine corpus endometrioid carcinoma | Female | <65 | I/II | Unspecific | Paclitaxel | SD |
| TP53INP1 | SNV | Missense_Mutation | novel | c.20N>C | p.Lys7Thr | p.K7T | Q96A56 | protein_coding | tolerated(0.09) | benign(0.085) | TCGA-B5-A3FA-01 | Endometrium | uterine corpus endometrioid carcinoma | Female | >=65 | I/II | Unknown | Unknown | SD |
| Page: 1 2 3 |
Top |
Related drugs of malignant transformation related genes |
| Identification of chemicals and drugs interact with genes involved in malignant transfromation |
| (DGIdb 4.0) |
| Entrez ID | Symbol | Category | Interaction Types | Drug Claim Name | Drug Name | PMIDs |
| Page: 1 |

Copyright 2023-Present -The University of Texas Health Science Center at Houston |