
|
|||||
|
 | |
| |
| |
| |
| |
| |
|
Gene: SMIM10 |
Gene summary for SMIM10 |
| Gene information | Species | Human | Gene symbol | SMIM10 | Gene ID | 644538 |
| Gene name | small integral membrane protein 10 | |
| Gene Alias | CXorf69 | |
| Cytomap | Xq26.3 | |
| Gene Type | protein-coding | GO ID | GO:0005575 | UniProtAcc | P0DMW3 |
Top |
Malignant transformation analysis |
| Identification of the aberrant gene expression in precancerous and cancerous lesions by comparing the gene expression of stem-like cells in diseased tissues with normal stem cells |
| Entrez ID | Symbol | Replicates | Species | Organ | Tissue | Adj P-value | Log2FC | Malignancy |
| 644538 | SMIM10 | ATC13 | Human | Thyroid | ATC | 2.32e-20 | 5.34e-01 | 0.34 |
| 644538 | SMIM10 | ATC2 | Human | Thyroid | ATC | 5.21e-08 | 8.98e-01 | 0.34 |
| 644538 | SMIM10 | ATC5 | Human | Thyroid | ATC | 6.28e-28 | 6.04e-01 | 0.34 |
| Page: 1 |
| Tissue | Expression Dynamics | Abbreviation |
| Thyroid | 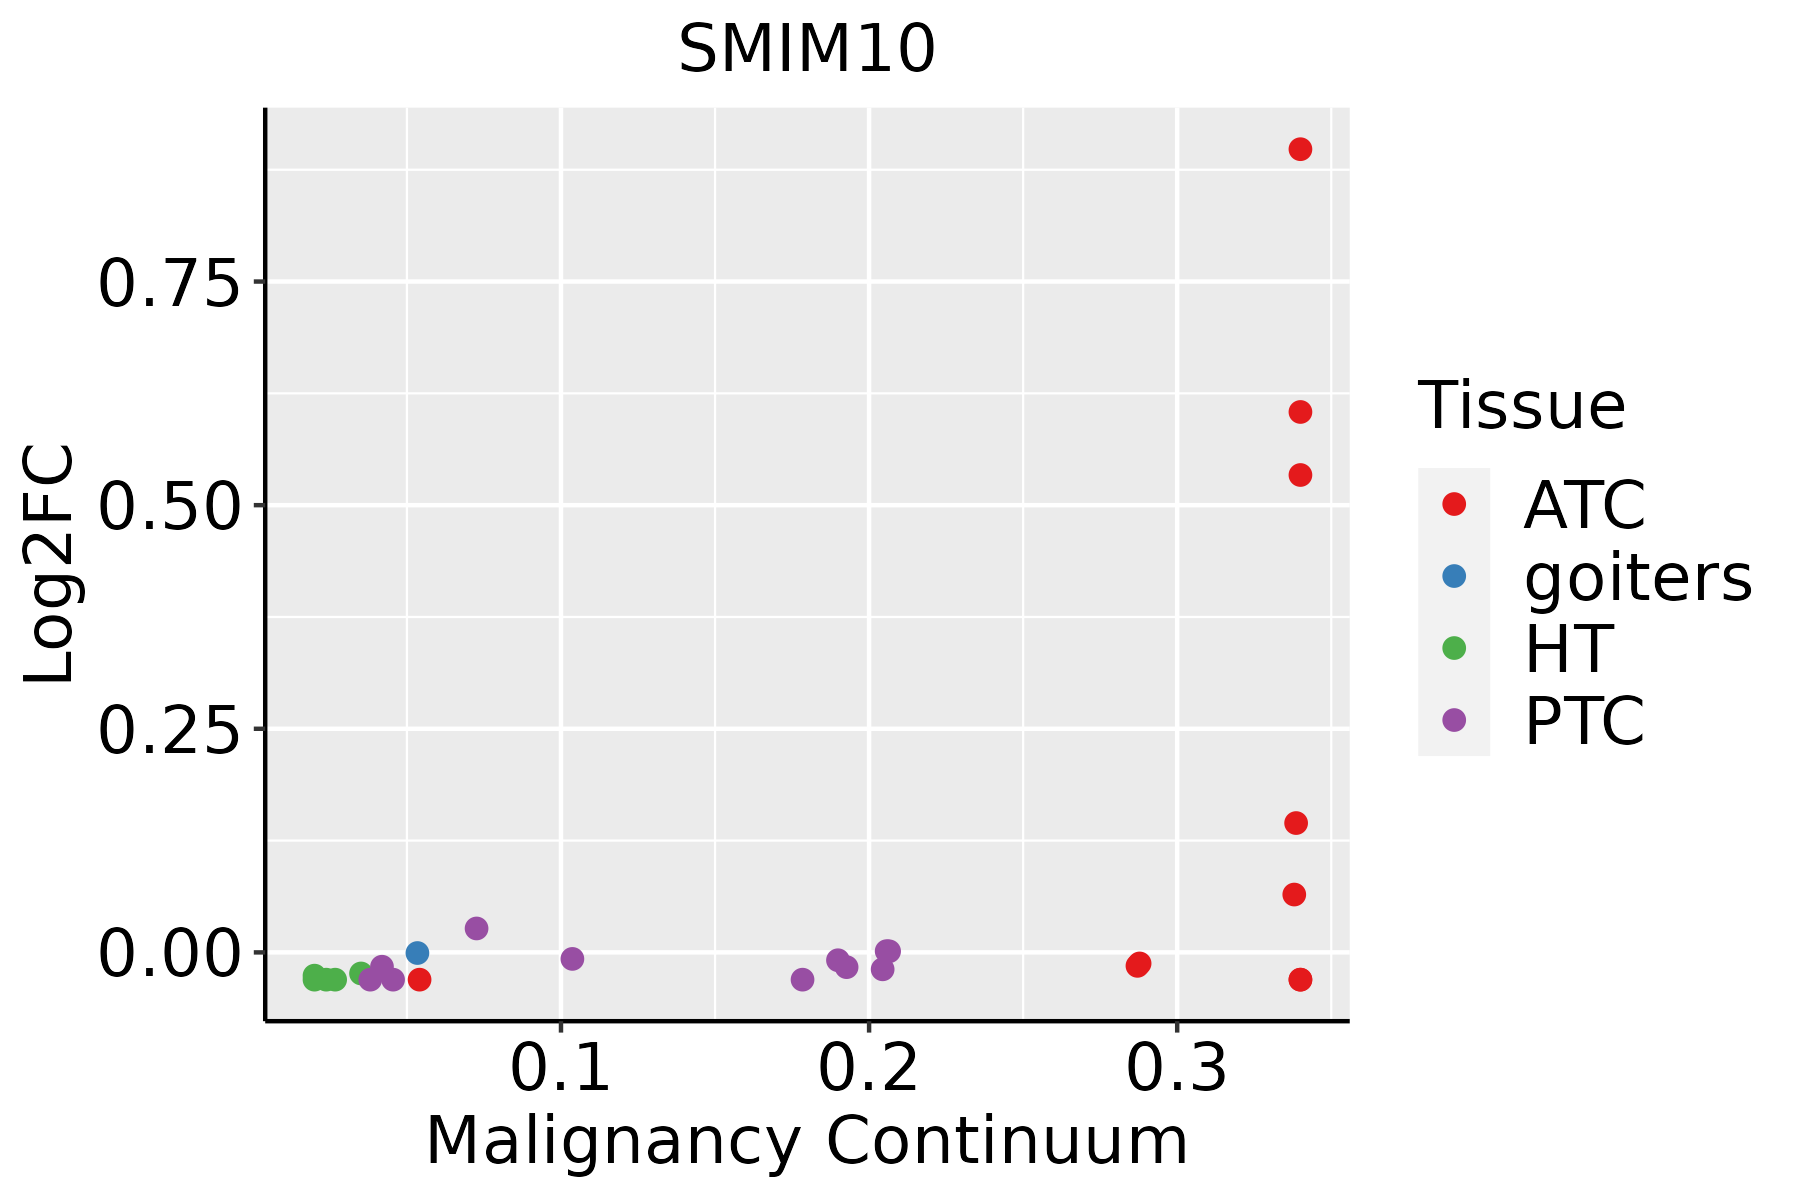 | ATC: Anaplastic thyroid cancer |
| HT: Hashimoto's thyroiditis | ||
| PTC: Papillary thyroid cancer |
| ∗log2FC in expression of this searched gene in stem-like cells from each diseased tissue sample relative to stem-like cells in normal samples in each tissue plotted against the malignancy continuum. Samples are colored based on if they are from different disease stage. |
Top |
Malignant transformation related pathway analysis |
| Find out the enriched GO biological processes and KEGG pathways involved in transition from healthy to precancer to cancer |
| Tissue | Disease Stage | Enriched GO biological Processes |
| Colorectum | AD |  |
| Colorectum | SER |  |
| Colorectum | MSS |  |
| Colorectum | MSI-H |  |
| Colorectum | FAP |  |
| ∗Top 15 enriched GO BP terms are showed in the bar plot of each disease state in each tissue. Each row represents a significant GO biological process which is colored according to the -log10(p.adjust). |
| Page: 1 2 3 4 5 6 7 8 9 |
| GO ID | Tissue | Disease Stage | Description | Gene Ratio | Bg Ratio | pvalue | p.adjust | Count |
| Page: 1 |
| Pathway ID | Tissue | Disease Stage | Description | Gene Ratio | Bg Ratio | pvalue | p.adjust | qvalue | Count |
| Page: 1 |
Top |
Cell-cell communication analysis |
| Identification of potential cell-cell interactions between two cell types and their ligand-receptor pairs for different disease states |
| Ligand | Receptor | LRpair | Pathway | Tissue | Disease Stage |
| Page: 1 |
Top |
Single-cell gene regulatory network inference analysis |
| Find out the significant the regulons (TFs) and the target genes of each regulon across cell types for different disease states |
| TF | Cell Type | Tissue | Disease Stage | Target Gene | RSS | Regulon Activity |
| ∗The dot plots of a searched regulon are shown for all cell subpopulations in each disease state of each tissue based on the regulon specific score inferred using pySCENIC and by calculating the average expression. |
| Page: 1 |
Top |
Somatic mutation of malignant transformation related genes |
| Annotation of somatic variants for genes involved in malignant transformation |
| Hugo Symbol | Variant Class | Variant Classification | dbSNP RS | HGVSc | HGVSp | HGVSp Short | SWISSPROT | BIOTYPE | SIFT | PolyPhen | Tumor Sample Barcode | Tissue | Histology | Sex | Age | Stage | Therapy Types | Drugs | Outcome |
| SMIM10 | SNV | Missense_Mutation | c.192N>A | p.Phe64Leu | p.F64L | Q96HG1,P0DMW3 | protein_coding | deleterious(0.01) | probably_damaging(0.979) | TCGA-EO-A3B0-01 | Endometrium | uterine corpus endometrioid carcinoma | Female | <65 | III/IV | Unknown | Unknown | SD | |
| SMIM10 | SNV | Missense_Mutation | novel | c.113N>A | p.Ser38Tyr | p.S38Y | Q96HG1,P0DMW3 | protein_coding | deleterious(0) | probably_damaging(0.996) | TCGA-EY-A1G8-01 | Endometrium | uterine corpus endometrioid carcinoma | Female | >=65 | I/II | Unknown | Unknown | SD |
| SMIM10 | SNV | Missense_Mutation | c.186G>C | p.Lys62Asn | p.K62N | Q96HG1,P0DMW3 | protein_coding | deleterious(0.02) | benign(0.007) | TCGA-2Y-A9GU-01 | Liver | liver hepatocellular carcinoma | Female | <65 | I/II | Unknown | Unknown | SD | |
| SMIM10 | SNV | Missense_Mutation | novel | c.91N>A | p.Arg31Ser | p.R31S | Q96HG1,P0DMW3 | protein_coding | tolerated(0.35) | benign(0.089) | TCGA-ZP-A9CV-01 | Liver | liver hepatocellular carcinoma | Male | <65 | I/II | Unknown | Unknown | PD |
| Page: 1 2 |
Top |
Related drugs of malignant transformation related genes |
| Identification of chemicals and drugs interact with genes involved in malignant transfromation |
| (DGIdb 4.0) |
| Entrez ID | Symbol | Category | Interaction Types | Drug Claim Name | Drug Name | PMIDs |
| Page: 1 |

Copyright 2023-Present -The University of Texas Health Science Center at Houston |