
|
|||||
|
 | |
| |
| |
| |
| |
| |
|
Gene: SLC9A3R1 |
Gene summary for SLC9A3R1 |
| Gene information | Species | Human | Gene symbol | SLC9A3R1 | Gene ID | 9368 |
| Gene name | SLC9A3 regulator 1 | |
| Gene Alias | EBP50 | |
| Cytomap | 17q25.1 | |
| Gene Type | protein-coding | GO ID | GO:0000165 | UniProtAcc | O14745 |
Top |
Malignant transformation analysis |
| Identification of the aberrant gene expression in precancerous and cancerous lesions by comparing the gene expression of stem-like cells in diseased tissues with normal stem cells |
| Entrez ID | Symbol | Replicates | Species | Organ | Tissue | Adj P-value | Log2FC | Malignancy |
| 9368 | SLC9A3R1 | GSM4909282 | Human | Breast | IDC | 1.16e-07 | 3.63e-01 | -0.0288 |
| 9368 | SLC9A3R1 | GSM4909285 | Human | Breast | IDC | 6.64e-31 | 7.57e-01 | 0.21 |
| 9368 | SLC9A3R1 | GSM4909289 | Human | Breast | IDC | 4.92e-10 | 7.29e-01 | 0.1064 |
| 9368 | SLC9A3R1 | GSM4909290 | Human | Breast | IDC | 1.27e-03 | 2.68e-01 | 0.2096 |
| 9368 | SLC9A3R1 | GSM4909291 | Human | Breast | IDC | 1.78e-44 | 9.91e-01 | 0.1753 |
| 9368 | SLC9A3R1 | GSM4909293 | Human | Breast | IDC | 7.24e-56 | 9.35e-01 | 0.1581 |
| 9368 | SLC9A3R1 | GSM4909296 | Human | Breast | IDC | 6.01e-04 | 2.16e-02 | 0.1524 |
| 9368 | SLC9A3R1 | GSM4909297 | Human | Breast | IDC | 1.17e-03 | 9.41e-03 | 0.1517 |
| 9368 | SLC9A3R1 | GSM4909298 | Human | Breast | IDC | 7.99e-03 | 2.92e-01 | 0.1551 |
| 9368 | SLC9A3R1 | GSM4909301 | Human | Breast | IDC | 2.34e-24 | 6.60e-01 | 0.1577 |
| 9368 | SLC9A3R1 | GSM4909304 | Human | Breast | IDC | 4.70e-07 | 3.64e-01 | 0.1636 |
| 9368 | SLC9A3R1 | GSM4909305 | Human | Breast | IDC | 7.32e-08 | 3.71e-01 | 0.0436 |
| 9368 | SLC9A3R1 | GSM4909306 | Human | Breast | IDC | 1.19e-09 | 4.45e-01 | 0.1564 |
| 9368 | SLC9A3R1 | GSM4909307 | Human | Breast | IDC | 1.47e-06 | 3.81e-01 | 0.1569 |
| 9368 | SLC9A3R1 | GSM4909308 | Human | Breast | IDC | 4.25e-22 | 5.19e-01 | 0.158 |
| 9368 | SLC9A3R1 | GSM4909311 | Human | Breast | IDC | 1.53e-26 | 1.70e-01 | 0.1534 |
| 9368 | SLC9A3R1 | GSM4909312 | Human | Breast | IDC | 1.45e-20 | 4.45e-01 | 0.1552 |
| 9368 | SLC9A3R1 | GSM4909313 | Human | Breast | IDC | 1.38e-09 | 4.31e-01 | 0.0391 |
| 9368 | SLC9A3R1 | GSM4909317 | Human | Breast | IDC | 4.37e-47 | 9.13e-01 | 0.1355 |
| 9368 | SLC9A3R1 | GSM4909318 | Human | Breast | IDC | 1.28e-15 | 9.75e-01 | 0.2031 |
| Page: 1 2 3 4 5 6 7 8 9 10 |
| Tissue | Expression Dynamics | Abbreviation |
| Breast | 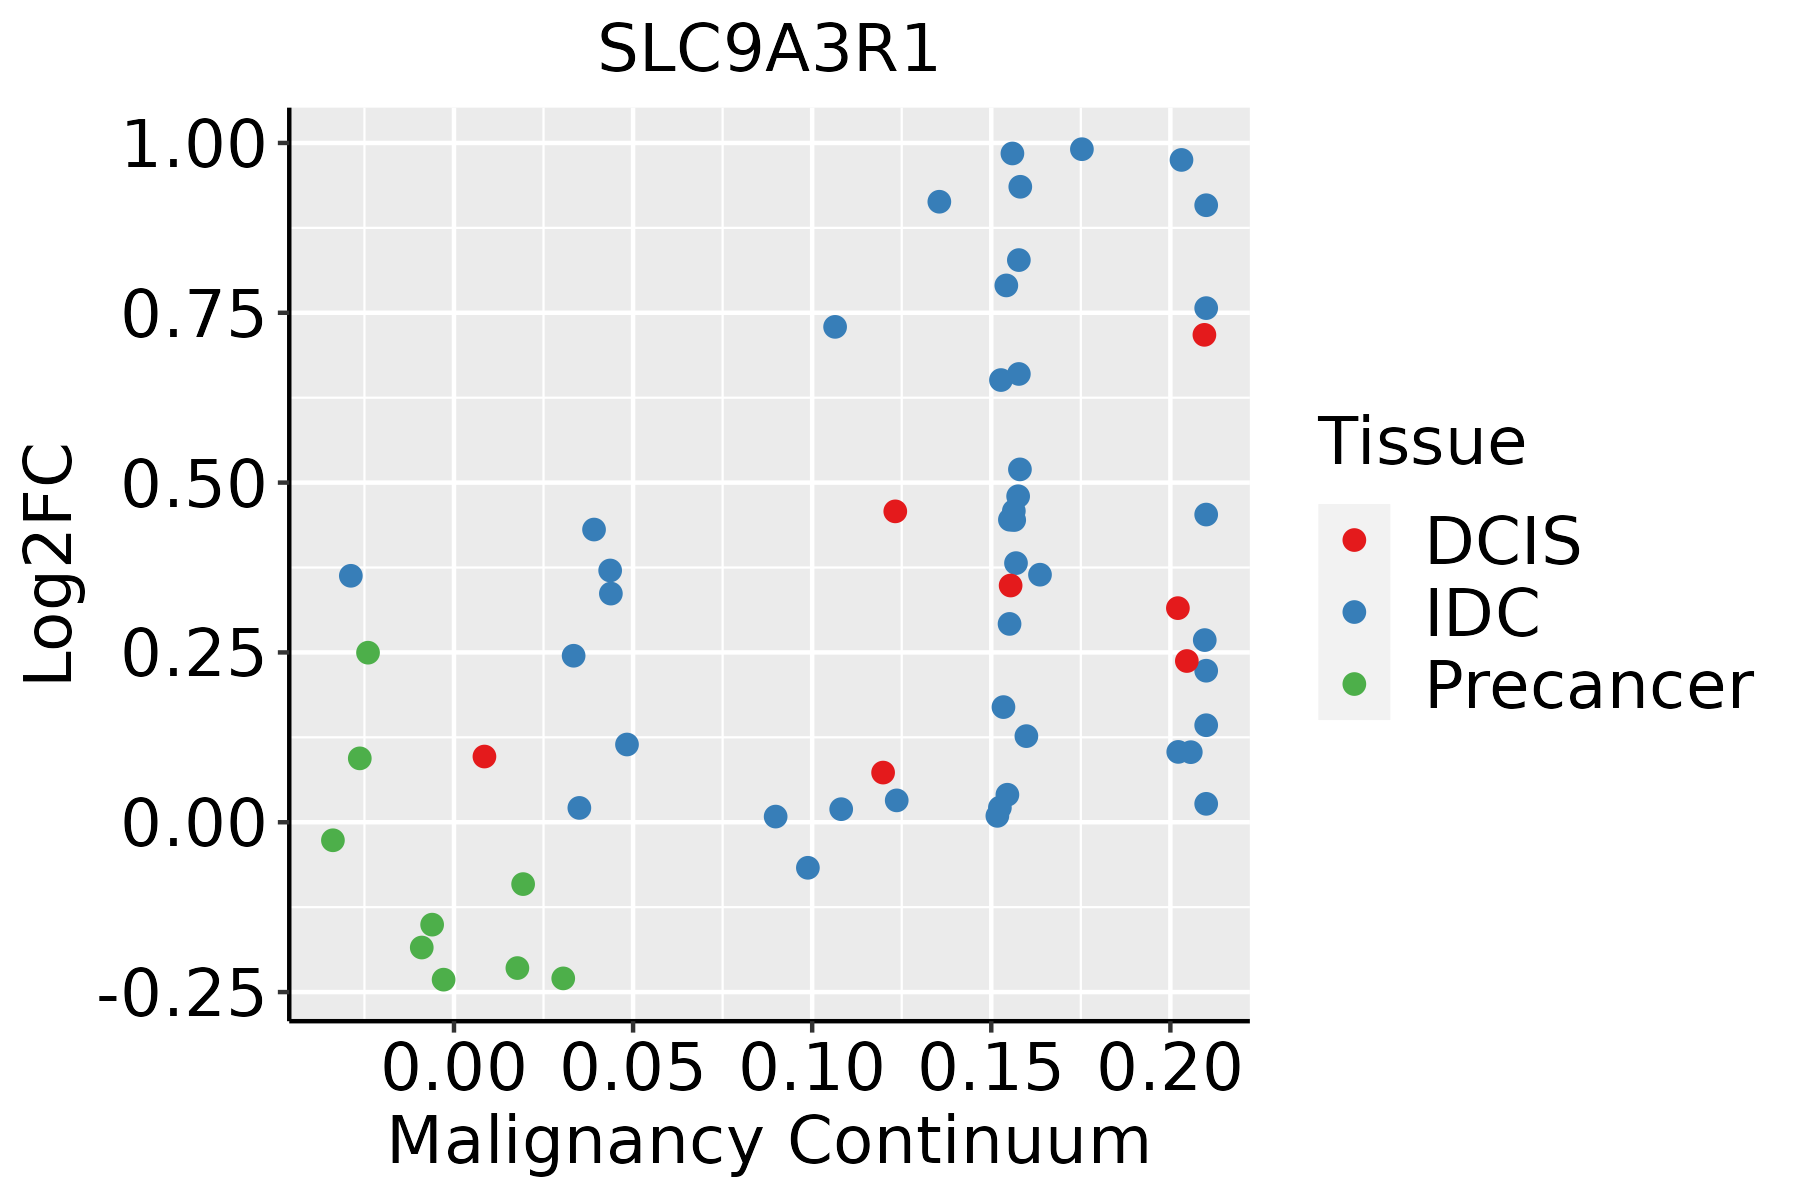 | IDC: Invasive ductal carcinoma |
| DCIS: Ductal carcinoma in situ | ||
| Precancer(BRCA1-mut): Precancerous lesion from BRCA1 mutation carriers | ||
| Colorectum (GSE201348) |  | FAP: Familial adenomatous polyposis |
| CRC: Colorectal cancer | ||
| Colorectum (HTA11) | 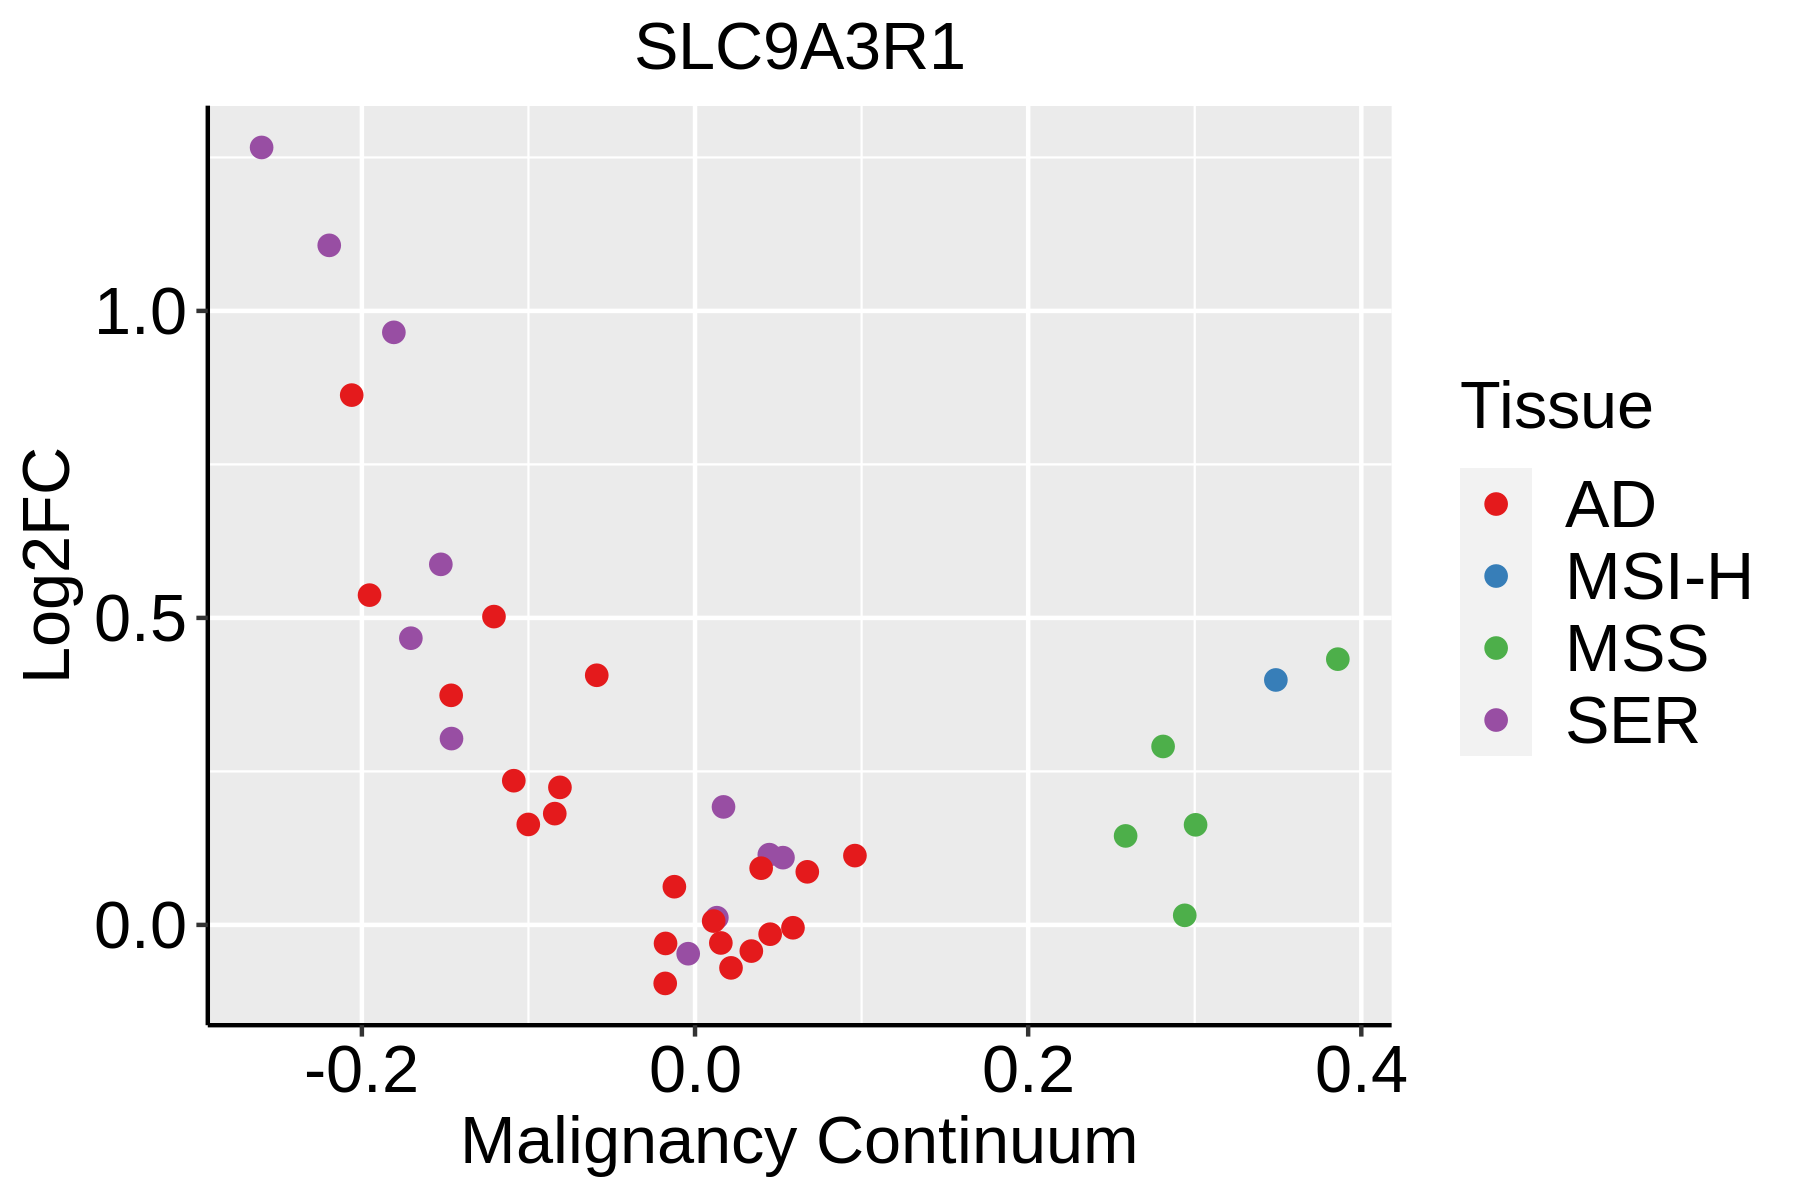 | AD: Adenomas |
| SER: Sessile serrated lesions | ||
| MSI-H: Microsatellite-high colorectal cancer | ||
| MSS: Microsatellite stable colorectal cancer | ||
| Esophagus | 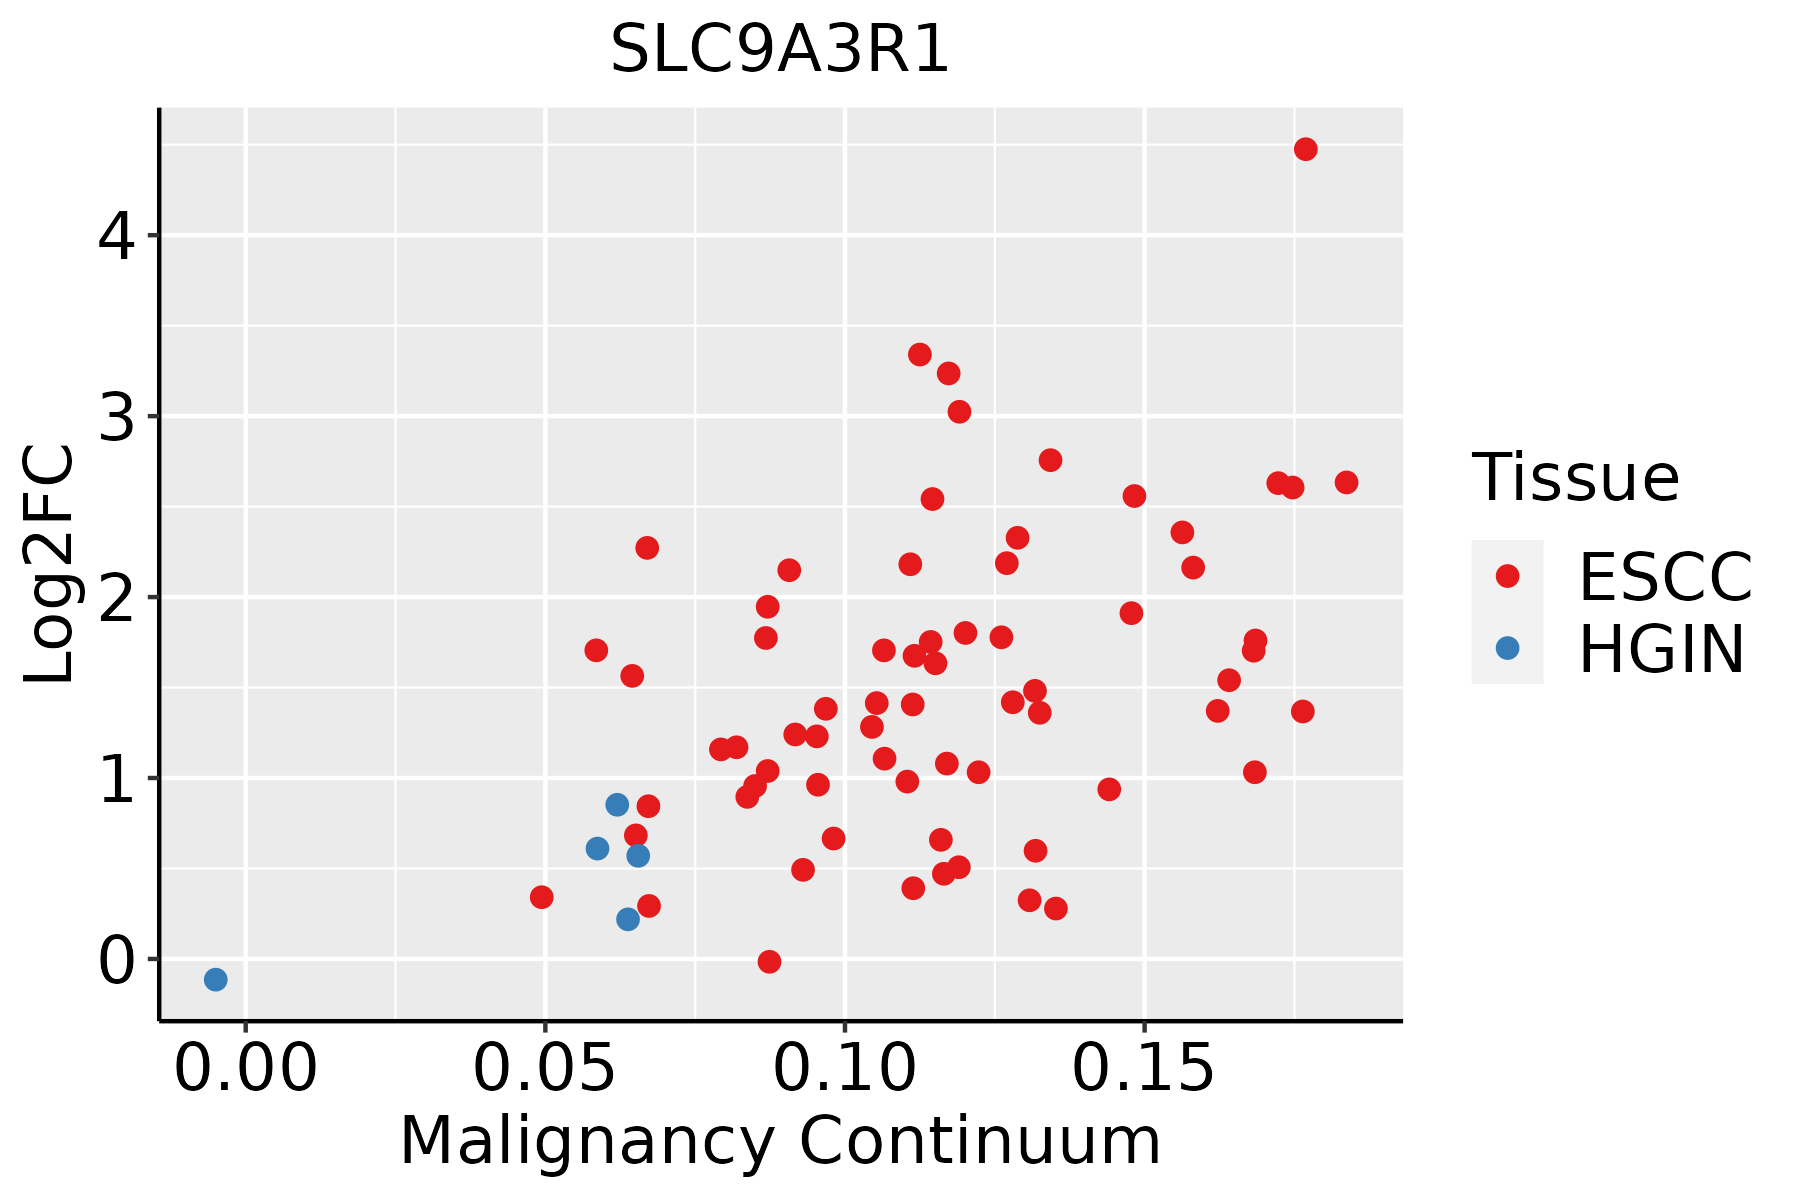 | ESCC: Esophageal squamous cell carcinoma |
| HGIN: High-grade intraepithelial neoplasias | ||
| LGIN: Low-grade intraepithelial neoplasias | ||
| GC | 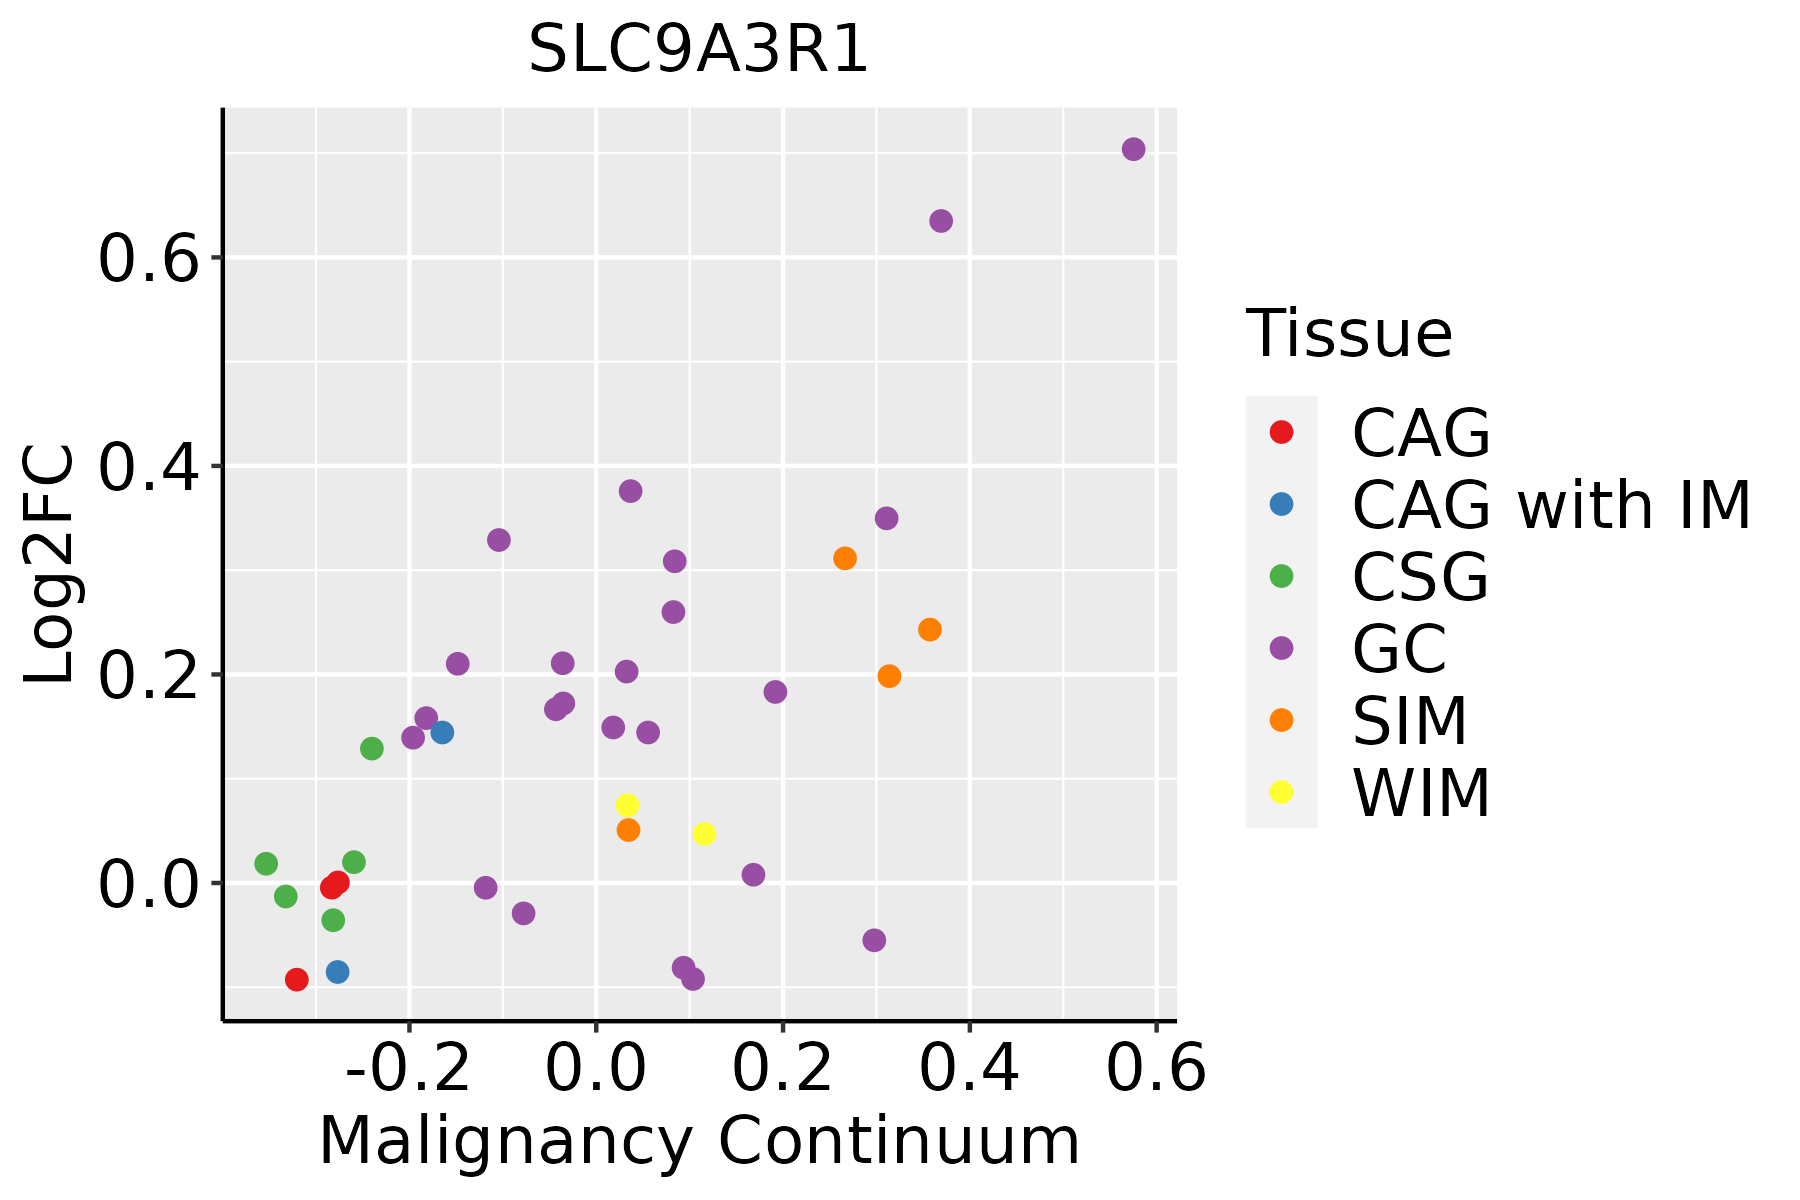 | CAG: Chronic atrophic gastritis |
| CAG with IM: Chronic atrophic gastritis with intestinal metaplasia | ||
| CSG: Chronic superficial gastritis | ||
| GC: Gastric cancer | ||
| SIM: Severe intestinal metaplasia | ||
| WIM: Wild intestinal metaplasia | ||
| Liver | 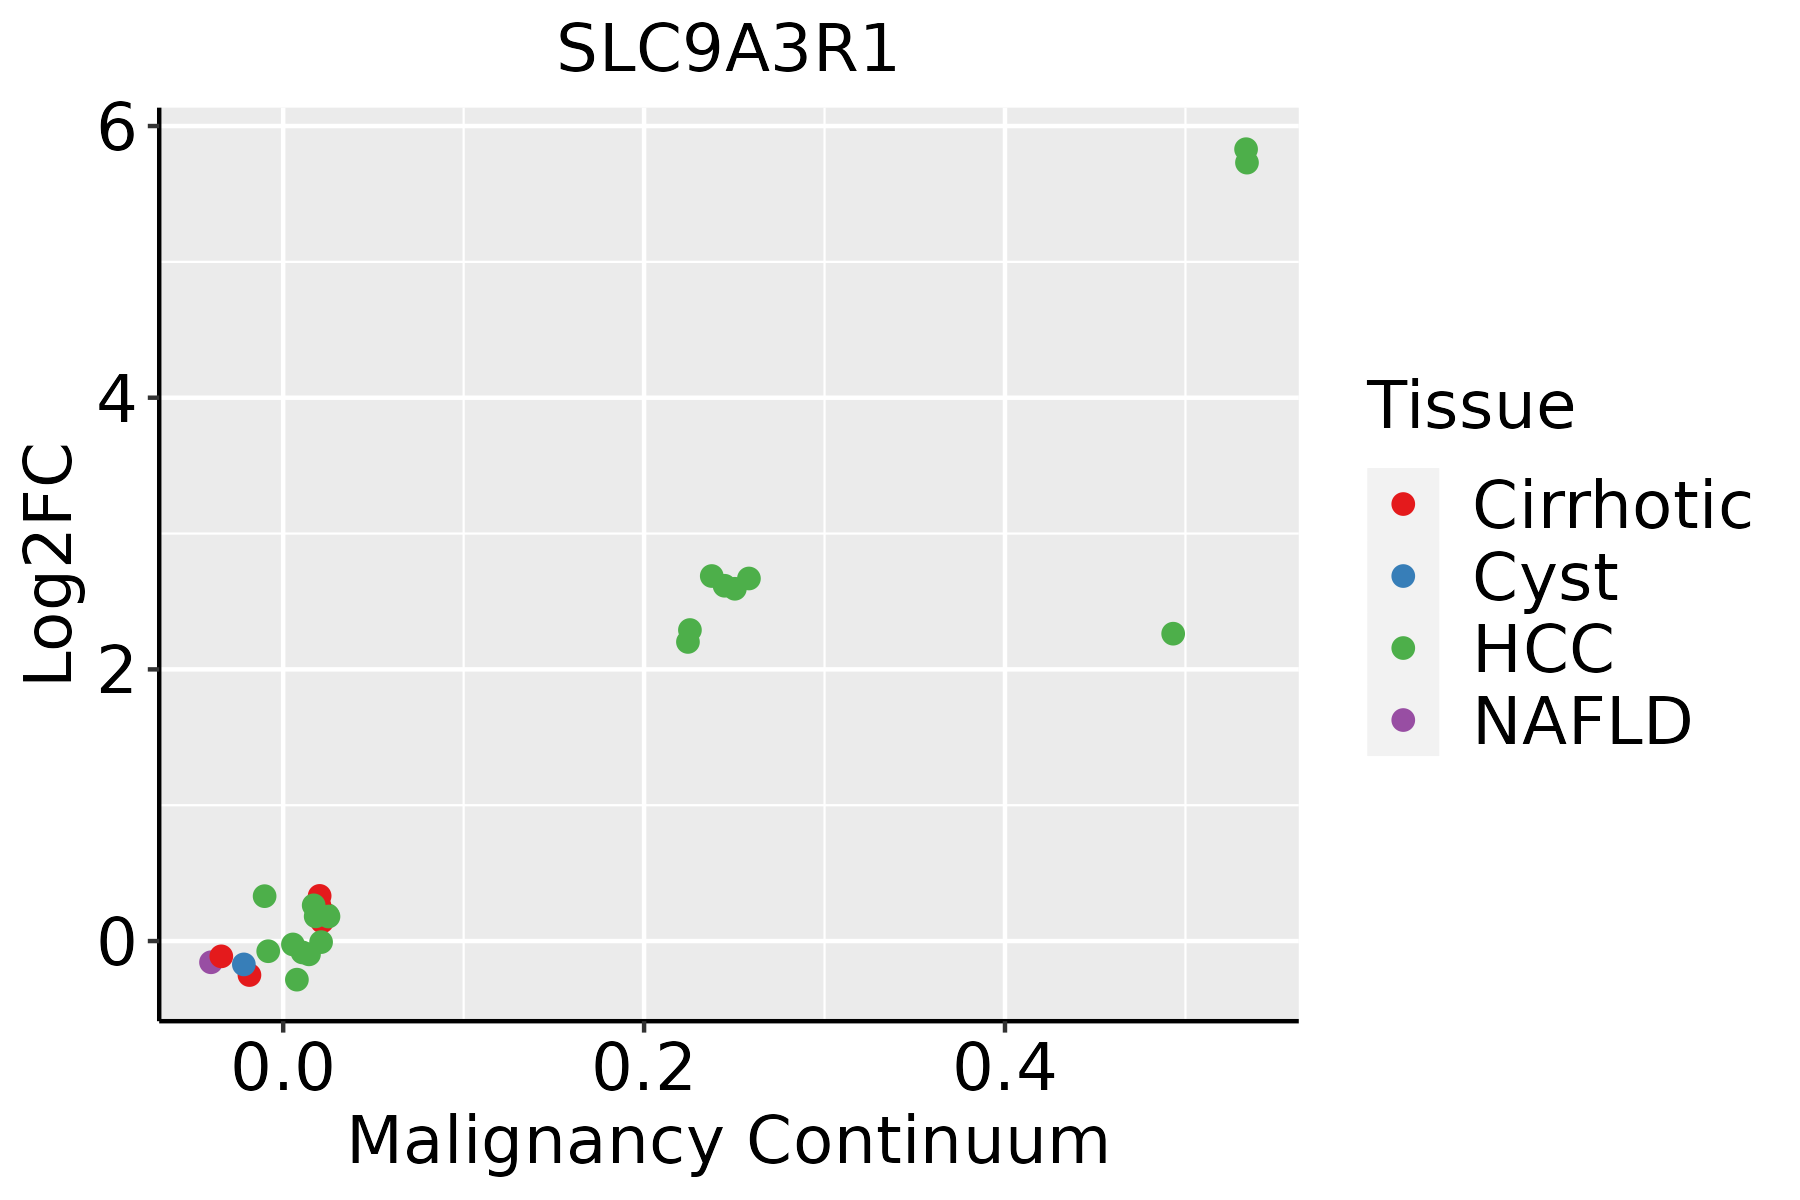 | HCC: Hepatocellular carcinoma |
| NAFLD: Non-alcoholic fatty liver disease | ||
| Oral Cavity | 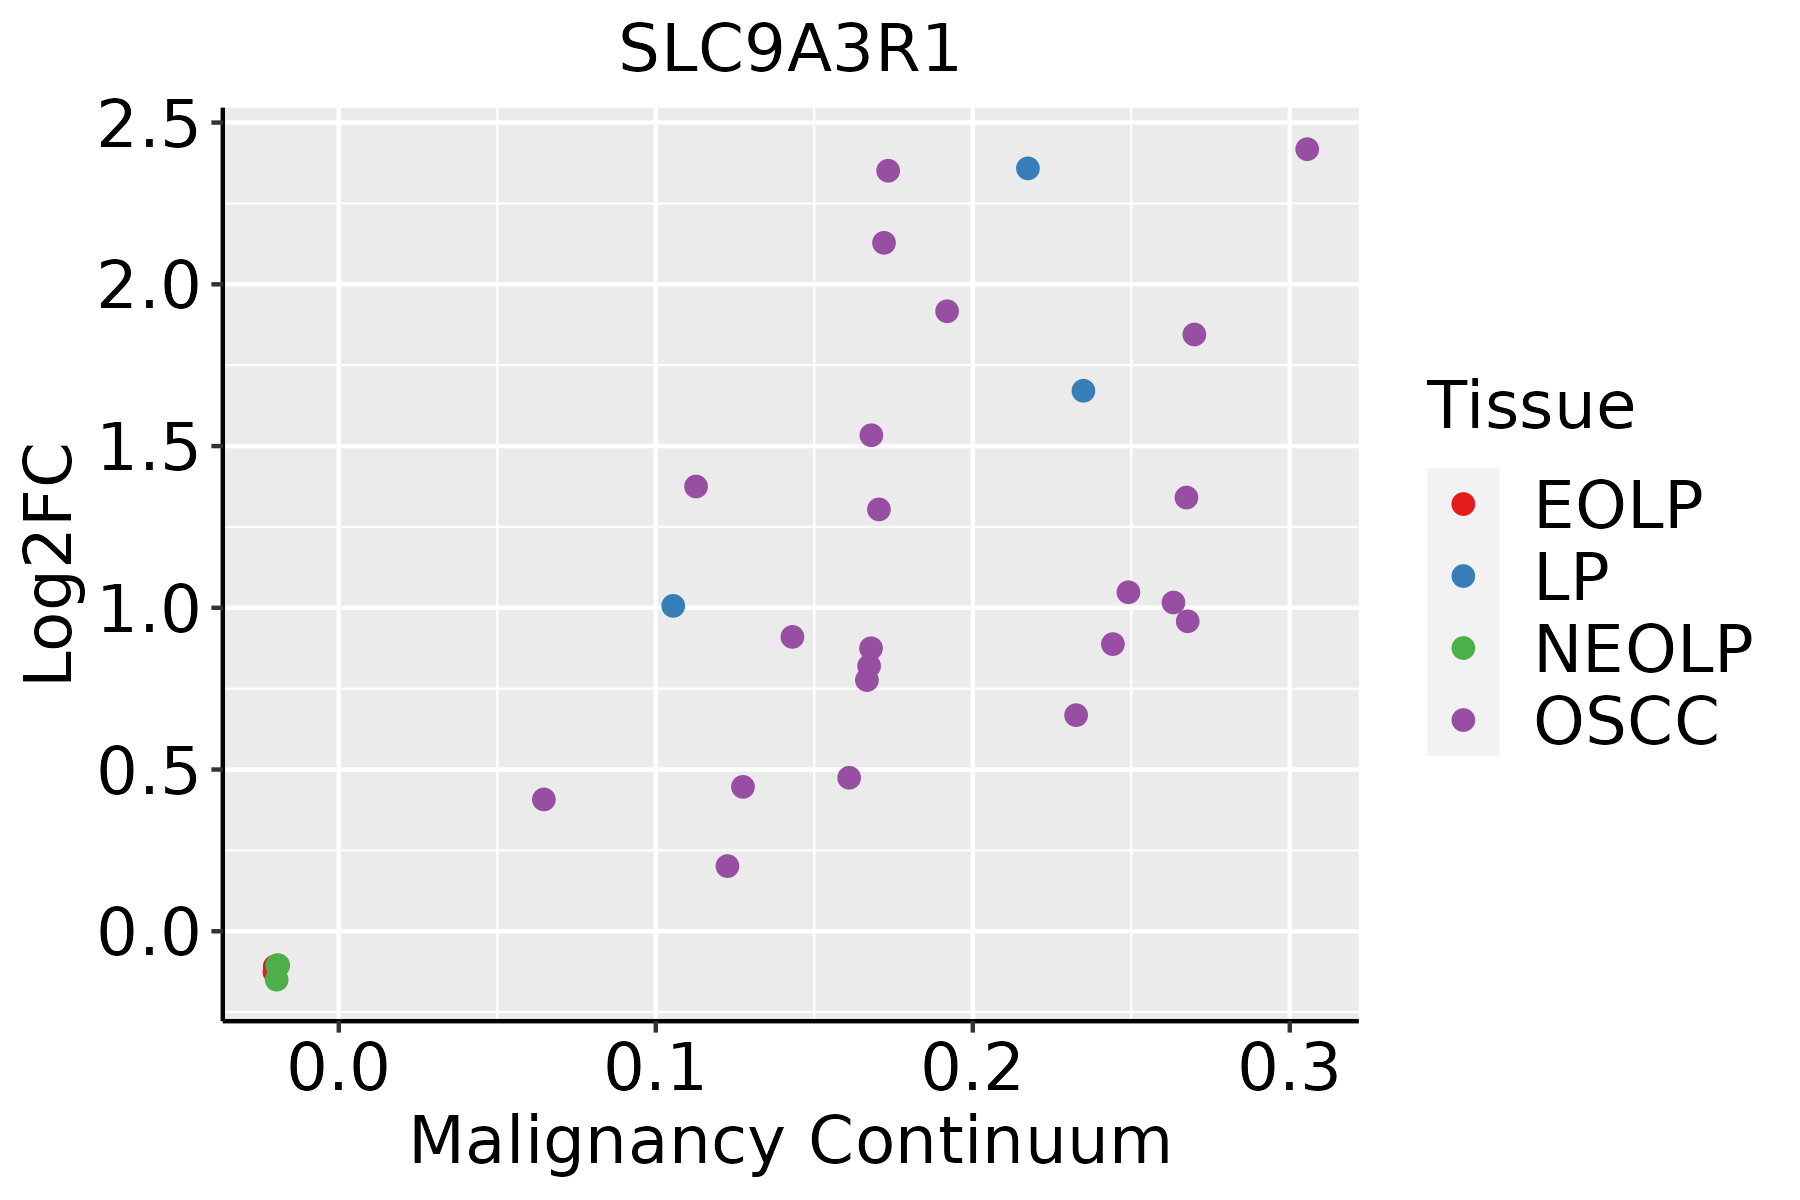 | EOLP: Erosive Oral lichen planus |
| LP: leukoplakia | ||
| NEOLP: Non-erosive oral lichen planus | ||
| OSCC: Oral squamous cell carcinoma | ||
| Prostate | 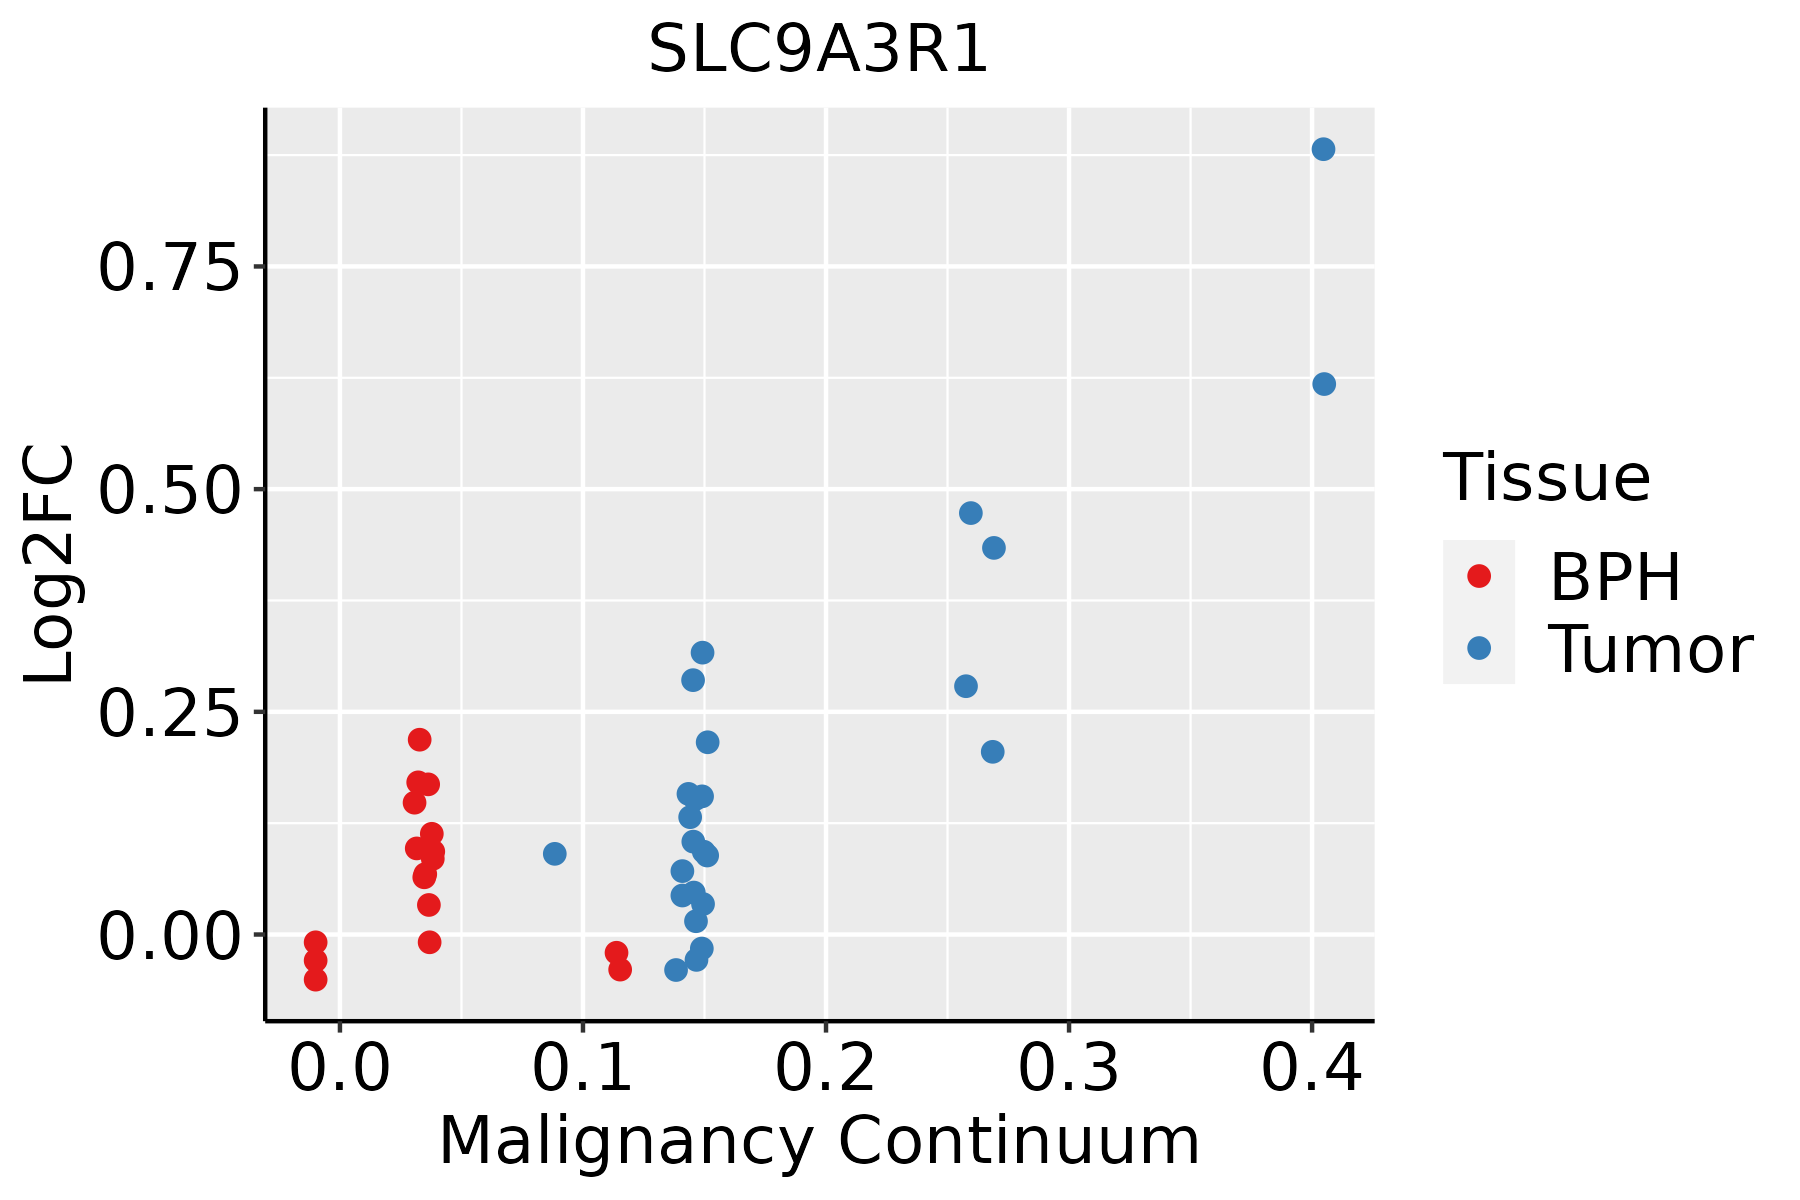 | BPH: Benign Prostatic Hyperplasia |
| Skin | 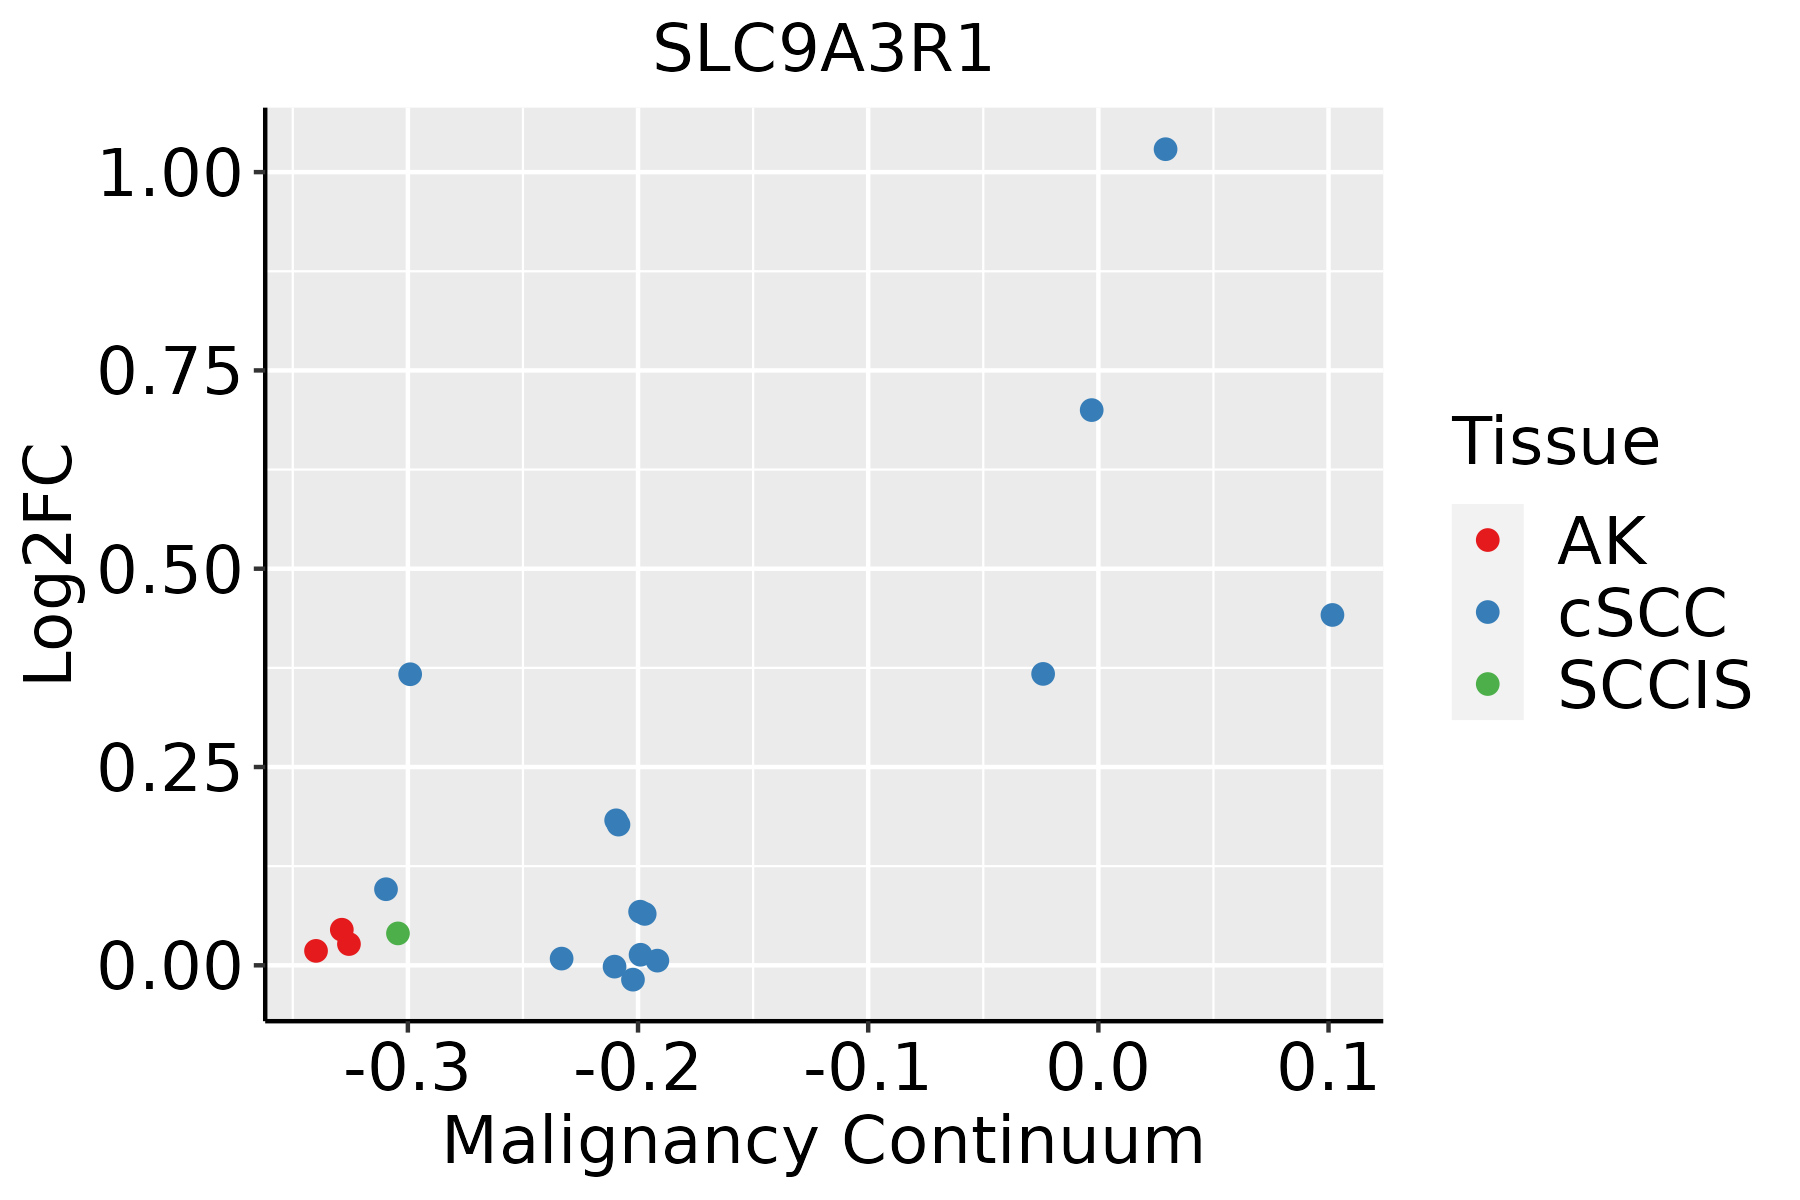 | AK: Actinic keratosis |
| cSCC: Cutaneous squamous cell carcinoma | ||
| SCCIS:squamous cell carcinoma in situ | ||
| Thyroid | 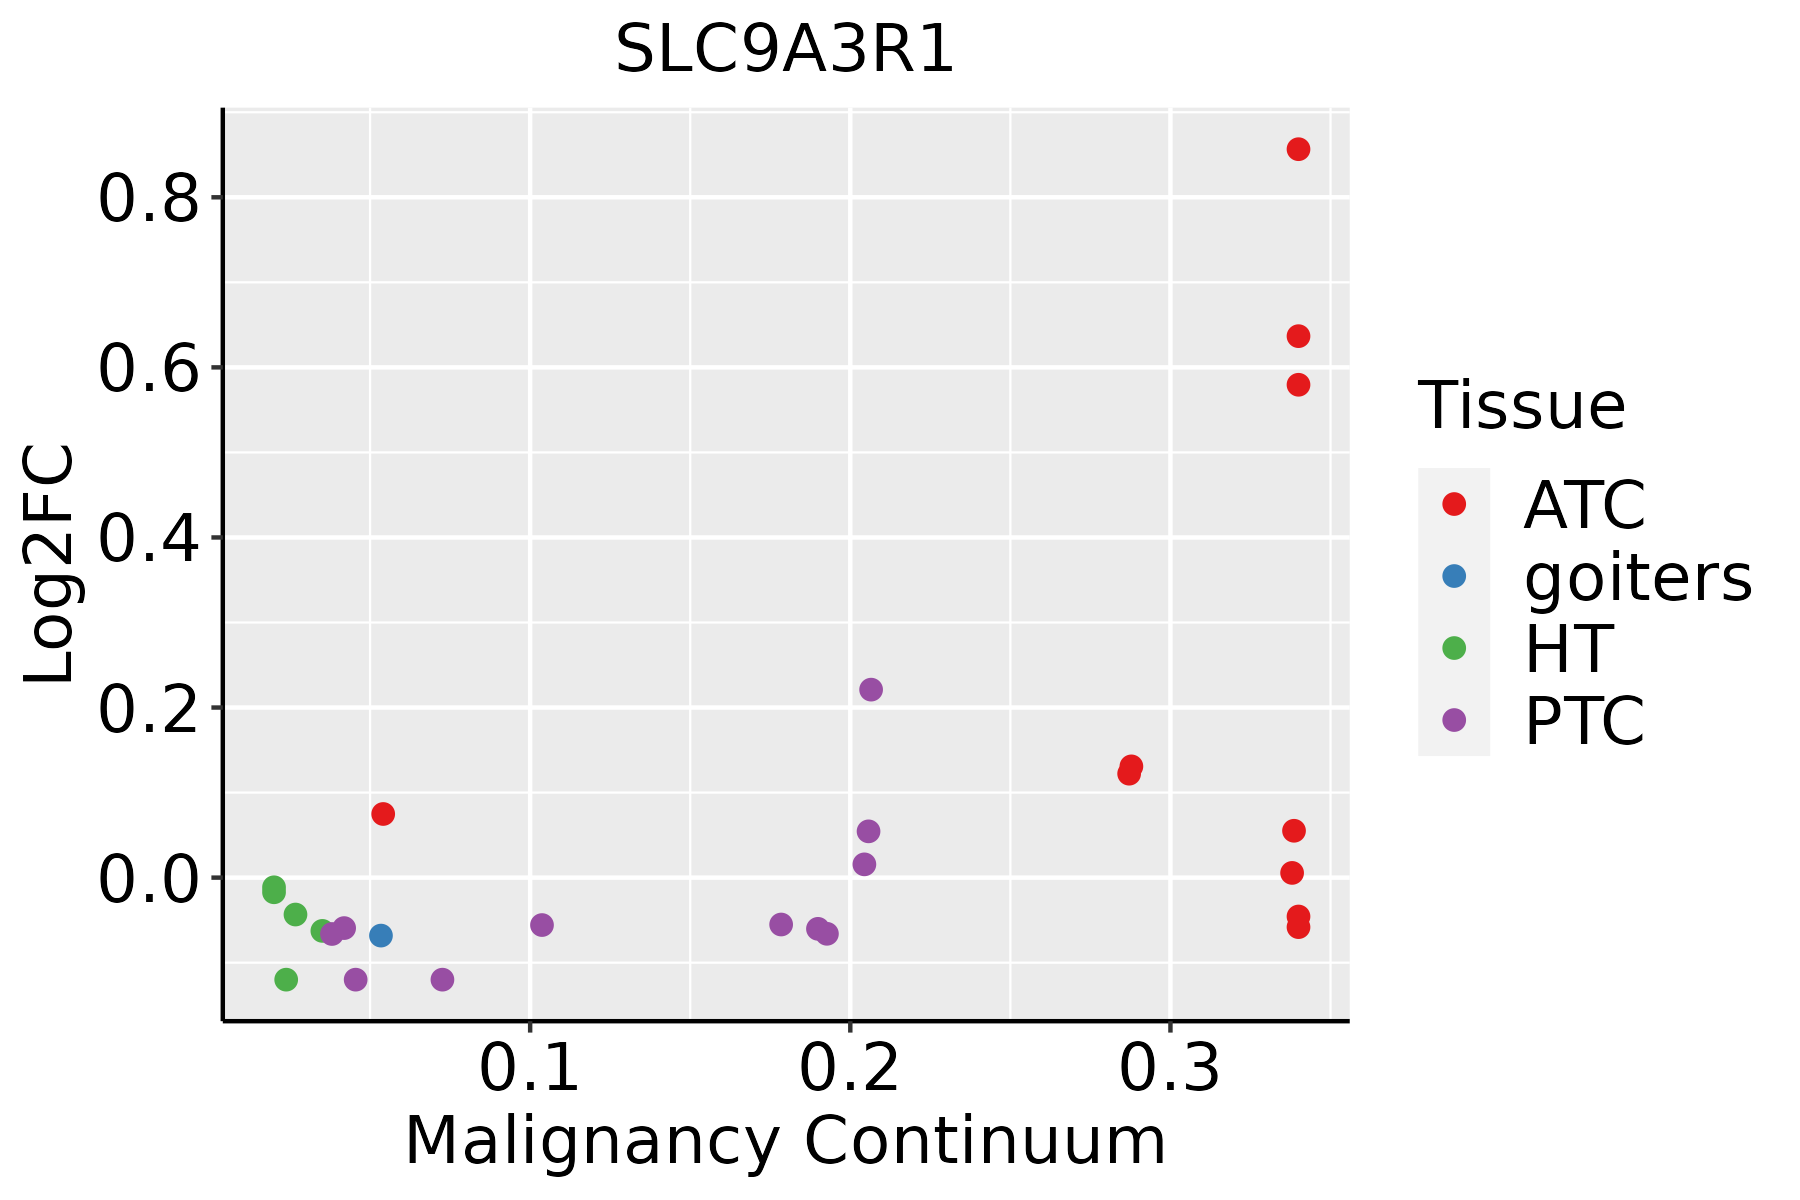 | ATC: Anaplastic thyroid cancer |
| HT: Hashimoto's thyroiditis | ||
| PTC: Papillary thyroid cancer |
| ∗log2FC in expression of this searched gene in stem-like cells from each diseased tissue sample relative to stem-like cells in normal samples in each tissue plotted against the malignancy continuum. Samples are colored based on if they are from different disease stage. |
Top |
Malignant transformation related pathway analysis |
| Find out the enriched GO biological processes and KEGG pathways involved in transition from healthy to precancer to cancer |
| Tissue | Disease Stage | Enriched GO biological Processes |
| Colorectum | AD |  |
| Colorectum | SER |  |
| Colorectum | MSS |  |
| Colorectum | MSI-H |  |
| Colorectum | FAP |  |
| ∗Top 15 enriched GO BP terms are showed in the bar plot of each disease state in each tissue. Each row represents a significant GO biological process which is colored according to the -log10(p.adjust). |
| Page: 1 2 3 4 5 6 7 8 9 |
| GO ID | Tissue | Disease Stage | Description | Gene Ratio | Bg Ratio | pvalue | p.adjust | Count |
| GO:00971939 | Breast | Precancer | intrinsic apoptotic signaling pathway | 59/1080 | 288/18723 | 8.07e-18 | 3.60e-15 | 59 |
| GO:20012339 | Breast | Precancer | regulation of apoptotic signaling pathway | 65/1080 | 356/18723 | 7.70e-17 | 3.17e-14 | 65 |
| GO:20012429 | Breast | Precancer | regulation of intrinsic apoptotic signaling pathway | 41/1080 | 164/18723 | 6.48e-16 | 2.31e-13 | 41 |
| GO:19026008 | Breast | Precancer | proton transmembrane transport | 39/1080 | 157/18723 | 4.18e-15 | 1.18e-12 | 39 |
| GO:20012445 | Breast | Precancer | positive regulation of intrinsic apoptotic signaling pathway | 17/1080 | 58/18723 | 1.59e-08 | 1.12e-06 | 17 |
| GO:20012356 | Breast | Precancer | positive regulation of apoptotic signaling pathway | 24/1080 | 126/18723 | 1.98e-07 | 1.01e-05 | 24 |
| GO:00487329 | Breast | Precancer | gland development | 49/1080 | 436/18723 | 6.11e-06 | 1.73e-04 | 49 |
| GO:00702933 | Breast | Precancer | renal absorption | 6/1080 | 17/18723 | 2.59e-04 | 3.83e-03 | 6 |
| GO:00085445 | Breast | Precancer | epidermis development | 35/1080 | 324/18723 | 2.71e-04 | 3.96e-03 | 35 |
| GO:00099136 | Breast | Precancer | epidermal cell differentiation | 23/1080 | 202/18723 | 1.43e-03 | 1.50e-02 | 23 |
| GO:00434912 | Breast | Precancer | protein kinase B signaling | 23/1080 | 211/18723 | 2.53e-03 | 2.30e-02 | 23 |
| GO:00158336 | Breast | Precancer | peptide transport | 27/1080 | 264/18723 | 2.84e-03 | 2.49e-02 | 27 |
| GO:00347673 | Breast | Precancer | positive regulation of ion transmembrane transport | 19/1080 | 167/18723 | 3.60e-03 | 2.98e-02 | 19 |
| GO:00071638 | Breast | Precancer | establishment or maintenance of cell polarity | 23/1080 | 218/18723 | 3.82e-03 | 3.06e-02 | 23 |
| GO:00109596 | Breast | Precancer | regulation of metal ion transport | 37/1080 | 406/18723 | 4.07e-03 | 3.22e-02 | 37 |
| GO:00020649 | Breast | Precancer | epithelial cell development | 23/1080 | 220/18723 | 4.28e-03 | 3.35e-02 | 23 |
| GO:00228985 | Breast | Precancer | regulation of transmembrane transporter activity | 27/1080 | 278/18723 | 5.72e-03 | 4.11e-02 | 27 |
| GO:00226049 | Breast | Precancer | regulation of cell morphogenesis | 29/1080 | 309/18723 | 6.88e-03 | 4.67e-02 | 29 |
| GO:200123314 | Breast | IDC | regulation of apoptotic signaling pathway | 82/1434 | 356/18723 | 6.27e-20 | 5.93e-17 | 82 |
| GO:009719314 | Breast | IDC | intrinsic apoptotic signaling pathway | 69/1434 | 288/18723 | 6.32e-18 | 2.99e-15 | 69 |
| Page: 1 2 3 4 5 6 7 8 9 10 11 12 13 14 15 16 17 18 19 20 21 22 23 24 25 26 27 28 29 30 31 32 33 34 35 36 37 38 39 |
| Pathway ID | Tissue | Disease Stage | Description | Gene Ratio | Bg Ratio | pvalue | p.adjust | qvalue | Count |
| hsa0513018 | Breast | Precancer | Pathogenic Escherichia coli infection | 38/684 | 197/8465 | 3.12e-07 | 5.81e-06 | 4.45e-06 | 38 |
| hsa0453018 | Breast | Precancer | Tight junction | 31/684 | 169/8465 | 1.13e-05 | 1.26e-04 | 9.64e-05 | 31 |
| hsa0513019 | Breast | Precancer | Pathogenic Escherichia coli infection | 38/684 | 197/8465 | 3.12e-07 | 5.81e-06 | 4.45e-06 | 38 |
| hsa0453019 | Breast | Precancer | Tight junction | 31/684 | 169/8465 | 1.13e-05 | 1.26e-04 | 9.64e-05 | 31 |
| hsa0453024 | Breast | IDC | Tight junction | 38/867 | 169/8465 | 2.07e-06 | 3.20e-05 | 2.39e-05 | 38 |
| hsa0513024 | Breast | IDC | Pathogenic Escherichia coli infection | 42/867 | 197/8465 | 2.66e-06 | 3.92e-05 | 2.94e-05 | 42 |
| hsa0453034 | Breast | IDC | Tight junction | 38/867 | 169/8465 | 2.07e-06 | 3.20e-05 | 2.39e-05 | 38 |
| hsa0513034 | Breast | IDC | Pathogenic Escherichia coli infection | 42/867 | 197/8465 | 2.66e-06 | 3.92e-05 | 2.94e-05 | 42 |
| hsa0513043 | Breast | DCIS | Pathogenic Escherichia coli infection | 42/846 | 197/8465 | 1.40e-06 | 2.15e-05 | 1.59e-05 | 42 |
| hsa0453044 | Breast | DCIS | Tight junction | 37/846 | 169/8465 | 3.07e-06 | 4.20e-05 | 3.09e-05 | 37 |
| hsa0513053 | Breast | DCIS | Pathogenic Escherichia coli infection | 42/846 | 197/8465 | 1.40e-06 | 2.15e-05 | 1.59e-05 | 42 |
| hsa0453054 | Breast | DCIS | Tight junction | 37/846 | 169/8465 | 3.07e-06 | 4.20e-05 | 3.09e-05 | 37 |
| hsa04530 | Colorectum | AD | Tight junction | 76/2092 | 169/8465 | 5.49e-09 | 9.69e-08 | 6.18e-08 | 76 |
| hsa05130 | Colorectum | AD | Pathogenic Escherichia coli infection | 79/2092 | 197/8465 | 1.05e-06 | 1.36e-05 | 8.65e-06 | 79 |
| hsa04928 | Colorectum | AD | Parathyroid hormone synthesis, secretion and action | 38/2092 | 106/8465 | 6.60e-03 | 2.77e-02 | 1.76e-02 | 38 |
| hsa045301 | Colorectum | AD | Tight junction | 76/2092 | 169/8465 | 5.49e-09 | 9.69e-08 | 6.18e-08 | 76 |
| hsa051301 | Colorectum | AD | Pathogenic Escherichia coli infection | 79/2092 | 197/8465 | 1.05e-06 | 1.36e-05 | 8.65e-06 | 79 |
| hsa049281 | Colorectum | AD | Parathyroid hormone synthesis, secretion and action | 38/2092 | 106/8465 | 6.60e-03 | 2.77e-02 | 1.76e-02 | 38 |
| hsa045302 | Colorectum | SER | Tight junction | 59/1580 | 169/8465 | 3.24e-07 | 5.98e-06 | 4.34e-06 | 59 |
| hsa051302 | Colorectum | SER | Pathogenic Escherichia coli infection | 60/1580 | 197/8465 | 3.63e-05 | 4.31e-04 | 3.13e-04 | 60 |
| Page: 1 2 3 4 5 |
Top |
Cell-cell communication analysis |
| Identification of potential cell-cell interactions between two cell types and their ligand-receptor pairs for different disease states |
| Ligand | Receptor | LRpair | Pathway | Tissue | Disease Stage |
| Page: 1 |
Top |
Single-cell gene regulatory network inference analysis |
| Find out the significant the regulons (TFs) and the target genes of each regulon across cell types for different disease states |
| TF | Cell Type | Tissue | Disease Stage | Target Gene | RSS | Regulon Activity |
| ∗The dot plots of a searched regulon are shown for all cell subpopulations in each disease state of each tissue based on the regulon specific score inferred using pySCENIC and by calculating the average expression. |
| Page: 1 |
Top |
Somatic mutation of malignant transformation related genes |
| Annotation of somatic variants for genes involved in malignant transformation |
| Hugo Symbol | Variant Class | Variant Classification | dbSNP RS | HGVSc | HGVSp | HGVSp Short | SWISSPROT | BIOTYPE | SIFT | PolyPhen | Tumor Sample Barcode | Tissue | Histology | Sex | Age | Stage | Therapy Types | Drugs | Outcome |
| SLC9A3R1 | SNV | Missense_Mutation | novel | c.724N>C | p.Cys242Arg | p.C242R | O14745 | protein_coding | tolerated(0.16) | benign(0.047) | TCGA-DF-A2KU-01 | Endometrium | uterine corpus endometrioid carcinoma | Female | Unknown | I/II | Unknown | Unknown | SD |
| SLC9A3R1 | SNV | Missense_Mutation | novel | c.847C>A | p.Pro283Thr | p.P283T | O14745 | protein_coding | tolerated(0.1) | benign(0.011) | TCGA-34-2605-01 | Lung | lung squamous cell carcinoma | Male | >=65 | III/IV | Chemotherapy | cisplatin | PD |
| SLC9A3R1 | SNV | Missense_Mutation | rs778705591 | c.610N>A | p.Gly204Arg | p.G204R | O14745 | protein_coding | deleterious(0.02) | probably_damaging(0.99) | TCGA-77-8130-01 | Lung | lung squamous cell carcinoma | Male | >=65 | I/II | Unknown | Unknown | PD |
| SLC9A3R1 | SNV | Missense_Mutation | rs773559482 | c.1025N>A | p.Arg342Gln | p.R342Q | O14745 | protein_coding | deleterious(0.03) | possibly_damaging(0.611) | TCGA-CN-5364-01 | Oral cavity | head & neck squamous cell carcinoma | Male | <65 | I/II | Chemotherapy | taxol | SD |
| Page: 1 2 |
Top |
Related drugs of malignant transformation related genes |
| Identification of chemicals and drugs interact with genes involved in malignant transfromation |
| (DGIdb 4.0) |
| Entrez ID | Symbol | Category | Interaction Types | Drug Claim Name | Drug Name | PMIDs |
| Page: 1 |

Copyright 2023-Present -The University of Texas Health Science Center at Houston |