
|
|||||
|
 | |
| |
| |
| |
| |
| |
|
Gene: PTPA |
Gene summary for PTPA |
| Gene information | Species | Human | Gene symbol | PTPA | Gene ID | 5524 |
| Gene name | protein phosphatase 2 phosphatase activator | |
| Gene Alias | PP2A | |
| Cytomap | 9q34.11 | |
| Gene Type | protein-coding | GO ID | GO:0000226 | UniProtAcc | F6WIT2 |
Top |
Malignant transformation analysis |
| Identification of the aberrant gene expression in precancerous and cancerous lesions by comparing the gene expression of stem-like cells in diseased tissues with normal stem cells |
| Entrez ID | Symbol | Replicates | Species | Organ | Tissue | Adj P-value | Log2FC | Malignancy |
| 5524 | PTPA | HTA11_2487_2000001011 | Human | Colorectum | SER | 1.13e-07 | 3.41e-01 | -0.1808 |
| 5524 | PTPA | HTA11_1938_2000001011 | Human | Colorectum | AD | 4.51e-03 | 3.50e-01 | -0.0811 |
| 5524 | PTPA | HTA11_78_2000001011 | Human | Colorectum | AD | 2.29e-02 | 1.43e-01 | -0.1088 |
| 5524 | PTPA | HTA11_347_2000001011 | Human | Colorectum | AD | 1.47e-04 | 2.45e-01 | -0.1954 |
| 5524 | PTPA | HTA11_3361_2000001011 | Human | Colorectum | AD | 1.06e-03 | 3.36e-01 | -0.1207 |
| 5524 | PTPA | HTA11_83_2000001011 | Human | Colorectum | SER | 2.26e-04 | 2.55e-01 | -0.1526 |
| 5524 | PTPA | HTA11_696_2000001011 | Human | Colorectum | AD | 1.51e-13 | 3.27e-01 | -0.1464 |
| 5524 | PTPA | HTA11_866_2000001011 | Human | Colorectum | AD | 5.51e-06 | 2.35e-01 | -0.1001 |
| 5524 | PTPA | HTA11_1391_2000001011 | Human | Colorectum | AD | 6.51e-16 | 5.38e-01 | -0.059 |
| 5524 | PTPA | HTA11_2992_2000001011 | Human | Colorectum | SER | 4.83e-04 | 4.74e-01 | -0.1706 |
| 5524 | PTPA | HTA11_546_2000001011 | Human | Colorectum | AD | 5.22e-05 | 3.89e-01 | -0.0842 |
| 5524 | PTPA | HTA11_866_3004761011 | Human | Colorectum | AD | 3.78e-04 | 2.28e-01 | 0.096 |
| 5524 | PTPA | HTA11_10623_2000001011 | Human | Colorectum | AD | 4.09e-07 | 4.71e-01 | -0.0177 |
| 5524 | PTPA | HTA11_10711_2000001011 | Human | Colorectum | AD | 2.49e-05 | 2.88e-01 | 0.0338 |
| 5524 | PTPA | HTA11_7696_3000711011 | Human | Colorectum | AD | 5.94e-15 | 4.29e-01 | 0.0674 |
| 5524 | PTPA | HTA11_11156_2000001011 | Human | Colorectum | AD | 9.25e-07 | 5.74e-01 | 0.0397 |
| 5524 | PTPA | HTA11_99999970781_79442 | Human | Colorectum | MSS | 1.38e-04 | 1.59e-01 | 0.294 |
| 5524 | PTPA | HTA11_99999965062_69753 | Human | Colorectum | MSI-H | 1.44e-04 | 8.72e-01 | 0.3487 |
| 5524 | PTPA | HTA11_99999971662_82457 | Human | Colorectum | MSS | 4.64e-10 | 3.60e-01 | 0.3859 |
| 5524 | PTPA | HTA11_99999974143_84620 | Human | Colorectum | MSS | 7.95e-03 | 1.83e-01 | 0.3005 |
| Page: 1 2 3 |
| Tissue | Expression Dynamics | Abbreviation |
| Colorectum (GSE201348) |  | FAP: Familial adenomatous polyposis |
| CRC: Colorectal cancer | ||
| Colorectum (HTA11) |  | AD: Adenomas |
| SER: Sessile serrated lesions | ||
| MSI-H: Microsatellite-high colorectal cancer | ||
| MSS: Microsatellite stable colorectal cancer | ||
| Endometrium | 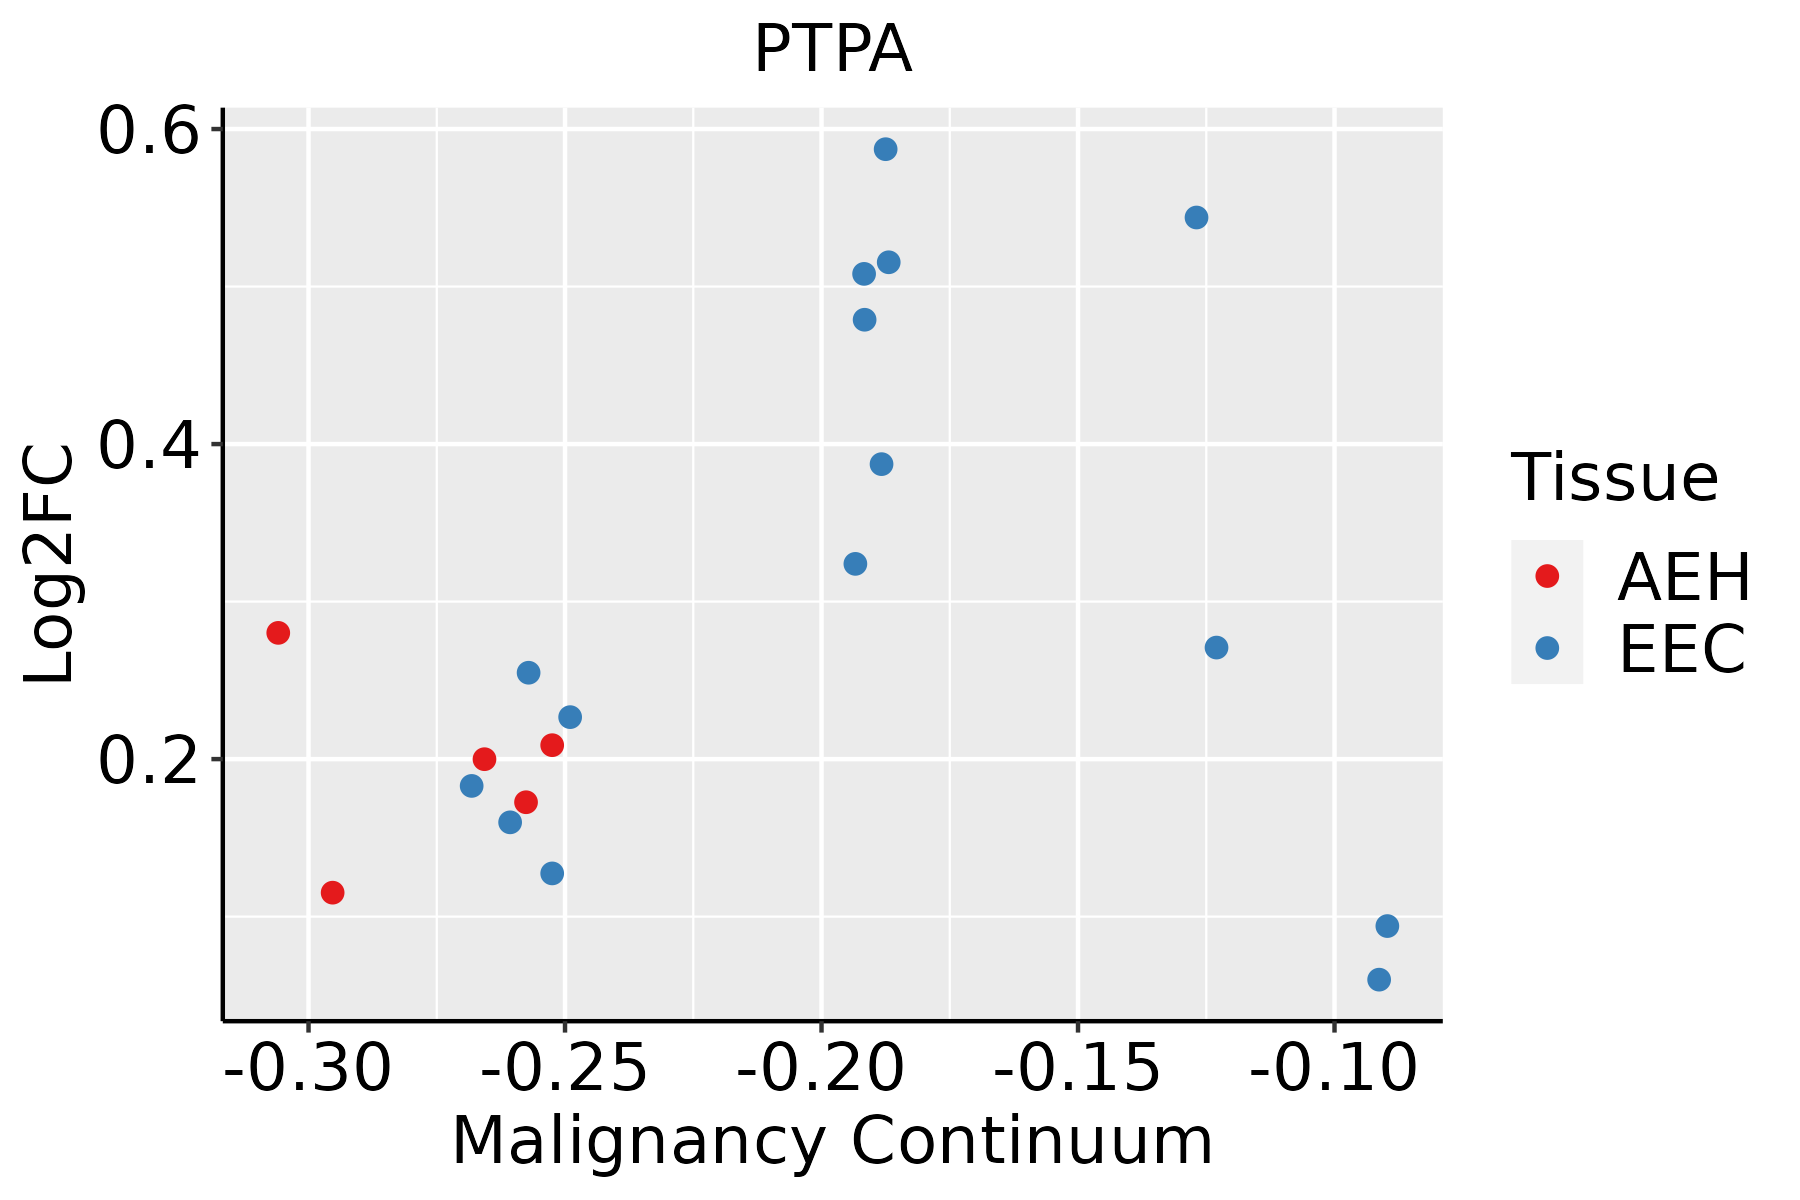 | AEH: Atypical endometrial hyperplasia |
| EEC: Endometrioid Cancer | ||
| Liver | 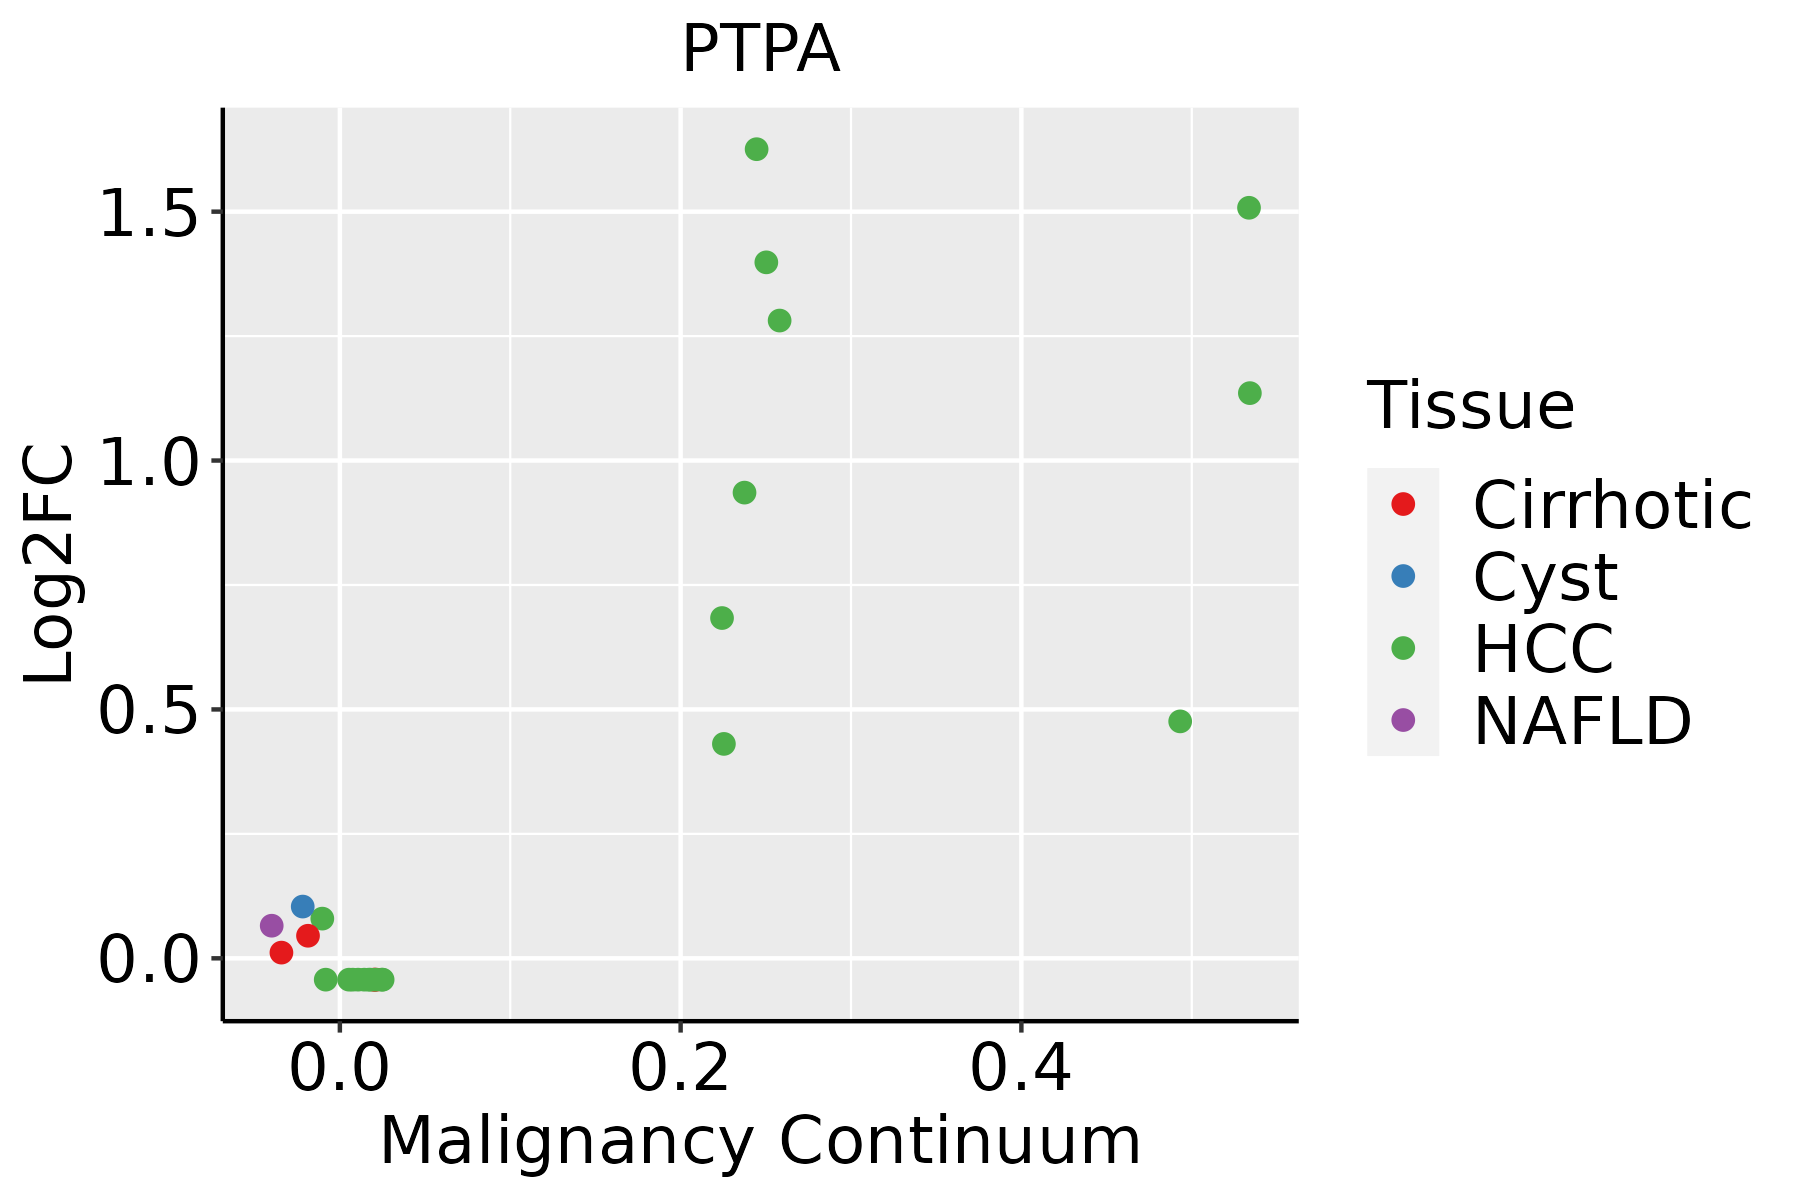 | HCC: Hepatocellular carcinoma |
| NAFLD: Non-alcoholic fatty liver disease | ||
| Thyroid | 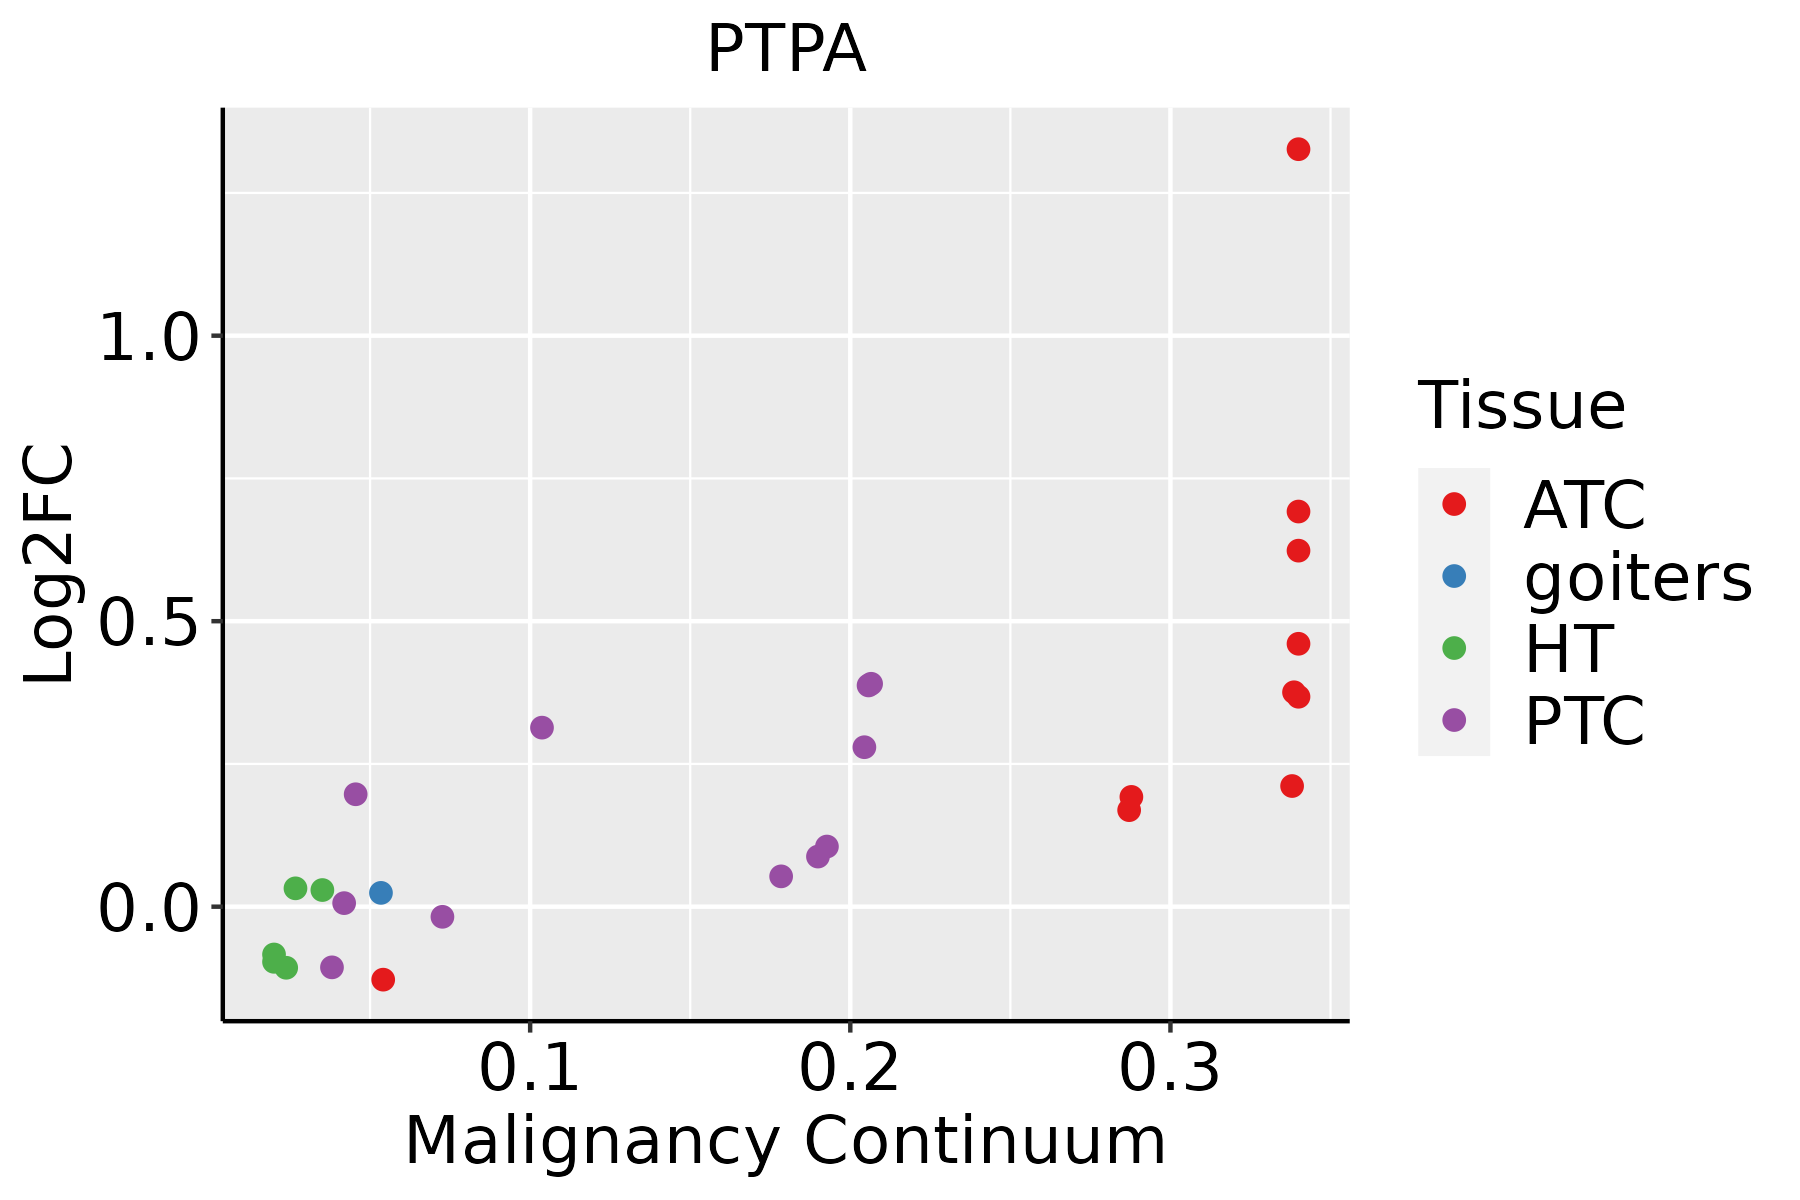 | ATC: Anaplastic thyroid cancer |
| HT: Hashimoto's thyroiditis | ||
| PTC: Papillary thyroid cancer |
| ∗log2FC in expression of this searched gene in stem-like cells from each diseased tissue sample relative to stem-like cells in normal samples in each tissue plotted against the malignancy continuum. Samples are colored based on if they are from different disease stage. |
Top |
Malignant transformation related pathway analysis |
| Find out the enriched GO biological processes and KEGG pathways involved in transition from healthy to precancer to cancer |
| Tissue | Disease Stage | Enriched GO biological Processes |
| Colorectum | AD |  |
| Colorectum | SER |  |
| Colorectum | MSS |  |
| Colorectum | MSI-H |  |
| Colorectum | FAP |  |
| ∗Top 15 enriched GO BP terms are showed in the bar plot of each disease state in each tissue. Each row represents a significant GO biological process which is colored according to the -log10(p.adjust). |
| Page: 1 2 3 4 5 6 7 8 9 |
| GO ID | Tissue | Disease Stage | Description | Gene Ratio | Bg Ratio | pvalue | p.adjust | Count |
| GO:0010563 | Colorectum | AD | negative regulation of phosphorus metabolic process | 130/3918 | 442/18723 | 1.26e-05 | 2.76e-04 | 130 |
| GO:0045936 | Colorectum | AD | negative regulation of phosphate metabolic process | 129/3918 | 441/18723 | 1.81e-05 | 3.76e-04 | 129 |
| GO:0016311 | Colorectum | AD | dephosphorylation | 123/3918 | 417/18723 | 1.84e-05 | 3.82e-04 | 123 |
| GO:0006470 | Colorectum | AD | protein dephosphorylation | 88/3918 | 281/18723 | 2.56e-05 | 4.89e-04 | 88 |
| GO:0035303 | Colorectum | AD | regulation of dephosphorylation | 46/3918 | 128/18723 | 6.20e-05 | 1.04e-03 | 46 |
| GO:0035304 | Colorectum | AD | regulation of protein dephosphorylation | 33/3918 | 90/18723 | 4.23e-04 | 4.77e-03 | 33 |
| GO:0007051 | Colorectum | AD | spindle organization | 58/3918 | 184/18723 | 4.71e-04 | 5.20e-03 | 58 |
| GO:1902850 | Colorectum | AD | microtubule cytoskeleton organization involved in mitosis | 48/3918 | 147/18723 | 5.87e-04 | 6.21e-03 | 48 |
| GO:0007052 | Colorectum | AD | mitotic spindle organization | 40/3918 | 120/18723 | 1.03e-03 | 9.61e-03 | 40 |
| GO:0010921 | Colorectum | AD | regulation of phosphatase activity | 30/3918 | 84/18723 | 1.24e-03 | 1.09e-02 | 30 |
| GO:0010922 | Colorectum | AD | positive regulation of phosphatase activity | 15/3918 | 34/18723 | 1.96e-03 | 1.58e-02 | 15 |
| GO:0035306 | Colorectum | AD | positive regulation of dephosphorylation | 22/3918 | 59/18723 | 2.86e-03 | 2.14e-02 | 22 |
| GO:0043666 | Colorectum | AD | regulation of phosphoprotein phosphatase activity | 21/3918 | 58/18723 | 5.25e-03 | 3.47e-02 | 21 |
| GO:0035308 | Colorectum | AD | negative regulation of protein dephosphorylation | 14/3918 | 34/18723 | 5.86e-03 | 3.69e-02 | 14 |
| GO:00105631 | Colorectum | SER | negative regulation of phosphorus metabolic process | 101/2897 | 442/18723 | 2.39e-05 | 6.70e-04 | 101 |
| GO:00459361 | Colorectum | SER | negative regulation of phosphate metabolic process | 100/2897 | 441/18723 | 3.62e-05 | 9.39e-04 | 100 |
| GO:00064701 | Colorectum | SER | protein dephosphorylation | 65/2897 | 281/18723 | 4.44e-04 | 6.51e-03 | 65 |
| GO:0051346 | Colorectum | SER | negative regulation of hydrolase activity | 82/2897 | 379/18723 | 8.19e-04 | 1.01e-02 | 82 |
| GO:00109211 | Colorectum | SER | regulation of phosphatase activity | 24/2897 | 84/18723 | 1.61e-03 | 1.71e-02 | 24 |
| GO:00353031 | Colorectum | SER | regulation of dephosphorylation | 33/2897 | 128/18723 | 1.71e-03 | 1.78e-02 | 33 |
| Page: 1 2 3 4 5 6 7 |
| Pathway ID | Tissue | Disease Stage | Description | Gene Ratio | Bg Ratio | pvalue | p.adjust | qvalue | Count |
| hsa05415 | Colorectum | AD | Diabetic cardiomyopathy | 114/2092 | 203/8465 | 3.65e-22 | 3.06e-20 | 1.95e-20 | 114 |
| hsa054151 | Colorectum | AD | Diabetic cardiomyopathy | 114/2092 | 203/8465 | 3.65e-22 | 3.06e-20 | 1.95e-20 | 114 |
| hsa054152 | Colorectum | SER | Diabetic cardiomyopathy | 103/1580 | 203/8465 | 1.45e-25 | 1.61e-23 | 1.17e-23 | 103 |
| hsa054153 | Colorectum | SER | Diabetic cardiomyopathy | 103/1580 | 203/8465 | 1.45e-25 | 1.61e-23 | 1.17e-23 | 103 |
| hsa054154 | Colorectum | MSS | Diabetic cardiomyopathy | 106/1875 | 203/8465 | 2.47e-21 | 1.62e-19 | 9.92e-20 | 106 |
| hsa04931 | Colorectum | MSS | Insulin resistance | 36/1875 | 108/8465 | 4.74e-03 | 2.01e-02 | 1.23e-02 | 36 |
| hsa054155 | Colorectum | MSS | Diabetic cardiomyopathy | 106/1875 | 203/8465 | 2.47e-21 | 1.62e-19 | 9.92e-20 | 106 |
| hsa049311 | Colorectum | MSS | Insulin resistance | 36/1875 | 108/8465 | 4.74e-03 | 2.01e-02 | 1.23e-02 | 36 |
| hsa054156 | Colorectum | MSI-H | Diabetic cardiomyopathy | 57/797 | 203/8465 | 1.15e-14 | 3.11e-13 | 2.61e-13 | 57 |
| hsa054157 | Colorectum | MSI-H | Diabetic cardiomyopathy | 57/797 | 203/8465 | 1.15e-14 | 3.11e-13 | 2.61e-13 | 57 |
| hsa0541525 | Endometrium | AEH | Diabetic cardiomyopathy | 86/1197 | 203/8465 | 2.62e-23 | 1.22e-21 | 8.90e-22 | 86 |
| hsa05415111 | Endometrium | AEH | Diabetic cardiomyopathy | 86/1197 | 203/8465 | 2.62e-23 | 1.22e-21 | 8.90e-22 | 86 |
| hsa0541526 | Endometrium | EEC | Diabetic cardiomyopathy | 86/1237 | 203/8465 | 2.59e-22 | 9.46e-21 | 7.05e-21 | 86 |
| hsa0541535 | Endometrium | EEC | Diabetic cardiomyopathy | 86/1237 | 203/8465 | 2.59e-22 | 9.46e-21 | 7.05e-21 | 86 |
| hsa0541522 | Liver | HCC | Diabetic cardiomyopathy | 151/4020 | 203/8465 | 2.72e-15 | 1.01e-13 | 5.63e-14 | 151 |
| hsa0541532 | Liver | HCC | Diabetic cardiomyopathy | 151/4020 | 203/8465 | 2.72e-15 | 1.01e-13 | 5.63e-14 | 151 |
| Page: 1 |
Top |
Cell-cell communication analysis |
| Identification of potential cell-cell interactions between two cell types and their ligand-receptor pairs for different disease states |
| Ligand | Receptor | LRpair | Pathway | Tissue | Disease Stage |
| Page: 1 |
Top |
Single-cell gene regulatory network inference analysis |
| Find out the significant the regulons (TFs) and the target genes of each regulon across cell types for different disease states |
| TF | Cell Type | Tissue | Disease Stage | Target Gene | RSS | Regulon Activity |
| ∗The dot plots of a searched regulon are shown for all cell subpopulations in each disease state of each tissue based on the regulon specific score inferred using pySCENIC and by calculating the average expression. |
| Page: 1 |
Top |
Somatic mutation of malignant transformation related genes |
| Annotation of somatic variants for genes involved in malignant transformation |
| Hugo Symbol | Variant Class | Variant Classification | dbSNP RS | HGVSc | HGVSp | HGVSp Short | SWISSPROT | BIOTYPE | SIFT | PolyPhen | Tumor Sample Barcode | Tissue | Histology | Sex | Age | Stage | Therapy Types | Drugs | Outcome |
| PTPA | SNV | Missense_Mutation | c.420G>T | p.Lys140Asn | p.K140N | Q15257 | protein_coding | tolerated(0.46) | benign(0.075) | TCGA-D1-A103-01 | Endometrium | uterine corpus endometrioid carcinoma | Female | >=65 | I/II | Unknown | Unknown | SD | |
| PTPA | SNV | Missense_Mutation | novel | c.296G>A | p.Arg99Gln | p.R99Q | Q15257 | protein_coding | deleterious(0) | probably_damaging(1) | TCGA-EO-A22R-01 | Endometrium | uterine corpus endometrioid carcinoma | Female | <65 | I/II | Unknown | Unknown | SD |
| PTPA | SNV | Missense_Mutation | novel | c.253G>C | p.Asp85His | p.D85H | Q15257 | protein_coding | deleterious(0) | possibly_damaging(0.852) | TCGA-CC-A8HV-01 | Liver | liver hepatocellular carcinoma | Female | <65 | I/II | Targeted Molecular therapy | sorafenib | PD |
| PTPA | SNV | Missense_Mutation | c.596A>G | p.Tyr199Cys | p.Y199C | Q15257 | protein_coding | deleterious(0) | probably_damaging(0.947) | TCGA-G3-A5SL-01 | Liver | liver hepatocellular carcinoma | Male | >=65 | I/II | Unknown | Unknown | SD | |
| PTPA | SNV | Missense_Mutation | c.812N>T | p.His271Leu | p.H271L | Q15257 | protein_coding | deleterious(0) | probably_damaging(0.954) | TCGA-86-8358-01 | Lung | lung adenocarcinoma | Male | <65 | I/II | Unknown | Unknown | SD | |
| PTPA | SNV | Missense_Mutation | novel | c.487C>T | p.Leu163Phe | p.L163F | Q15257 | protein_coding | deleterious(0) | probably_damaging(0.996) | TCGA-CV-6951-01 | Oral cavity | head & neck squamous cell carcinoma | Male | <65 | I/II | Unknown | Unknown | PD |
| PTPA | SNV | Missense_Mutation | rs200345986 | c.121N>T | p.Arg41Cys | p.R41C | Q15257 | protein_coding | deleterious(0.01) | possibly_damaging(0.812) | TCGA-CV-A6K2-01 | Oral cavity | head & neck squamous cell carcinoma | Male | >=65 | I/II | Unknown | Unknown | PD |
| PTPA | SNV | Missense_Mutation | c.613N>A | p.Gly205Ser | p.G205S | Q15257 | protein_coding | deleterious(0) | probably_damaging(0.985) | TCGA-BR-4368-01 | Stomach | stomach adenocarcinoma | Female | >=65 | III/IV | Unknown | Unknown | SD | |
| PTPA | SNV | Missense_Mutation | c.838N>A | p.Ala280Thr | p.A280T | Q15257 | protein_coding | deleterious(0.01) | possibly_damaging(0.811) | TCGA-CD-8536-01 | Stomach | stomach adenocarcinoma | Male | >=65 | I/II | Chemotherapy | epirubicin | CR | |
| PTPA | SNV | Missense_Mutation | novel | c.508G>T | p.Gly170Trp | p.G170W | Q15257 | protein_coding | deleterious(0) | probably_damaging(0.994) | TCGA-FY-A3BL-01 | Thyroid | thyroid carcinoma | Male | <65 | I/II | Unknown | Unknown | SD |
| Page: 1 2 |
Top |
Related drugs of malignant transformation related genes |
| Identification of chemicals and drugs interact with genes involved in malignant transfromation |
| (DGIdb 4.0) |
| Entrez ID | Symbol | Category | Interaction Types | Drug Claim Name | Drug Name | PMIDs |
| 5524 | PTPA | PROTEIN PHOSPHATASE | LB-100 | LB-100 |
| Page: 1 |

Copyright 2023-Present -The University of Texas Health Science Center at Houston |