
|
|||||
|
 | |
| |
| |
| |
| |
| |
|
Gene: PSME2 |
Gene summary for PSME2 |
| Gene information | Species | Human | Gene symbol | PSME2 | Gene ID | 5721 |
| Gene name | proteasome activator subunit 2 | |
| Gene Alias | PA28B | |
| Cytomap | 14q12 | |
| Gene Type | protein-coding | GO ID | GO:0000082 | UniProtAcc | Q86SZ7 |
Top |
Malignant transformation analysis |
| Identification of the aberrant gene expression in precancerous and cancerous lesions by comparing the gene expression of stem-like cells in diseased tissues with normal stem cells |
| Entrez ID | Symbol | Replicates | Species | Organ | Tissue | Adj P-value | Log2FC | Malignancy |
| 5721 | PSME2 | GSM4909282 | Human | Breast | IDC | 1.98e-07 | 3.82e-01 | -0.0288 |
| 5721 | PSME2 | GSM4909286 | Human | Breast | IDC | 4.16e-13 | -4.42e-01 | 0.1081 |
| 5721 | PSME2 | GSM4909287 | Human | Breast | IDC | 2.86e-04 | 3.44e-01 | 0.2057 |
| 5721 | PSME2 | GSM4909288 | Human | Breast | IDC | 3.48e-03 | 1.69e-01 | 0.0988 |
| 5721 | PSME2 | GSM4909296 | Human | Breast | IDC | 1.95e-09 | 6.50e-02 | 0.1524 |
| 5721 | PSME2 | GSM4909297 | Human | Breast | IDC | 3.71e-14 | -1.97e-01 | 0.1517 |
| 5721 | PSME2 | GSM4909298 | Human | Breast | IDC | 3.51e-12 | -3.88e-01 | 0.1551 |
| 5721 | PSME2 | GSM4909301 | Human | Breast | IDC | 3.34e-05 | -2.13e-01 | 0.1577 |
| 5721 | PSME2 | GSM4909311 | Human | Breast | IDC | 5.81e-35 | -4.32e-01 | 0.1534 |
| 5721 | PSME2 | GSM4909312 | Human | Breast | IDC | 3.63e-13 | -3.36e-01 | 0.1552 |
| 5721 | PSME2 | GSM4909315 | Human | Breast | IDC | 6.83e-03 | 1.15e-01 | 0.21 |
| 5721 | PSME2 | GSM4909316 | Human | Breast | IDC | 6.55e-07 | 3.40e-01 | 0.21 |
| 5721 | PSME2 | GSM4909319 | Human | Breast | IDC | 2.71e-45 | -2.59e-01 | 0.1563 |
| 5721 | PSME2 | GSM4909320 | Human | Breast | IDC | 1.75e-04 | -2.81e-01 | 0.1575 |
| 5721 | PSME2 | GSM4909321 | Human | Breast | IDC | 2.63e-13 | 5.38e-02 | 0.1559 |
| 5721 | PSME2 | brca1 | Human | Breast | Precancer | 3.39e-19 | 6.17e-01 | -0.0338 |
| 5721 | PSME2 | brca2 | Human | Breast | Precancer | 4.50e-16 | 5.44e-01 | -0.024 |
| 5721 | PSME2 | brca3 | Human | Breast | Precancer | 3.17e-03 | 3.49e-01 | -0.0263 |
| 5721 | PSME2 | NCCBC14 | Human | Breast | DCIS | 1.79e-10 | -3.23e-01 | 0.2021 |
| 5721 | PSME2 | NCCBC2 | Human | Breast | DCIS | 5.74e-03 | -2.52e-01 | 0.1554 |
| Page: 1 2 3 4 5 6 7 8 9 10 11 12 13 14 15 |
| Tissue | Expression Dynamics | Abbreviation |
| Breast | 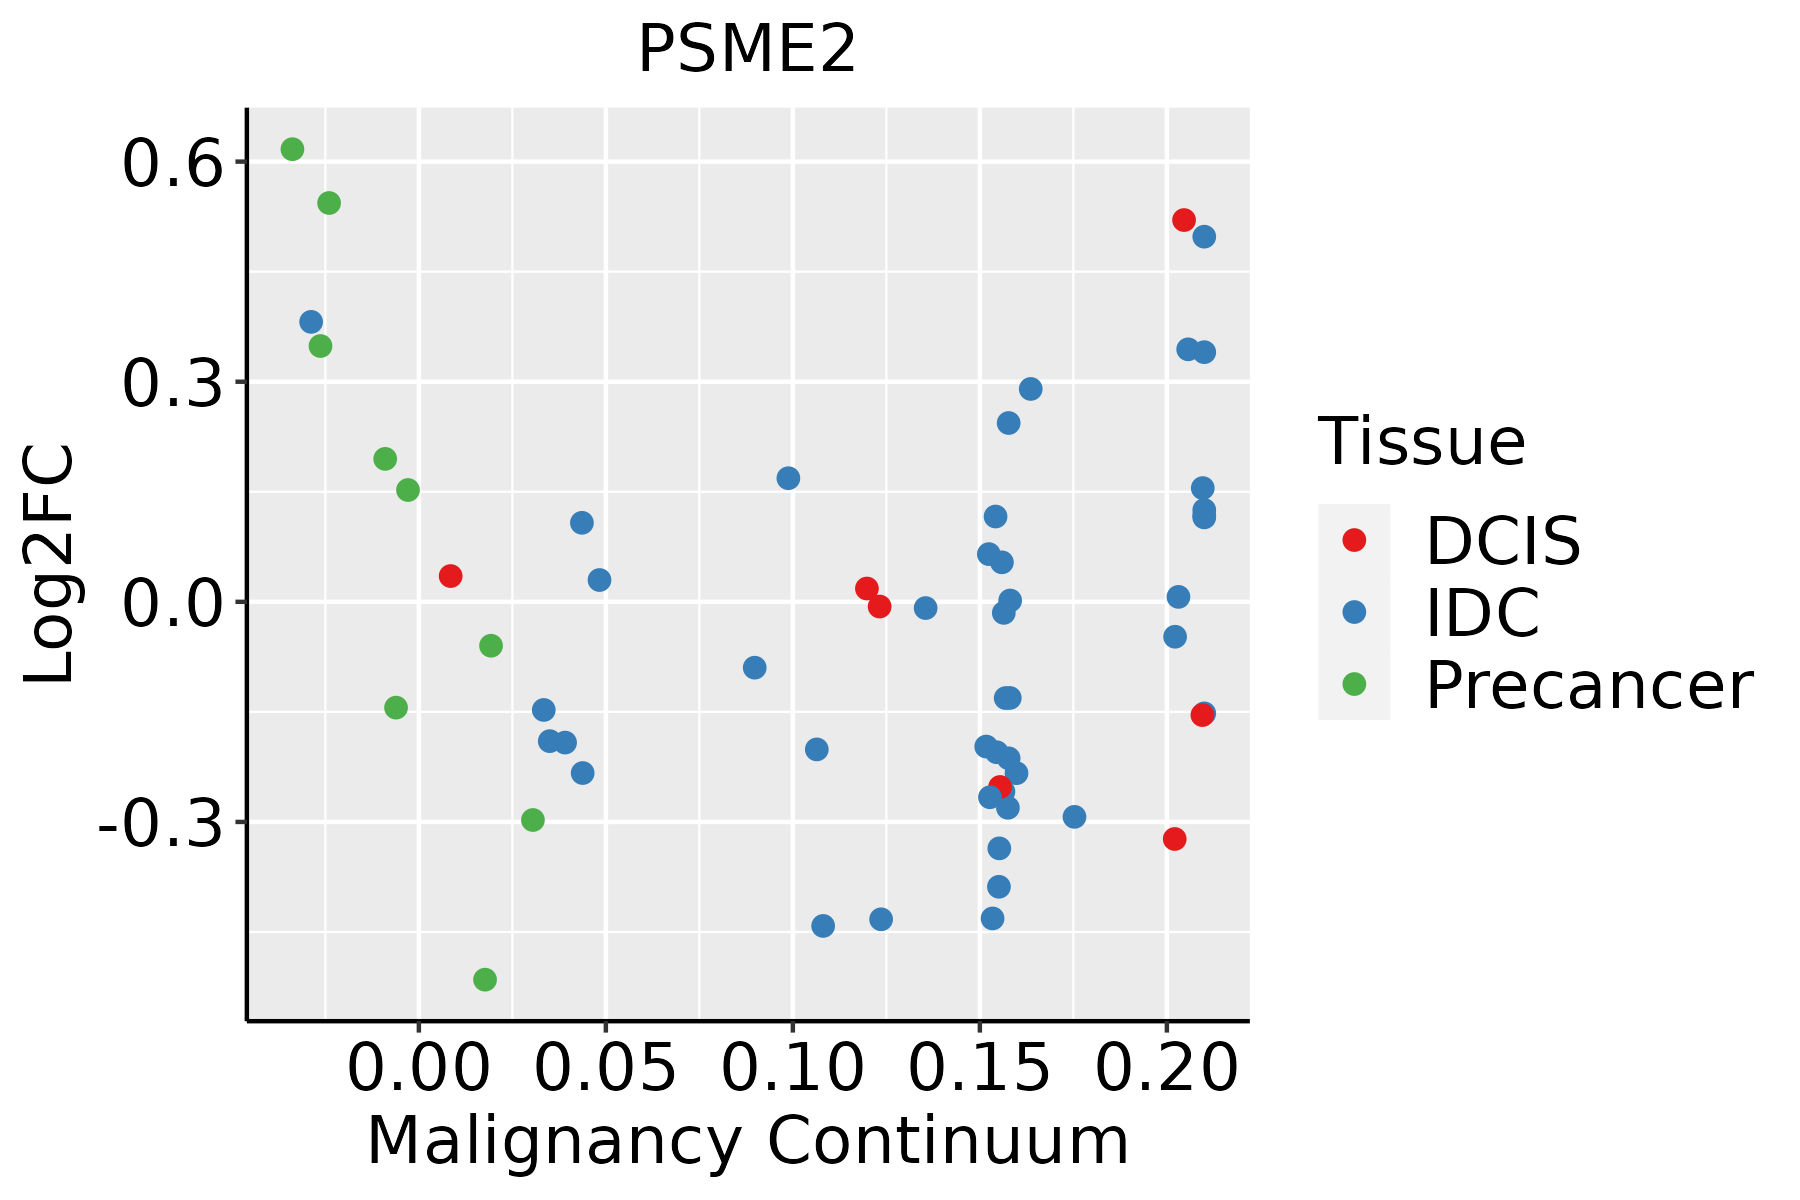 | IDC: Invasive ductal carcinoma |
| DCIS: Ductal carcinoma in situ | ||
| Precancer(BRCA1-mut): Precancerous lesion from BRCA1 mutation carriers | ||
| Cervix |  | CC: Cervix cancer |
| HSIL_HPV: HPV-infected high-grade squamous intraepithelial lesions | ||
| N_HPV: HPV-infected normal cervix | ||
| Colorectum (GSE201348) |  | FAP: Familial adenomatous polyposis |
| CRC: Colorectal cancer | ||
| Colorectum (HTA11) |  | AD: Adenomas |
| SER: Sessile serrated lesions | ||
| MSI-H: Microsatellite-high colorectal cancer | ||
| MSS: Microsatellite stable colorectal cancer | ||
| Endometrium | 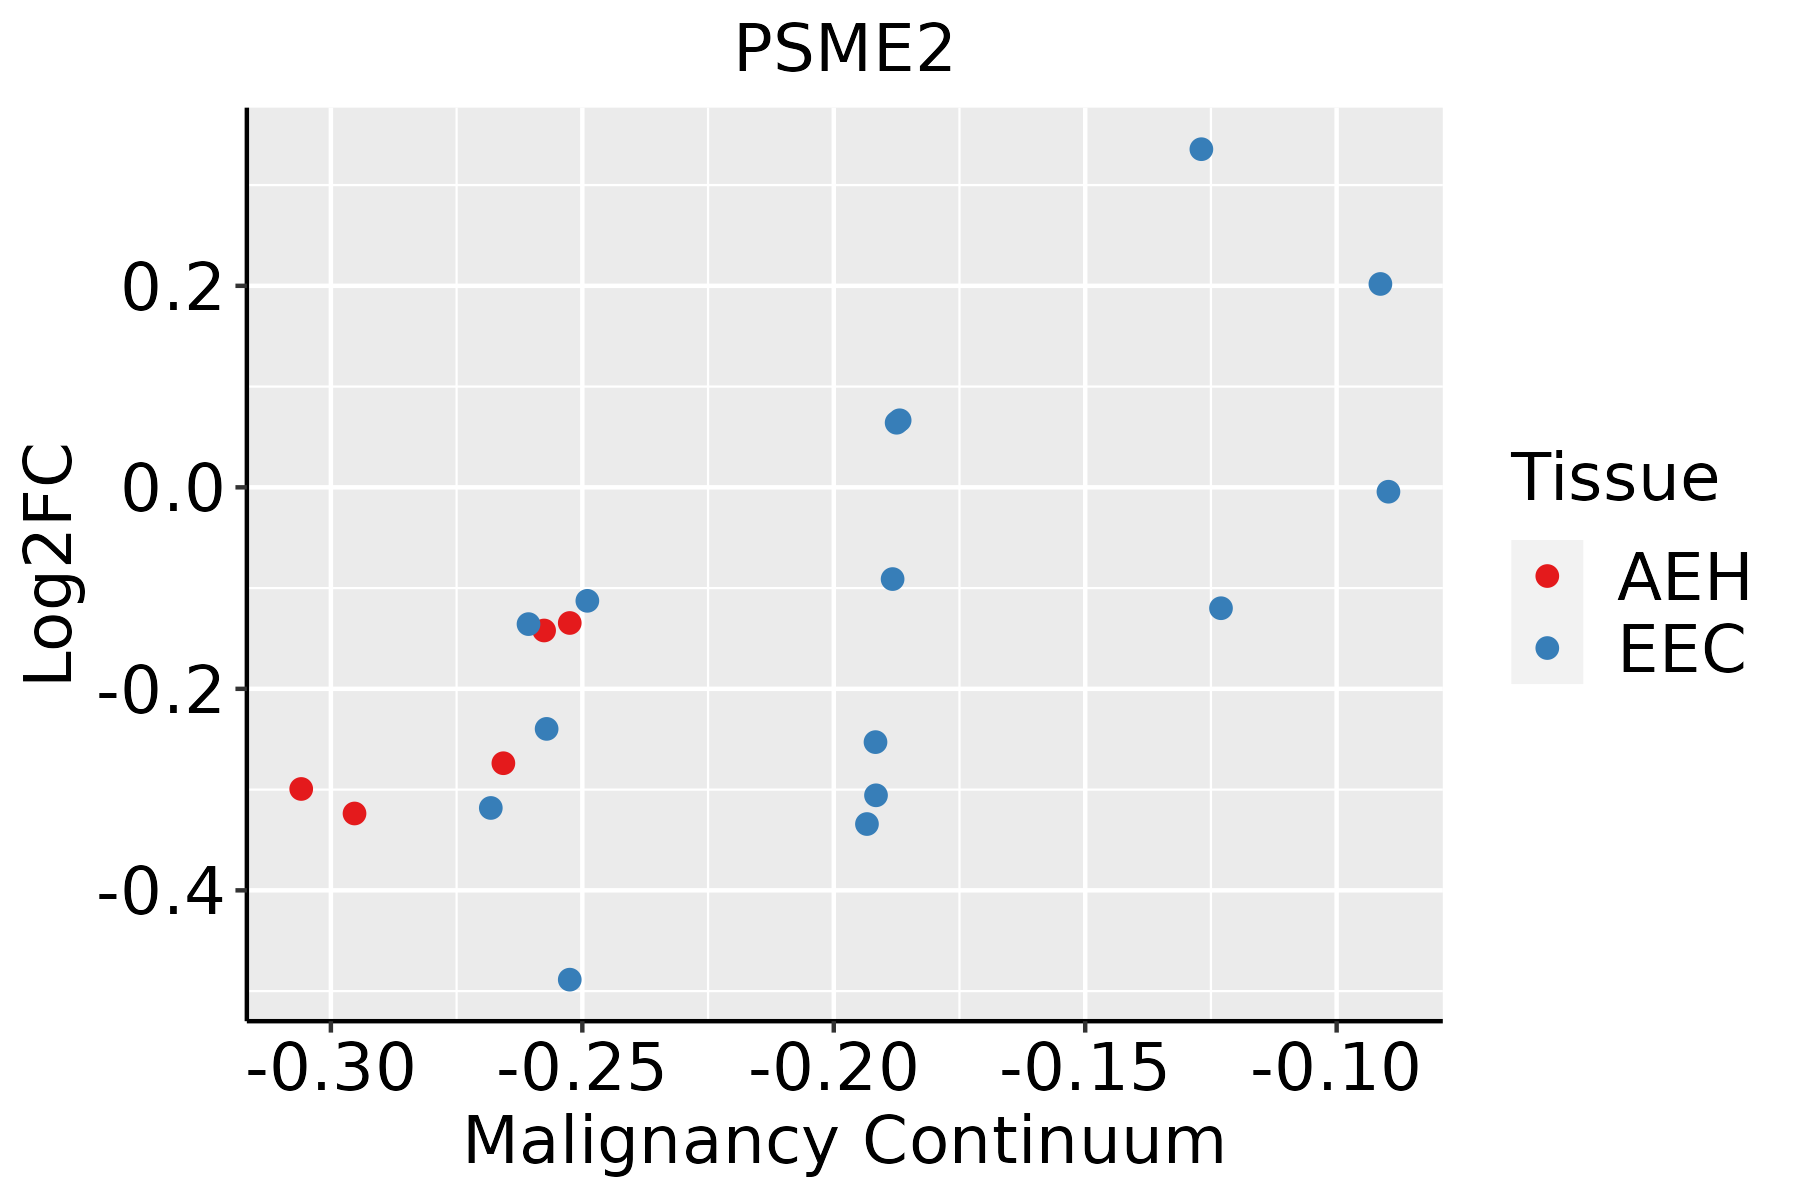 | AEH: Atypical endometrial hyperplasia |
| EEC: Endometrioid Cancer | ||
| Esophagus | 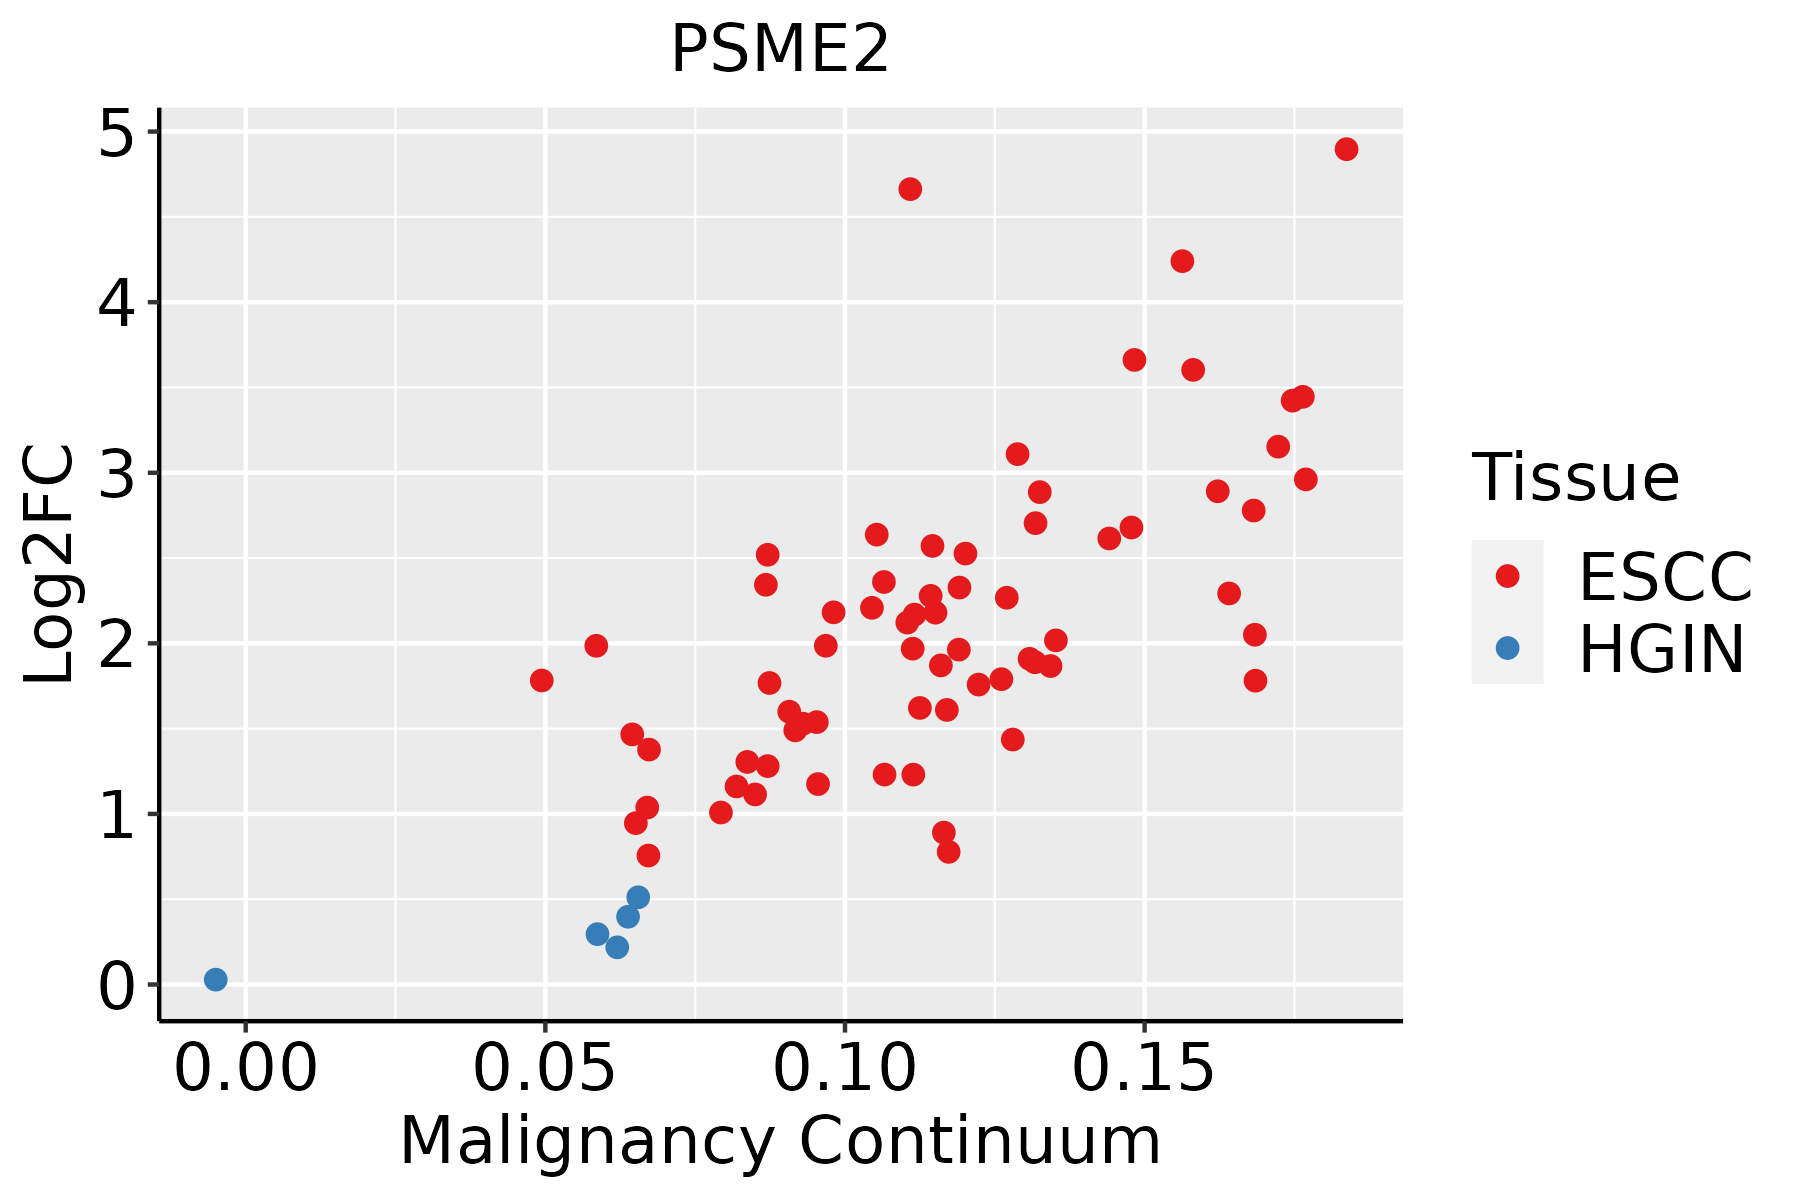 | ESCC: Esophageal squamous cell carcinoma |
| HGIN: High-grade intraepithelial neoplasias | ||
| LGIN: Low-grade intraepithelial neoplasias | ||
| GC |  | CAG: Chronic atrophic gastritis |
| CAG with IM: Chronic atrophic gastritis with intestinal metaplasia | ||
| CSG: Chronic superficial gastritis | ||
| GC: Gastric cancer | ||
| SIM: Severe intestinal metaplasia | ||
| WIM: Wild intestinal metaplasia | ||
| Liver |  | HCC: Hepatocellular carcinoma |
| NAFLD: Non-alcoholic fatty liver disease | ||
| Oral Cavity |  | EOLP: Erosive Oral lichen planus |
| LP: leukoplakia | ||
| NEOLP: Non-erosive oral lichen planus | ||
| OSCC: Oral squamous cell carcinoma | ||
| Prostate | 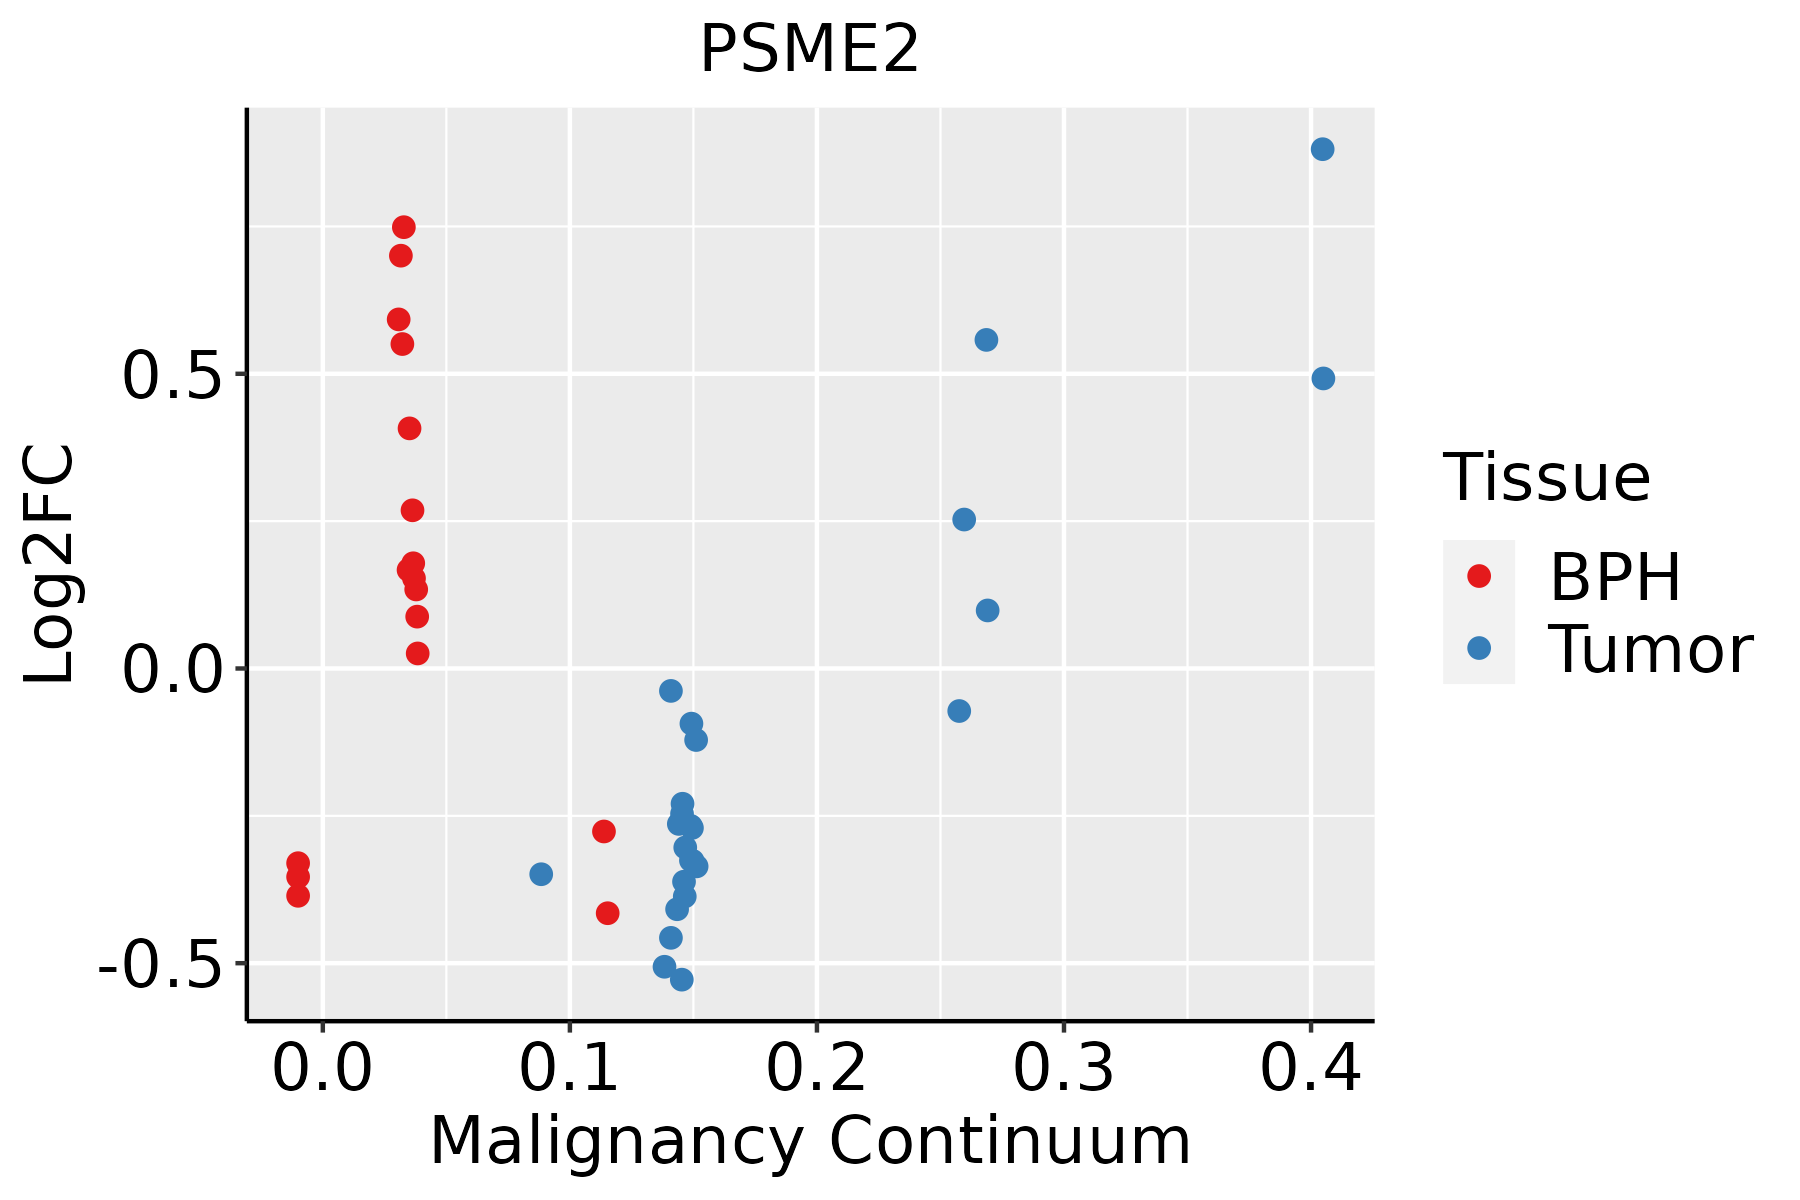 | BPH: Benign Prostatic Hyperplasia |
| Skin | 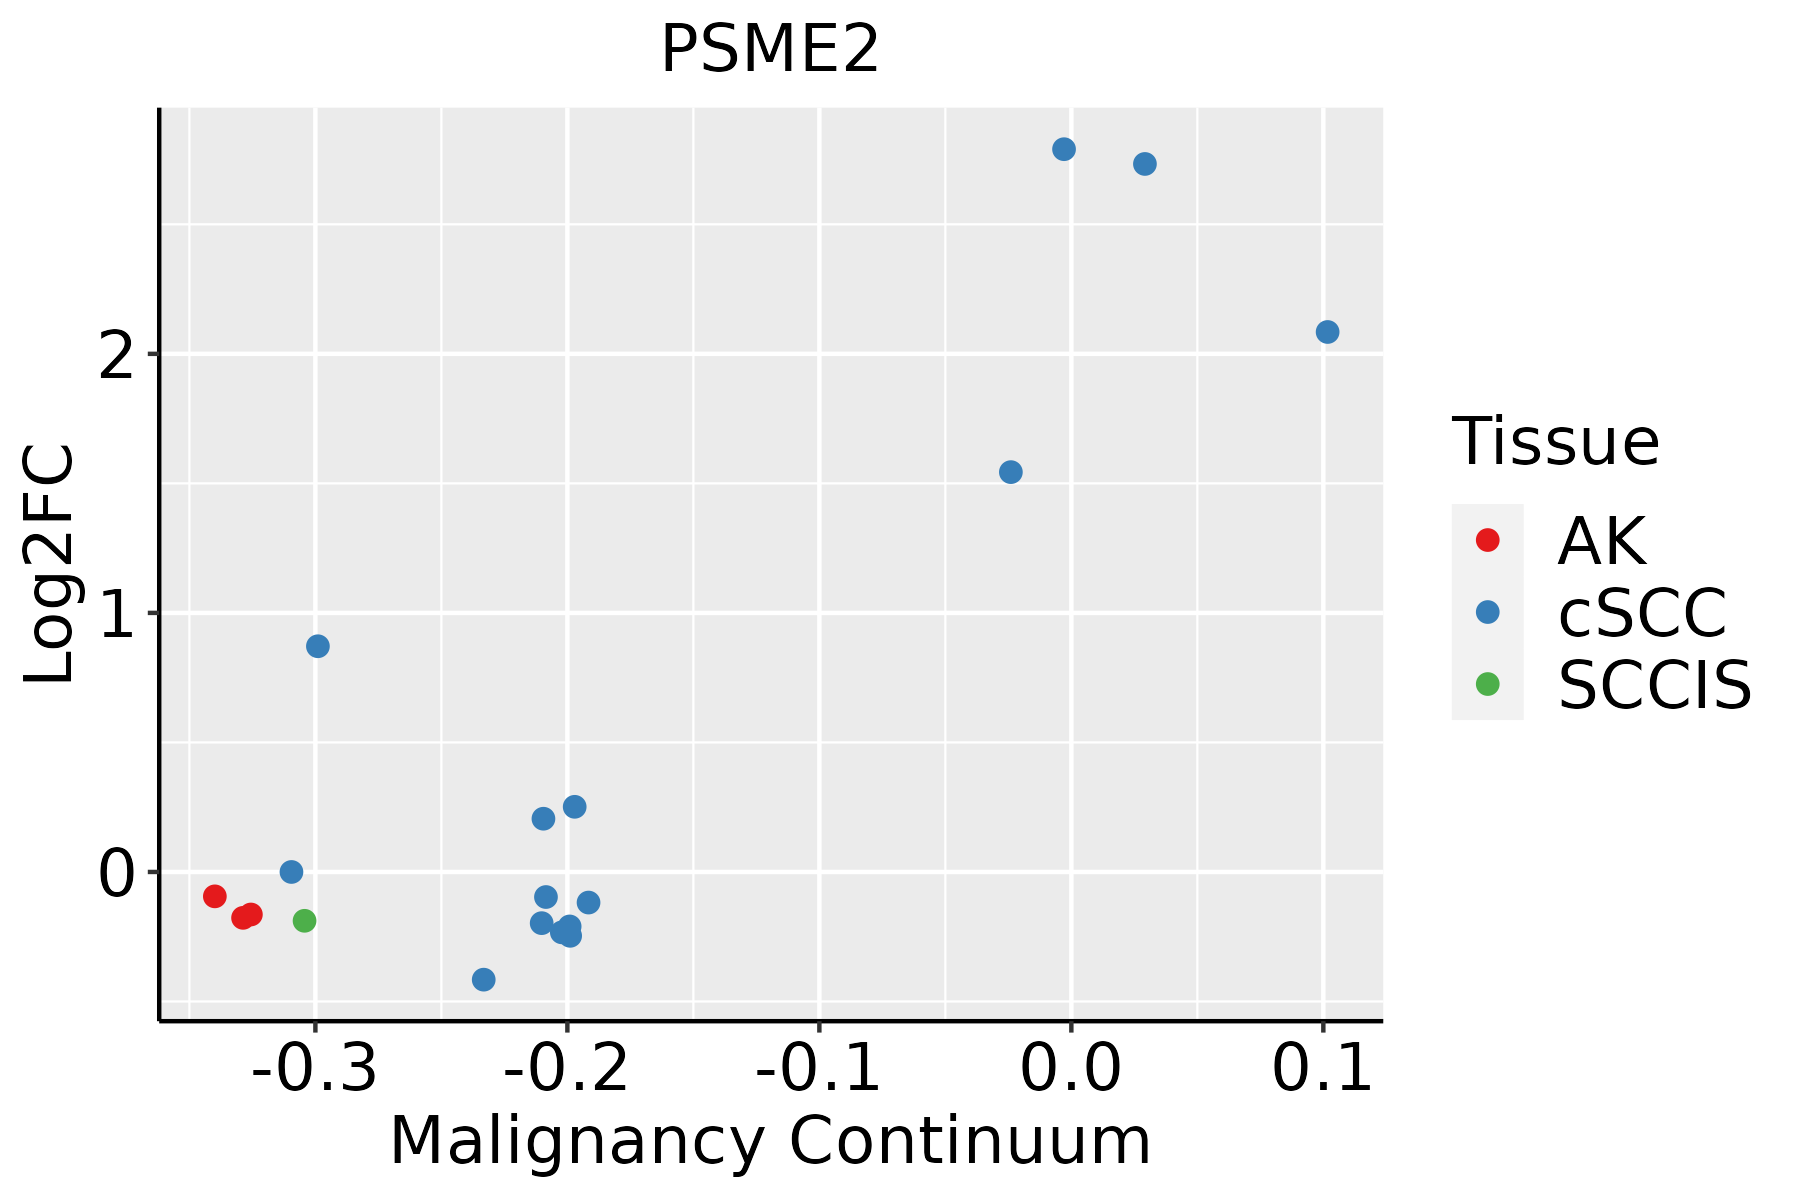 | AK: Actinic keratosis |
| cSCC: Cutaneous squamous cell carcinoma | ||
| SCCIS:squamous cell carcinoma in situ | ||
| Thyroid |  | ATC: Anaplastic thyroid cancer |
| HT: Hashimoto's thyroiditis | ||
| PTC: Papillary thyroid cancer |
| ∗log2FC in expression of this searched gene in stem-like cells from each diseased tissue sample relative to stem-like cells in normal samples in each tissue plotted against the malignancy continuum. Samples are colored based on if they are from different disease stage. |
Top |
Malignant transformation related pathway analysis |
| Find out the enriched GO biological processes and KEGG pathways involved in transition from healthy to precancer to cancer |
| Tissue | Disease Stage | Enriched GO biological Processes |
| Colorectum | AD |  |
| Colorectum | SER |  |
| Colorectum | MSS |  |
| Colorectum | MSI-H |  |
| Colorectum | FAP |  |
| ∗Top 15 enriched GO BP terms are showed in the bar plot of each disease state in each tissue. Each row represents a significant GO biological process which is colored according to the -log10(p.adjust). |
| Page: 1 2 3 4 5 6 7 8 9 |
| GO ID | Tissue | Disease Stage | Description | Gene Ratio | Bg Ratio | pvalue | p.adjust | Count |
| GO:00525479 | Breast | Precancer | regulation of peptidase activity | 71/1080 | 461/18723 | 2.72e-14 | 6.94e-12 | 71 |
| GO:00525489 | Breast | Precancer | regulation of endopeptidase activity | 67/1080 | 432/18723 | 1.06e-13 | 2.36e-11 | 67 |
| GO:00458629 | Breast | Precancer | positive regulation of proteolysis | 51/1080 | 372/18723 | 7.77e-09 | 5.70e-07 | 51 |
| GO:00109529 | Breast | Precancer | positive regulation of peptidase activity | 33/1080 | 197/18723 | 3.01e-08 | 1.89e-06 | 33 |
| GO:00104989 | Breast | Precancer | proteasomal protein catabolic process | 58/1080 | 490/18723 | 1.54e-07 | 8.05e-06 | 58 |
| GO:00109509 | Breast | Precancer | positive regulation of endopeptidase activity | 29/1080 | 179/18723 | 4.23e-07 | 1.90e-05 | 29 |
| GO:19033629 | Breast | Precancer | regulation of cellular protein catabolic process | 36/1080 | 255/18723 | 6.03e-07 | 2.55e-05 | 36 |
| GO:00421769 | Breast | Precancer | regulation of protein catabolic process | 47/1080 | 391/18723 | 1.50e-06 | 5.58e-05 | 47 |
| GO:19030509 | Breast | Precancer | regulation of proteolysis involved in cellular protein catabolic process | 31/1080 | 221/18723 | 4.10e-06 | 1.27e-04 | 31 |
| GO:00611369 | Breast | Precancer | regulation of proteasomal protein catabolic process | 24/1080 | 187/18723 | 1.99e-04 | 3.14e-03 | 24 |
| GO:005254714 | Breast | IDC | regulation of peptidase activity | 96/1434 | 461/18723 | 7.58e-20 | 6.15e-17 | 96 |
| GO:005254814 | Breast | IDC | regulation of endopeptidase activity | 88/1434 | 432/18723 | 1.20e-17 | 4.85e-15 | 88 |
| GO:004586214 | Breast | IDC | positive regulation of proteolysis | 66/1434 | 372/18723 | 9.76e-11 | 1.29e-08 | 66 |
| GO:001049814 | Breast | IDC | proteasomal protein catabolic process | 75/1434 | 490/18723 | 5.59e-09 | 4.41e-07 | 75 |
| GO:001095214 | Breast | IDC | positive regulation of peptidase activity | 40/1434 | 197/18723 | 1.04e-08 | 7.67e-07 | 40 |
| GO:004217614 | Breast | IDC | regulation of protein catabolic process | 63/1434 | 391/18723 | 1.32e-08 | 9.61e-07 | 63 |
| GO:190336214 | Breast | IDC | regulation of cellular protein catabolic process | 46/1434 | 255/18723 | 4.00e-08 | 2.68e-06 | 46 |
| GO:190305014 | Breast | IDC | regulation of proteolysis involved in cellular protein catabolic process | 41/1434 | 221/18723 | 9.77e-08 | 5.84e-06 | 41 |
| GO:001095013 | Breast | IDC | positive regulation of endopeptidase activity | 35/1434 | 179/18723 | 2.24e-07 | 1.17e-05 | 35 |
| GO:006113614 | Breast | IDC | regulation of proteasomal protein catabolic process | 33/1434 | 187/18723 | 5.24e-06 | 1.75e-04 | 33 |
| Page: 1 2 3 4 5 6 7 8 9 10 11 12 13 14 15 16 17 18 19 20 21 |
| Pathway ID | Tissue | Disease Stage | Description | Gene Ratio | Bg Ratio | pvalue | p.adjust | qvalue | Count |
| hsa0305010 | Breast | Precancer | Proteasome | 25/684 | 46/8465 | 4.35e-16 | 9.81e-15 | 7.52e-15 | 25 |
| hsa0461218 | Breast | Precancer | Antigen processing and presentation | 19/684 | 78/8465 | 9.61e-06 | 1.12e-04 | 8.62e-05 | 19 |
| hsa0305013 | Breast | Precancer | Proteasome | 25/684 | 46/8465 | 4.35e-16 | 9.81e-15 | 7.52e-15 | 25 |
| hsa0461219 | Breast | Precancer | Antigen processing and presentation | 19/684 | 78/8465 | 9.61e-06 | 1.12e-04 | 8.62e-05 | 19 |
| hsa0305023 | Breast | IDC | Proteasome | 26/867 | 46/8465 | 9.89e-15 | 2.47e-13 | 1.85e-13 | 26 |
| hsa0461223 | Breast | IDC | Antigen processing and presentation | 24/867 | 78/8465 | 4.61e-07 | 8.33e-06 | 6.23e-06 | 24 |
| hsa0305033 | Breast | IDC | Proteasome | 26/867 | 46/8465 | 9.89e-15 | 2.47e-13 | 1.85e-13 | 26 |
| hsa0461233 | Breast | IDC | Antigen processing and presentation | 24/867 | 78/8465 | 4.61e-07 | 8.33e-06 | 6.23e-06 | 24 |
| hsa0305042 | Breast | DCIS | Proteasome | 26/846 | 46/8465 | 5.46e-15 | 1.36e-13 | 9.99e-14 | 26 |
| hsa0461242 | Breast | DCIS | Antigen processing and presentation | 25/846 | 78/8465 | 6.75e-08 | 1.28e-06 | 9.45e-07 | 25 |
| hsa0305052 | Breast | DCIS | Proteasome | 26/846 | 46/8465 | 5.46e-15 | 1.36e-13 | 9.99e-14 | 26 |
| hsa0461252 | Breast | DCIS | Antigen processing and presentation | 25/846 | 78/8465 | 6.75e-08 | 1.28e-06 | 9.45e-07 | 25 |
| hsa0461220 | Cervix | CC | Antigen processing and presentation | 34/1267 | 78/8465 | 1.06e-09 | 2.14e-08 | 1.26e-08 | 34 |
| hsa0305014 | Cervix | CC | Proteasome | 16/1267 | 46/8465 | 6.69e-04 | 3.09e-03 | 1.83e-03 | 16 |
| hsa04612110 | Cervix | CC | Antigen processing and presentation | 34/1267 | 78/8465 | 1.06e-09 | 2.14e-08 | 1.26e-08 | 34 |
| hsa0305015 | Cervix | CC | Proteasome | 16/1267 | 46/8465 | 6.69e-04 | 3.09e-03 | 1.83e-03 | 16 |
| hsa0461243 | Cervix | N_HPV | Antigen processing and presentation | 20/349 | 78/8465 | 2.61e-11 | 1.42e-09 | 1.11e-09 | 20 |
| hsa0461253 | Cervix | N_HPV | Antigen processing and presentation | 20/349 | 78/8465 | 2.61e-11 | 1.42e-09 | 1.11e-09 | 20 |
| hsa03050 | Colorectum | AD | Proteasome | 29/2092 | 46/8465 | 3.87e-08 | 6.18e-07 | 3.94e-07 | 29 |
| hsa030501 | Colorectum | AD | Proteasome | 29/2092 | 46/8465 | 3.87e-08 | 6.18e-07 | 3.94e-07 | 29 |
| Page: 1 2 3 4 5 |
Top |
Cell-cell communication analysis |
| Identification of potential cell-cell interactions between two cell types and their ligand-receptor pairs for different disease states |
| Ligand | Receptor | LRpair | Pathway | Tissue | Disease Stage |
| Page: 1 |
Top |
Single-cell gene regulatory network inference analysis |
| Find out the significant the regulons (TFs) and the target genes of each regulon across cell types for different disease states |
| TF | Cell Type | Tissue | Disease Stage | Target Gene | RSS | Regulon Activity |
| ∗The dot plots of a searched regulon are shown for all cell subpopulations in each disease state of each tissue based on the regulon specific score inferred using pySCENIC and by calculating the average expression. |
| Page: 1 |
Top |
Somatic mutation of malignant transformation related genes |
| Annotation of somatic variants for genes involved in malignant transformation |
| Hugo Symbol | Variant Class | Variant Classification | dbSNP RS | HGVSc | HGVSp | HGVSp Short | SWISSPROT | BIOTYPE | SIFT | PolyPhen | Tumor Sample Barcode | Tissue | Histology | Sex | Age | Stage | Therapy Types | Drugs | Outcome |
| PSME2 | SNV | Missense_Mutation | c.562N>T | p.Arg188Trp | p.R188W | Q9UL46 | protein_coding | tolerated(0.1) | benign(0.015) | TCGA-D1-A167-01 | Endometrium | uterine corpus endometrioid carcinoma | Female | >=65 | I/II | Unknown | Unknown | SD | |
| PSME2 | SNV | Missense_Mutation | rs150829665 | c.511N>T | p.Arg171Cys | p.R171C | Q9UL46 | protein_coding | deleterious(0) | possibly_damaging(0.673) | TCGA-EO-A22X-01 | Endometrium | uterine corpus endometrioid carcinoma | Female | <65 | III/IV | Unspecific | Carboplatin | Complete Response |
| PSME2 | SNV | Missense_Mutation | novel | c.385N>C | p.Ile129Leu | p.I129L | Q9UL46 | protein_coding | deleterious(0) | benign(0.1) | TCGA-FI-A2D5-01 | Endometrium | uterine corpus endometrioid carcinoma | Female | <65 | III/IV | Chemotherapy | carboplatinum | PD |
| PSME2 | insertion | Frame_Shift_Ins | novel | c.350_351insCCTCTTAACACAGGTGATTACATGG | p.Lys117AsnfsTer25 | p.K117Nfs*25 | Q9UL46 | protein_coding | TCGA-AX-A06F-01 | Endometrium | uterine corpus endometrioid carcinoma | Female | <65 | III/IV | Chemotherapy | carboplatin | SD | ||
| PSME2 | SNV | Missense_Mutation | c.598N>T | p.Gly200Trp | p.G200W | Q9UL46 | protein_coding | tolerated(0.18) | possibly_damaging(0.7) | TCGA-50-5049-01 | Lung | lung adenocarcinoma | Male | >=65 | I/II | Unknown | Unknown | PD | |
| PSME2 | SNV | Missense_Mutation | novel | c.340N>G | p.Leu114Val | p.L114V | Q9UL46 | protein_coding | tolerated(0.21) | possibly_damaging(0.802) | TCGA-85-8481-01 | Lung | lung squamous cell carcinoma | Male | >=65 | I/II | Unknown | Unknown | SD |
| PSME2 | SNV | Missense_Mutation | rs768753844 | c.241N>C | p.Asp81His | p.D81H | Q9UL46 | protein_coding | deleterious(0.02) | possibly_damaging(0.735) | TCGA-CN-4723-01 | Oral cavity | head & neck squamous cell carcinoma | Male | >=65 | I/II | Unknown | Unknown | SD |
| PSME2 | SNV | Missense_Mutation | novel | c.166N>C | p.Asp56His | p.D56H | Q9UL46 | protein_coding | deleterious(0.03) | benign(0.376) | TCGA-QK-A6VB-01 | Oral cavity | head & neck squamous cell carcinoma | Male | >=65 | I/II | Unknown | Unknown | PD |
| PSME2 | SNV | Missense_Mutation | novel | c.578N>G | p.Glu193Gly | p.E193G | Q9UL46 | protein_coding | deleterious(0) | probably_damaging(0.999) | TCGA-VQ-A8P2-01 | Stomach | stomach adenocarcinoma | Male | >=65 | III/IV | Unspecific | Complete Response | |
| PSME2 | insertion | Frame_Shift_Ins | novel | c.498-1_498insCTTCTGGCAG | p.Lys166AsnfsTer31 | p.K166Nfs*31 | Q9UL46 | protein_coding | TCGA-FY-A3R6-01 | Thyroid | thyroid carcinoma | Female | <65 | I/II | Unknown | Unknown | SD |
| Page: 1 2 |
Top |
Related drugs of malignant transformation related genes |
| Identification of chemicals and drugs interact with genes involved in malignant transfromation |
| (DGIdb 4.0) |
| Entrez ID | Symbol | Category | Interaction Types | Drug Claim Name | Drug Name | PMIDs |
| 5721 | PSME2 | NA | inhibitor | CARFILZOMIB | CARFILZOMIB | |
| 5721 | PSME2 | NA | inhibitor | BORTEZOMIB | BORTEZOMIB |
| Page: 1 |

Copyright 2023-Present -The University of Texas Health Science Center at Houston |