| Tissue | Expression Dynamics | Abbreviation |
| Esophagus | 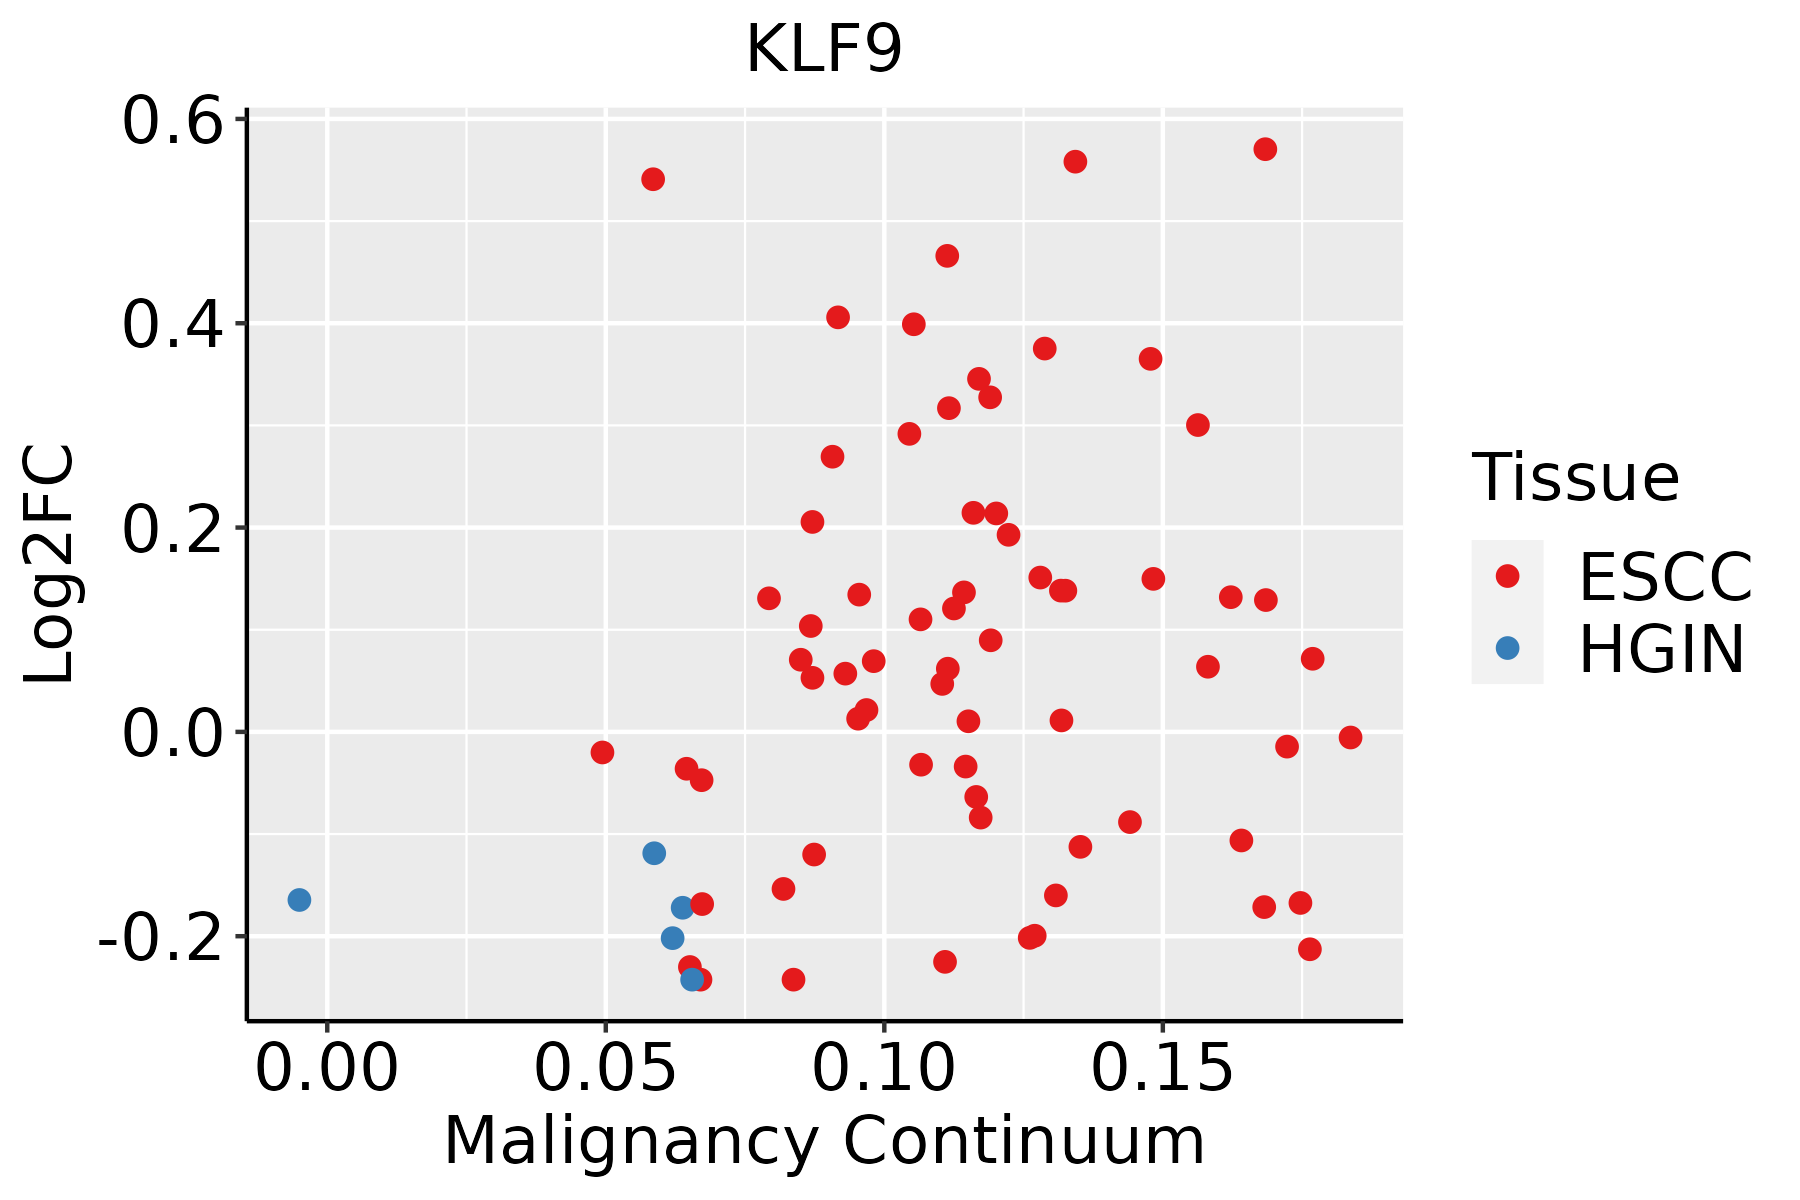 | ESCC: Esophageal squamous cell carcinoma |
| HGIN: High-grade intraepithelial neoplasias |
| LGIN: Low-grade intraepithelial neoplasias |
| Liver | 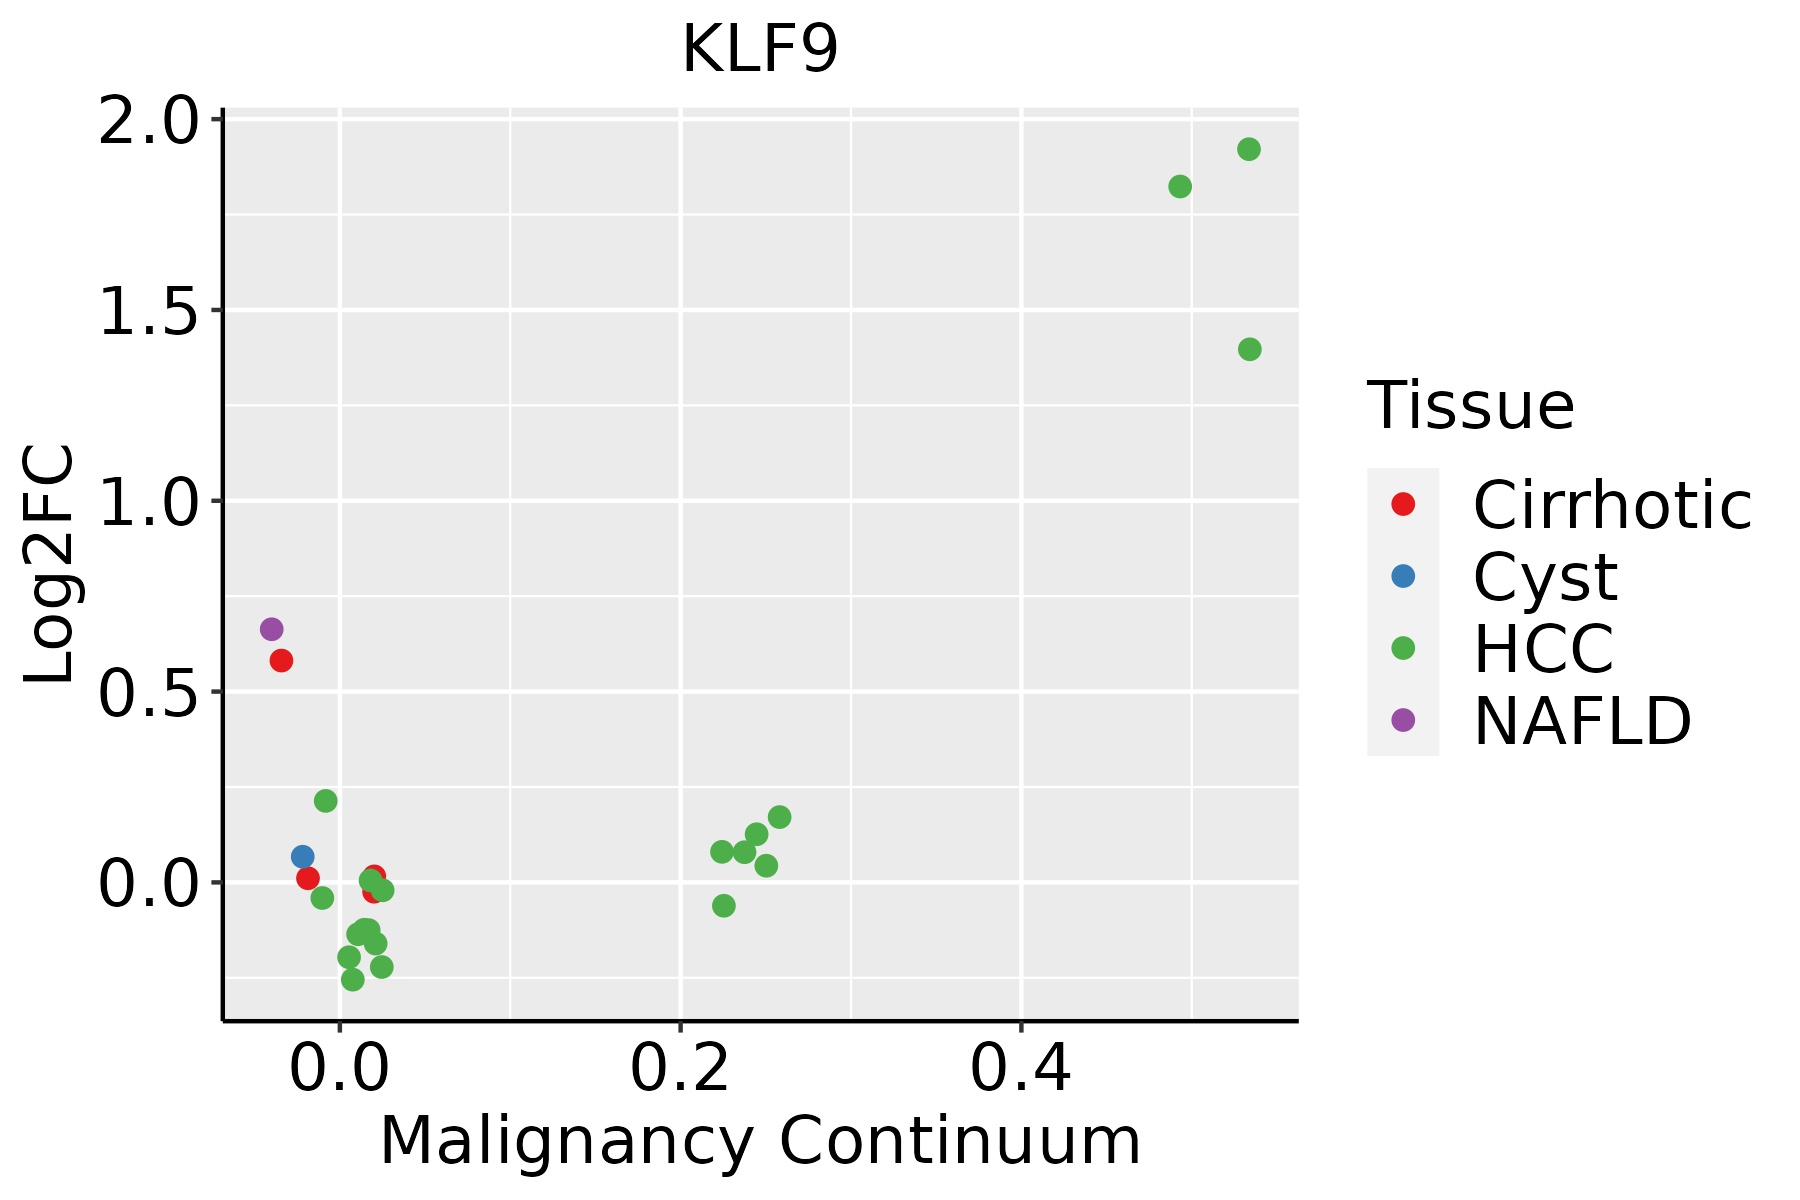 | HCC: Hepatocellular carcinoma |
| NAFLD: Non-alcoholic fatty liver disease |
| Prostate | 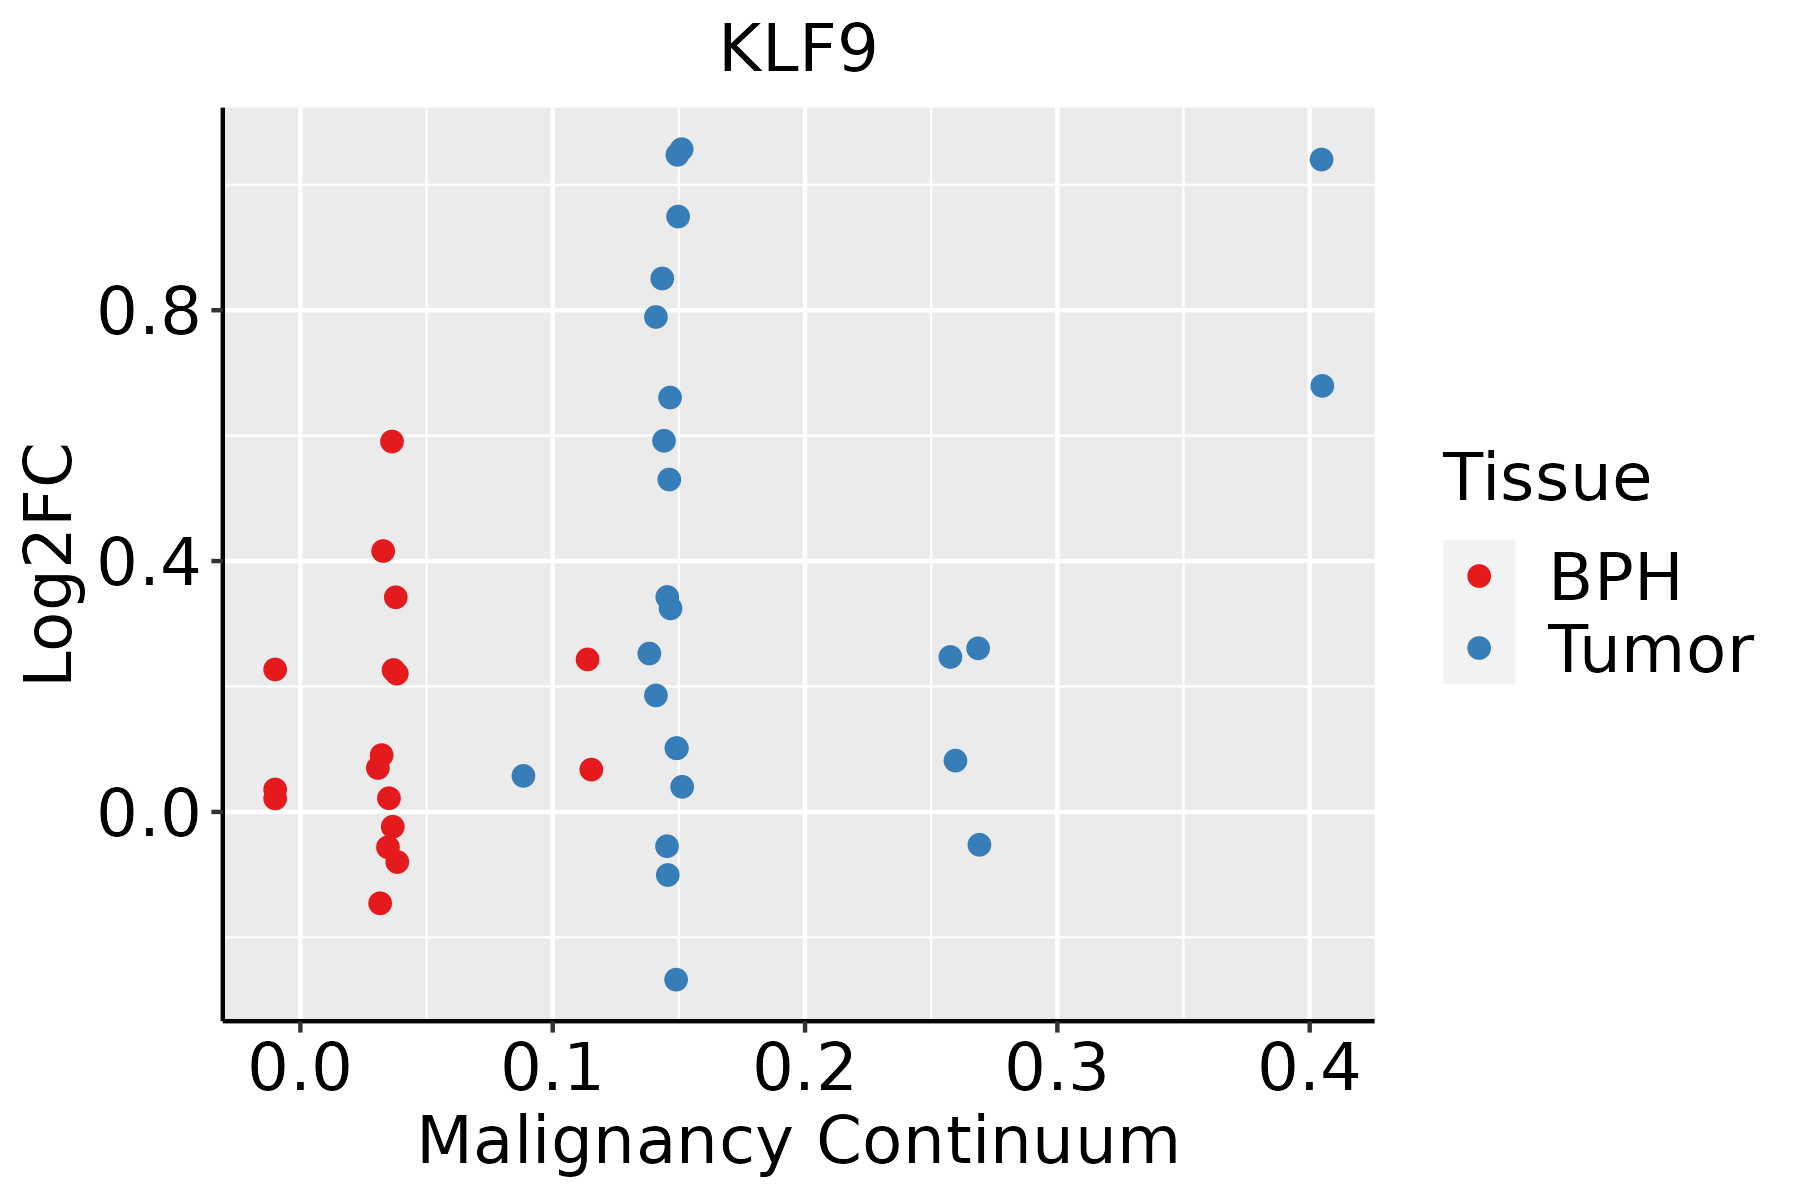 | BPH: Benign Prostatic Hyperplasia |
| Thyroid | 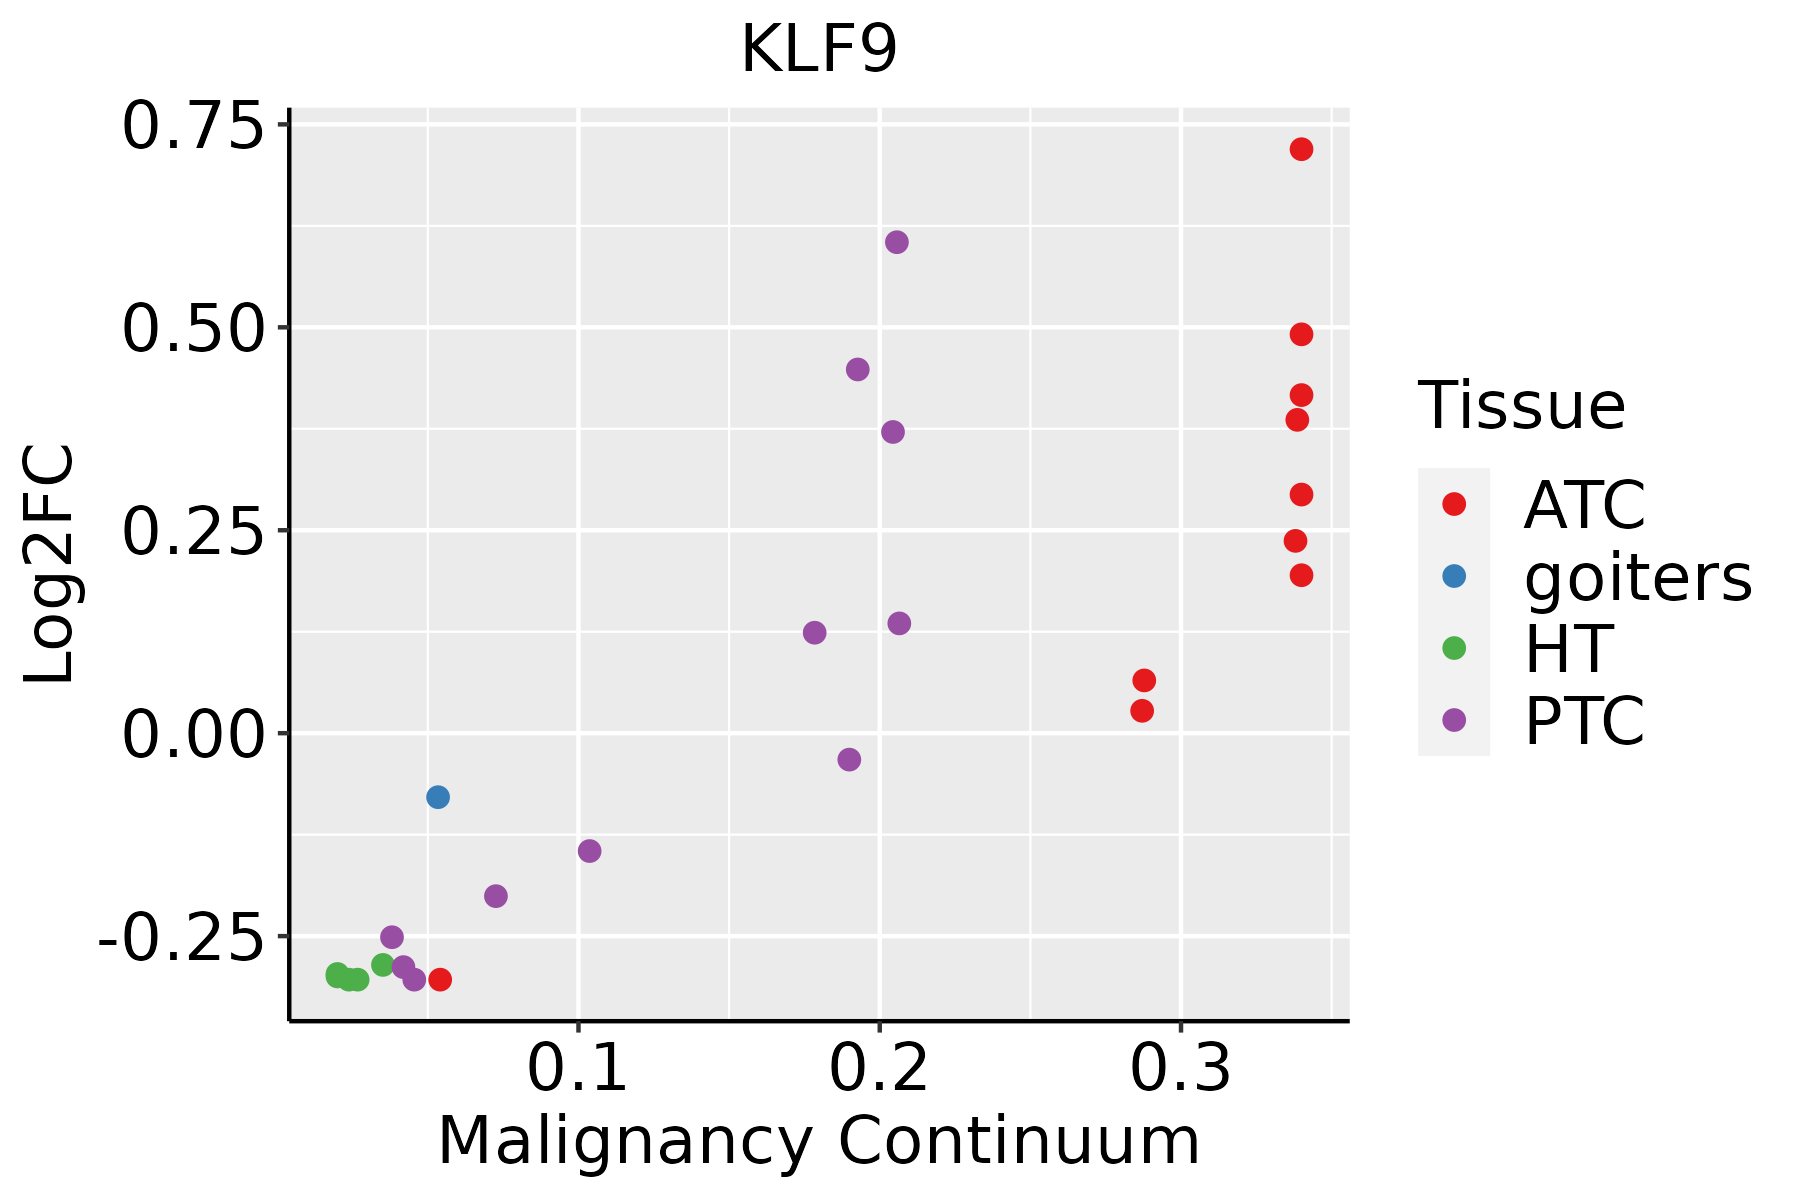 | ATC: Anaplastic thyroid cancer |
| HT: Hashimoto's thyroiditis |
| PTC: Papillary thyroid cancer |
| GO ID | Tissue | Disease Stage | Description | Gene Ratio | Bg Ratio | pvalue | p.adjust | Count |
| GO:0048545111 | Esophagus | ESCC | response to steroid hormone | 204/8552 | 339/18723 | 4.47e-08 | 8.11e-07 | 204 |
| GO:0071383110 | Esophagus | ESCC | cellular response to steroid hormone stimulus | 127/8552 | 204/18723 | 1.26e-06 | 1.55e-05 | 127 |
| GO:1901654111 | Esophagus | ESCC | response to ketone | 118/8552 | 194/18723 | 1.45e-05 | 1.31e-04 | 118 |
| GO:005067318 | Esophagus | ESCC | epithelial cell proliferation | 238/8552 | 437/18723 | 1.19e-04 | 8.20e-04 | 238 |
| GO:005067817 | Esophagus | ESCC | regulation of epithelial cell proliferation | 206/8552 | 381/18723 | 5.51e-04 | 3.02e-03 | 206 |
| GO:004851118 | Esophagus | ESCC | rhythmic process | 164/8552 | 298/18723 | 6.80e-04 | 3.57e-03 | 164 |
| GO:000762319 | Esophagus | ESCC | circadian rhythm | 119/8552 | 210/18723 | 8.47e-04 | 4.36e-03 | 119 |
| GO:19016556 | Esophagus | ESCC | cellular response to ketone | 59/8552 | 96/18723 | 1.32e-03 | 6.30e-03 | 59 |
| GO:003196020 | Esophagus | ESCC | response to corticosteroid | 95/8552 | 167/18723 | 2.27e-03 | 9.99e-03 | 95 |
| GO:005138420 | Esophagus | ESCC | response to glucocorticoid | 85/8552 | 148/18723 | 2.60e-03 | 1.11e-02 | 85 |
| GO:0097305111 | Esophagus | ESCC | response to alcohol | 138/8552 | 253/18723 | 2.70e-03 | 1.14e-02 | 138 |
| GO:00436167 | Esophagus | ESCC | keratinocyte proliferation | 30/8552 | 46/18723 | 5.91e-03 | 2.18e-02 | 30 |
| GO:00713849 | Esophagus | ESCC | cellular response to corticosteroid stimulus | 37/8552 | 61/18723 | 1.32e-02 | 4.31e-02 | 37 |
| GO:00485457 | Liver | NAFLD | response to steroid hormone | 75/1882 | 339/18723 | 3.44e-11 | 1.12e-08 | 75 |
| GO:00713836 | Liver | NAFLD | cellular response to steroid hormone stimulus | 48/1882 | 204/18723 | 1.50e-08 | 1.83e-06 | 48 |
| GO:00513846 | Liver | NAFLD | response to glucocorticoid | 36/1882 | 148/18723 | 3.88e-07 | 2.52e-05 | 36 |
| GO:00319606 | Liver | NAFLD | response to corticosteroid | 37/1882 | 167/18723 | 3.03e-06 | 1.23e-04 | 37 |
| GO:00485115 | Liver | NAFLD | rhythmic process | 56/1882 | 298/18723 | 3.03e-06 | 1.23e-04 | 56 |
| GO:00076236 | Liver | NAFLD | circadian rhythm | 42/1882 | 210/18723 | 1.06e-05 | 3.34e-04 | 42 |
| GO:00713854 | Liver | NAFLD | cellular response to glucocorticoid stimulus | 17/1882 | 56/18723 | 2.17e-05 | 6.02e-04 | 17 |
| TF | Cell Type | Tissue | Disease Stage | Target Gene | RSS | Regulon Activity |
| KLF9 | DC | Cervix | ADJ | ADIRF,C1R,TM4SF1, etc. | 1.54e-01 |  |
| KLF9 | M1MAC | Cervix | Healthy | ADIRF,C1R,TM4SF1, etc. | 1.99e-01 |  |
| KLF9 | GDT | Oral cavity | NEOLP | GREM1,COL15A1,MXRA7, etc. | 1.92e-01 |  |
| KLF9 | pDC | Prostate | BPH | C11orf96,ADAMTS4,ZNF430, etc. | 2.09e-01 |  |
| KLF9 | pDC | Prostate | Healthy | C11orf96,ADAMTS4,ZNF430, etc. | 2.57e-01 |  |
| KLF9 | pDC | Prostate | Tumor | C11orf96,ADAMTS4,ZNF430, etc. | 1.15e-01 |  |
| Hugo Symbol | Variant Class | Variant Classification | dbSNP RS | HGVSc | HGVSp | HGVSp Short | SWISSPROT | BIOTYPE | SIFT | PolyPhen | Tumor Sample Barcode | Tissue | Histology | Sex | Age | Stage | Therapy Types | Drugs | Outcome |
| KLF9 | SNV | Missense_Mutation | novel | c.97N>A | p.Ala33Thr | p.A33T | Q13886 | protein_coding | tolerated(0.2) | benign(0) | TCGA-AJ-A2QO-01 | Endometrium | uterine corpus endometrioid carcinoma | Female | >=65 | I/II | Unknown | Unknown | SD |
| KLF9 | SNV | Missense_Mutation | | c.484N>A | p.Ala162Thr | p.A162T | Q13886 | protein_coding | deleterious(0.01) | probably_damaging(0.981) | TCGA-AP-A059-01 | Endometrium | uterine corpus endometrioid carcinoma | Female | >=65 | I/II | Unknown | Unknown | SD |
| KLF9 | SNV | Missense_Mutation | novel | c.575N>A | p.Arg192His | p.R192H | Q13886 | protein_coding | deleterious(0) | probably_damaging(1) | TCGA-AP-A1DV-01 | Endometrium | uterine corpus endometrioid carcinoma | Female | <65 | I/II | Unknown | Unknown | SD |
| KLF9 | SNV | Missense_Mutation | | c.704N>T | p.Arg235Leu | p.R235L | Q13886 | protein_coding | deleterious(0) | probably_damaging(0.967) | TCGA-AP-A1E0-01 | Endometrium | uterine corpus endometrioid carcinoma | Female | <65 | III/IV | Chemotherapy | paclitaxel | SD |
| KLF9 | SNV | Missense_Mutation | | c.278T>C | p.Met93Thr | p.M93T | Q13886 | protein_coding | tolerated(0.57) | benign(0) | TCGA-AX-A06H-01 | Endometrium | uterine corpus endometrioid carcinoma | Female | <65 | III/IV | Chemotherapy | paclitaxel | SD |
| KLF9 | SNV | Missense_Mutation | rs866016516 | c.727N>A | p.Ala243Thr | p.A243T | Q13886 | protein_coding | tolerated_low_confidence(0.23) | benign(0) | TCGA-AX-A2HC-01 | Endometrium | uterine corpus endometrioid carcinoma | Female | <65 | III/IV | Chemotherapy | paclitaxel | PD |
| KLF9 | SNV | Missense_Mutation | novel | c.379N>A | p.Leu127Ile | p.L127I | Q13886 | protein_coding | tolerated(0.19) | benign(0.001) | TCGA-B5-A1MX-01 | Endometrium | uterine corpus endometrioid carcinoma | Female | <65 | I/II | Hormone Therapy | megace | SD |
| KLF9 | SNV | Missense_Mutation | novel | c.722C>T | p.Ala241Val | p.A241V | Q13886 | protein_coding | deleterious_low_confidence(0.02) | benign(0.011) | TCGA-B5-A3FC-01 | Endometrium | uterine corpus endometrioid carcinoma | Female | <65 | I/II | Unknown | Unknown | SD |
| KLF9 | SNV | Missense_Mutation | novel | c.524N>A | p.Cys175Tyr | p.C175Y | Q13886 | protein_coding | deleterious(0) | probably_damaging(1) | TCGA-BG-A220-01 | Endometrium | uterine corpus endometrioid carcinoma | Female | >=65 | I/II | Unknown | Unknown | SD |
| KLF9 | SNV | Missense_Mutation | novel | c.692N>A | p.Ser231Asn | p.S231N | Q13886 | protein_coding | tolerated(0.11) | benign(0.41) | TCGA-BG-A221-01 | Endometrium | uterine corpus endometrioid carcinoma | Female | >=65 | I/II | Unknown | Unknown | SD |


