
|
|||||
|
 | |
| |
| |
| |
| |
| |
|
Gene: JTB |
Gene summary for JTB |
| Gene information | Species | Human | Gene symbol | JTB | Gene ID | 10899 |
| Gene name | jumping translocation breakpoint | |
| Gene Alias | HJTB | |
| Cytomap | 1q21.3 | |
| Gene Type | protein-coding | GO ID | GO:0000278 | UniProtAcc | O76095 |
Top |
Malignant transformation analysis |
| Identification of the aberrant gene expression in precancerous and cancerous lesions by comparing the gene expression of stem-like cells in diseased tissues with normal stem cells |
| Entrez ID | Symbol | Replicates | Species | Organ | Tissue | Adj P-value | Log2FC | Malignancy |
| 10899 | JTB | GSM4909281 | Human | Breast | IDC | 4.94e-07 | 3.68e-01 | 0.21 |
| 10899 | JTB | GSM4909282 | Human | Breast | IDC | 8.55e-08 | 3.16e-01 | -0.0288 |
| 10899 | JTB | GSM4909285 | Human | Breast | IDC | 3.64e-10 | 3.94e-01 | 0.21 |
| 10899 | JTB | GSM4909286 | Human | Breast | IDC | 2.63e-03 | 7.51e-02 | 0.1081 |
| 10899 | JTB | GSM4909290 | Human | Breast | IDC | 2.18e-02 | 3.25e-01 | 0.2096 |
| 10899 | JTB | GSM4909291 | Human | Breast | IDC | 1.21e-04 | 3.89e-01 | 0.1753 |
| 10899 | JTB | GSM4909294 | Human | Breast | IDC | 3.04e-04 | -1.05e-02 | 0.2022 |
| 10899 | JTB | GSM4909295 | Human | Breast | IDC | 2.52e-07 | 4.77e-01 | 0.0898 |
| 10899 | JTB | GSM4909296 | Human | Breast | IDC | 1.09e-15 | 1.55e-01 | 0.1524 |
| 10899 | JTB | GSM4909297 | Human | Breast | IDC | 1.89e-17 | -2.20e-01 | 0.1517 |
| 10899 | JTB | GSM4909298 | Human | Breast | IDC | 3.99e-13 | 3.91e-01 | 0.1551 |
| 10899 | JTB | GSM4909302 | Human | Breast | IDC | 8.36e-07 | 2.62e-01 | 0.1545 |
| 10899 | JTB | GSM4909306 | Human | Breast | IDC | 1.42e-14 | 4.65e-01 | 0.1564 |
| 10899 | JTB | GSM4909307 | Human | Breast | IDC | 5.79e-24 | 5.04e-01 | 0.1569 |
| 10899 | JTB | GSM4909308 | Human | Breast | IDC | 1.16e-58 | 8.34e-01 | 0.158 |
| 10899 | JTB | GSM4909309 | Human | Breast | IDC | 4.82e-02 | 1.34e-01 | 0.0483 |
| 10899 | JTB | GSM4909311 | Human | Breast | IDC | 1.31e-43 | -4.98e-02 | 0.1534 |
| 10899 | JTB | GSM4909312 | Human | Breast | IDC | 5.72e-28 | 3.87e-01 | 0.1552 |
| 10899 | JTB | GSM4909313 | Human | Breast | IDC | 1.43e-15 | 4.30e-01 | 0.0391 |
| 10899 | JTB | GSM4909316 | Human | Breast | IDC | 1.57e-05 | 2.80e-01 | 0.21 |
| Page: 1 2 3 4 5 6 7 8 9 10 11 12 13 |
| Tissue | Expression Dynamics | Abbreviation |
| Breast |  | IDC: Invasive ductal carcinoma |
| DCIS: Ductal carcinoma in situ | ||
| Precancer(BRCA1-mut): Precancerous lesion from BRCA1 mutation carriers | ||
| Cervix | 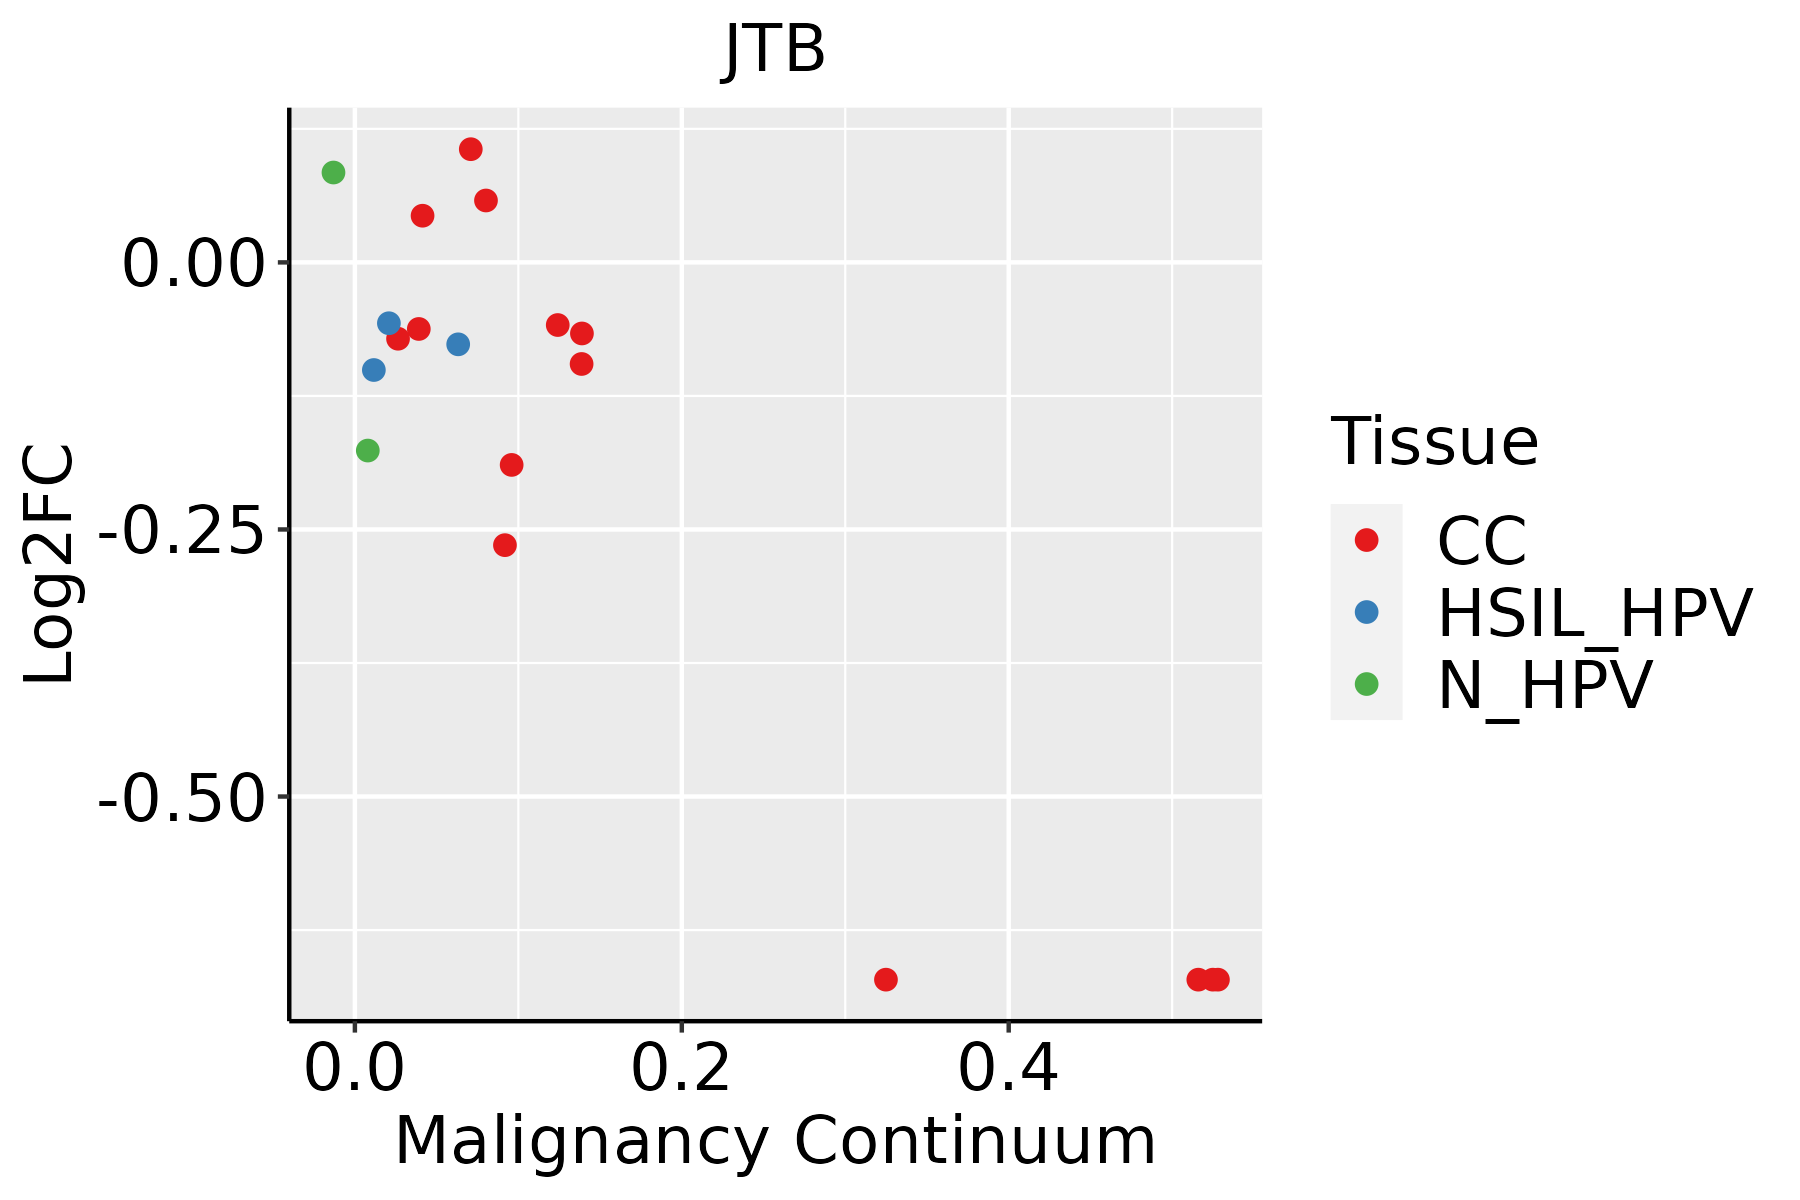 | CC: Cervix cancer |
| HSIL_HPV: HPV-infected high-grade squamous intraepithelial lesions | ||
| N_HPV: HPV-infected normal cervix | ||
| Colorectum (GSE201348) |  | FAP: Familial adenomatous polyposis |
| CRC: Colorectal cancer | ||
| Colorectum (HTA11) |  | AD: Adenomas |
| SER: Sessile serrated lesions | ||
| MSI-H: Microsatellite-high colorectal cancer | ||
| MSS: Microsatellite stable colorectal cancer | ||
| Endometrium | 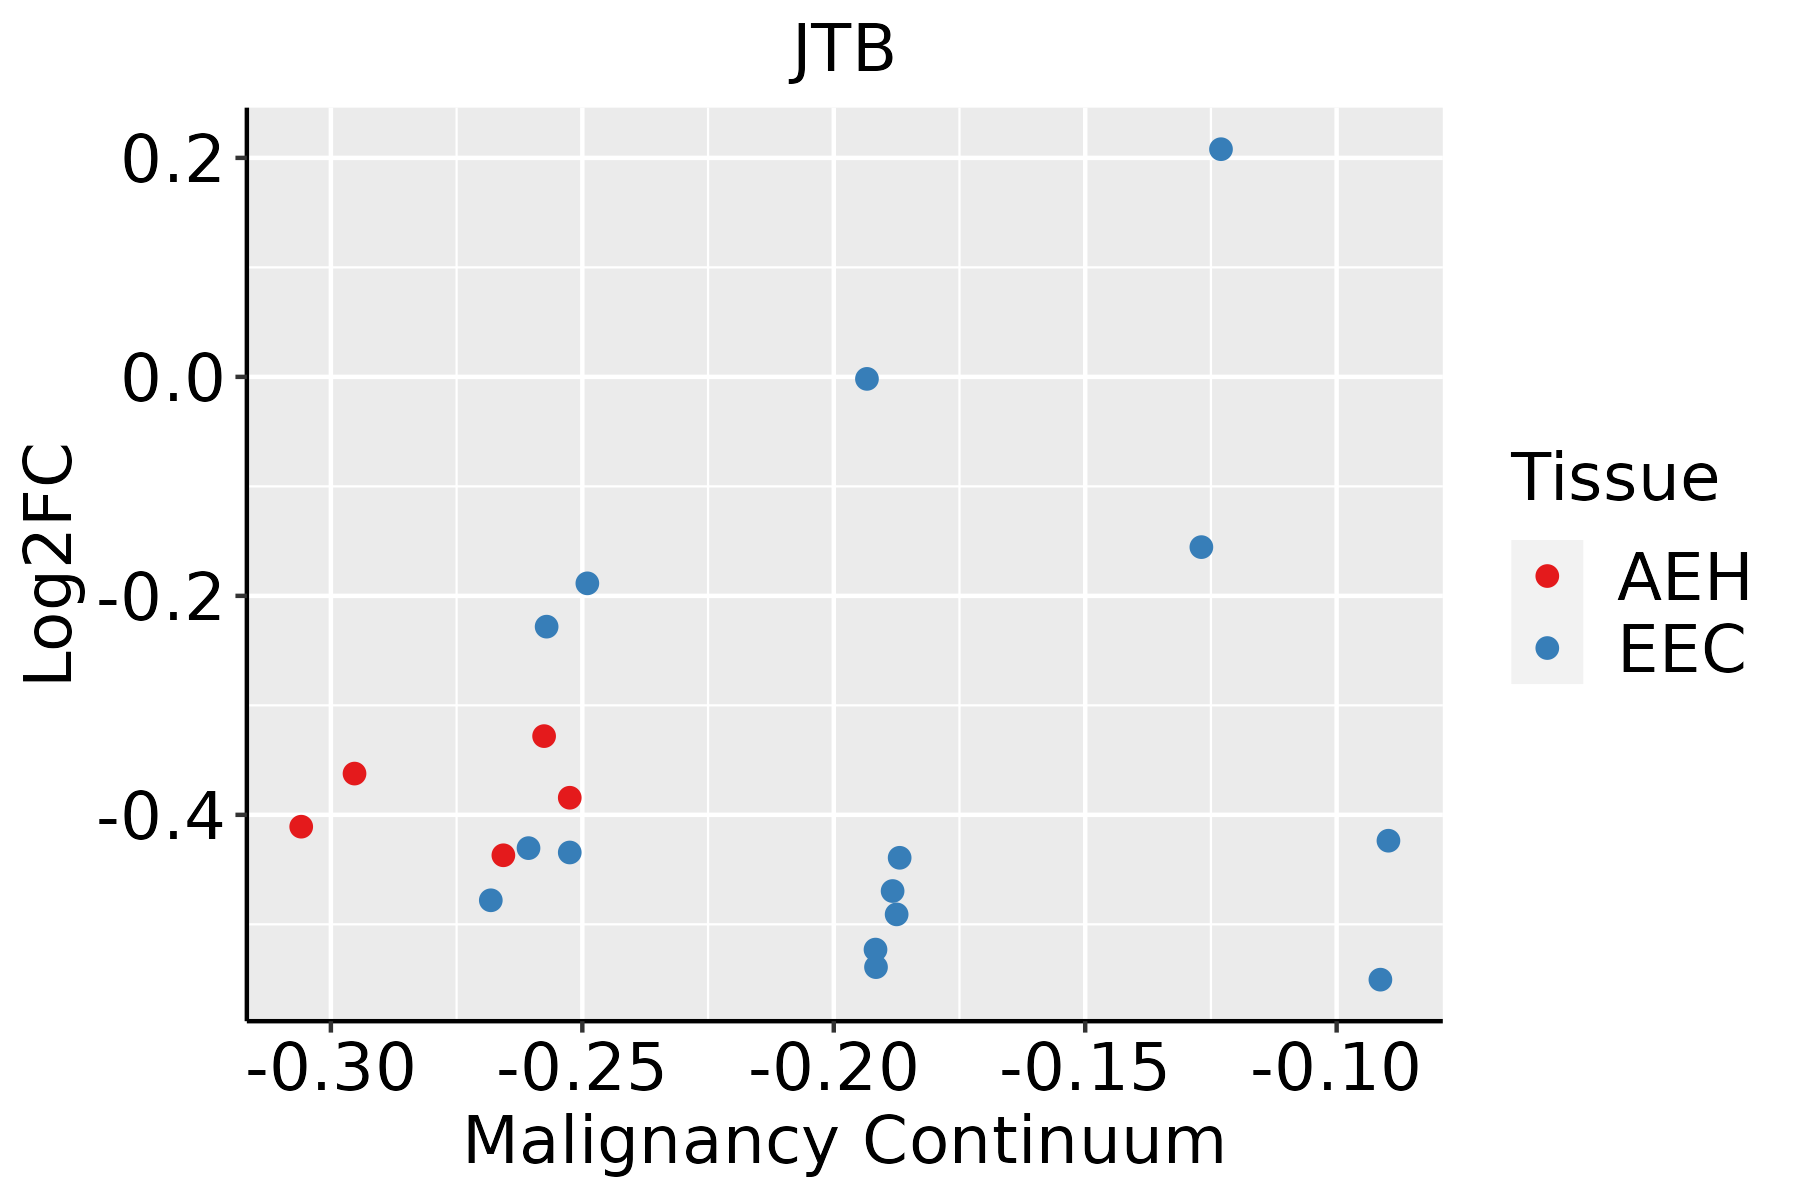 | AEH: Atypical endometrial hyperplasia |
| EEC: Endometrioid Cancer | ||
| Esophagus | 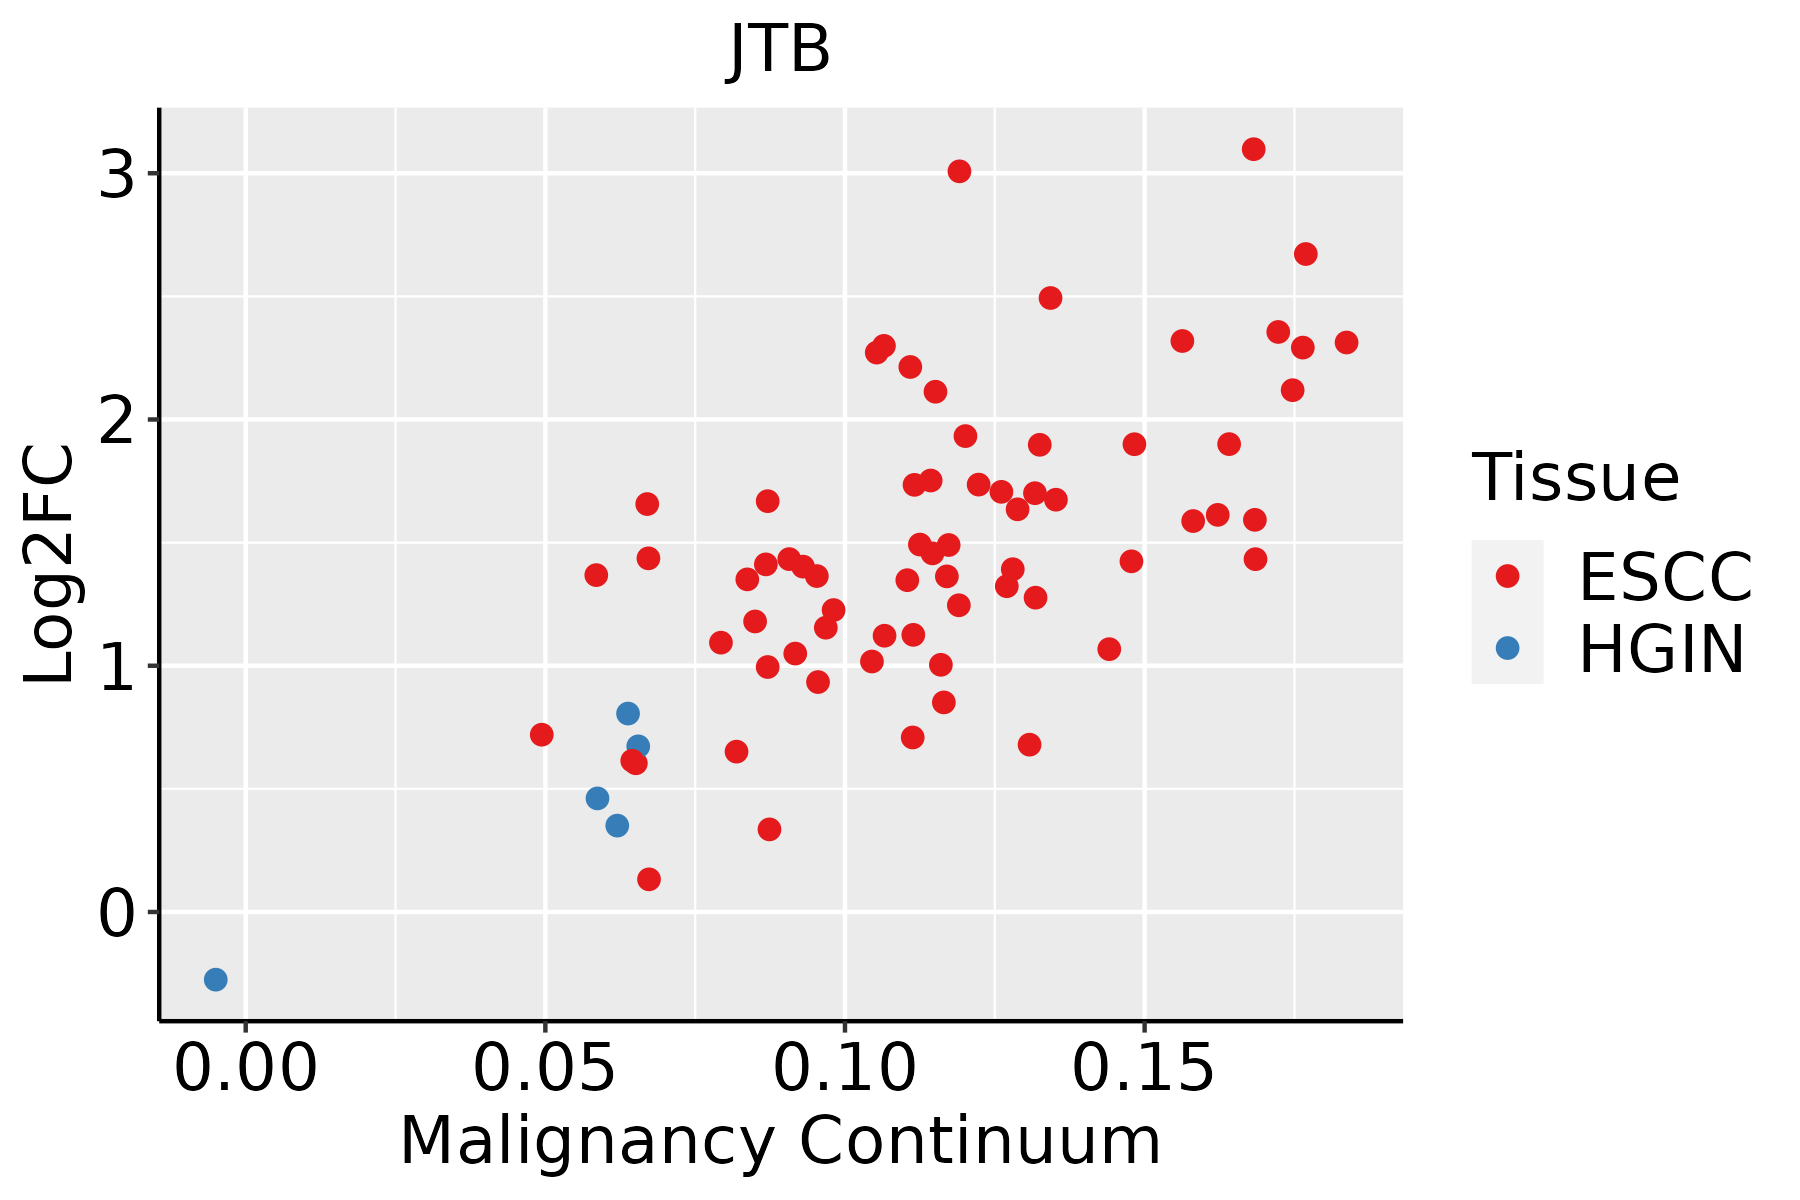 | ESCC: Esophageal squamous cell carcinoma |
| HGIN: High-grade intraepithelial neoplasias | ||
| LGIN: Low-grade intraepithelial neoplasias | ||
| Liver |  | HCC: Hepatocellular carcinoma |
| NAFLD: Non-alcoholic fatty liver disease | ||
| Oral Cavity |  | EOLP: Erosive Oral lichen planus |
| LP: leukoplakia | ||
| NEOLP: Non-erosive oral lichen planus | ||
| OSCC: Oral squamous cell carcinoma | ||
| Prostate |  | BPH: Benign Prostatic Hyperplasia |
| Skin | 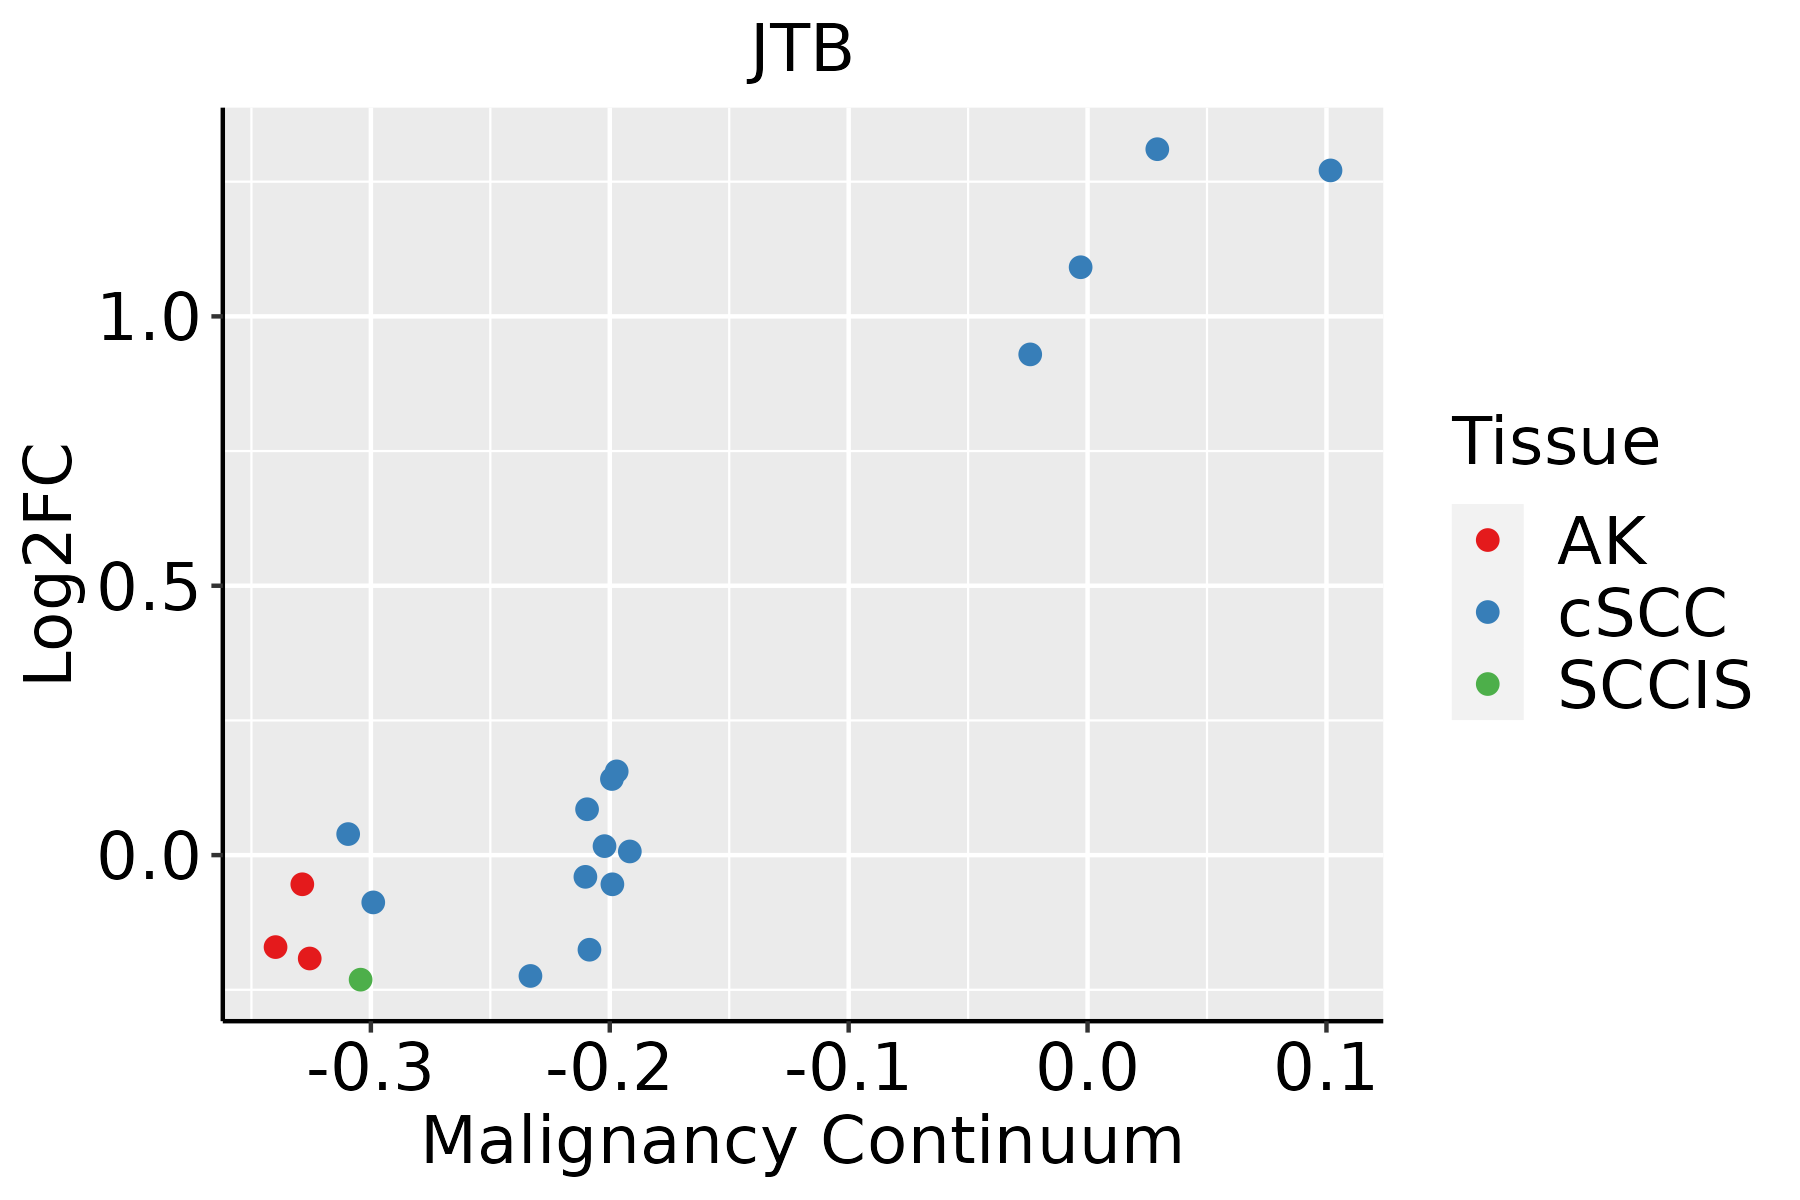 | AK: Actinic keratosis |
| cSCC: Cutaneous squamous cell carcinoma | ||
| SCCIS:squamous cell carcinoma in situ | ||
| Thyroid |  | ATC: Anaplastic thyroid cancer |
| HT: Hashimoto's thyroiditis | ||
| PTC: Papillary thyroid cancer |
| ∗log2FC in expression of this searched gene in stem-like cells from each diseased tissue sample relative to stem-like cells in normal samples in each tissue plotted against the malignancy continuum. Samples are colored based on if they are from different disease stage. |
Top |
Malignant transformation related pathway analysis |
| Find out the enriched GO biological processes and KEGG pathways involved in transition from healthy to precancer to cancer |
| Tissue | Disease Stage | Enriched GO biological Processes |
| Colorectum | AD |  |
| Colorectum | SER |  |
| Colorectum | MSS |  |
| Colorectum | MSI-H |  |
| Colorectum | FAP |  |
| ∗Top 15 enriched GO BP terms are showed in the bar plot of each disease state in each tissue. Each row represents a significant GO biological process which is colored according to the -log10(p.adjust). |
| Page: 1 2 3 4 5 6 7 8 9 |
| GO ID | Tissue | Disease Stage | Description | Gene Ratio | Bg Ratio | pvalue | p.adjust | Count |
| GO:00336749 | Breast | Precancer | positive regulation of kinase activity | 42/1080 | 467/18723 | 2.94e-03 | 2.54e-02 | 42 |
| GO:003367410 | Cervix | CC | positive regulation of kinase activity | 101/2311 | 467/18723 | 8.66e-09 | 7.22e-07 | 101 |
| GO:00458608 | Cervix | CC | positive regulation of protein kinase activity | 85/2311 | 386/18723 | 5.61e-08 | 3.29e-06 | 85 |
| GO:00009107 | Cervix | CC | cytokinesis | 37/2311 | 173/18723 | 5.40e-04 | 5.23e-03 | 37 |
| GO:004586023 | Cervix | N_HPV | positive regulation of protein kinase activity | 22/534 | 386/18723 | 1.73e-03 | 1.75e-02 | 22 |
| GO:003367422 | Cervix | N_HPV | positive regulation of kinase activity | 25/534 | 467/18723 | 2.05e-03 | 1.98e-02 | 25 |
| GO:0000910 | Colorectum | AD | cytokinesis | 59/3918 | 173/18723 | 3.74e-05 | 6.75e-04 | 59 |
| GO:0033674 | Colorectum | AD | positive regulation of kinase activity | 131/3918 | 467/18723 | 1.28e-04 | 1.85e-03 | 131 |
| GO:0061640 | Colorectum | AD | cytoskeleton-dependent cytokinesis | 37/3918 | 100/18723 | 1.58e-04 | 2.20e-03 | 37 |
| GO:0045860 | Colorectum | AD | positive regulation of protein kinase activity | 107/3918 | 386/18723 | 8.01e-04 | 7.92e-03 | 107 |
| GO:0000281 | Colorectum | AD | mitotic cytokinesis | 25/3918 | 71/18723 | 3.77e-03 | 2.65e-02 | 25 |
| GO:00009101 | Colorectum | SER | cytokinesis | 45/2897 | 173/18723 | 2.28e-04 | 3.93e-03 | 45 |
| GO:00616401 | Colorectum | SER | cytoskeleton-dependent cytokinesis | 29/2897 | 100/18723 | 4.25e-04 | 6.25e-03 | 29 |
| GO:00336741 | Colorectum | SER | positive regulation of kinase activity | 95/2897 | 467/18723 | 2.62e-03 | 2.41e-02 | 95 |
| GO:00458601 | Colorectum | SER | positive regulation of protein kinase activity | 79/2897 | 386/18723 | 4.85e-03 | 3.79e-02 | 79 |
| GO:00336742 | Colorectum | MSS | positive regulation of kinase activity | 122/3467 | 467/18723 | 2.50e-05 | 5.21e-04 | 122 |
| GO:00458602 | Colorectum | MSS | positive regulation of protein kinase activity | 102/3467 | 386/18723 | 6.93e-05 | 1.20e-03 | 102 |
| GO:00009102 | Colorectum | MSS | cytokinesis | 49/3467 | 173/18723 | 1.02e-03 | 1.02e-02 | 49 |
| GO:00002811 | Colorectum | MSS | mitotic cytokinesis | 23/3467 | 71/18723 | 3.55e-03 | 2.63e-02 | 23 |
| GO:00336743 | Colorectum | MSI-H | positive regulation of kinase activity | 53/1319 | 467/18723 | 3.99e-04 | 8.98e-03 | 53 |
| Page: 1 2 3 4 |
| Pathway ID | Tissue | Disease Stage | Description | Gene Ratio | Bg Ratio | pvalue | p.adjust | qvalue | Count |
| Page: 1 |
Top |
Cell-cell communication analysis |
| Identification of potential cell-cell interactions between two cell types and their ligand-receptor pairs for different disease states |
| Ligand | Receptor | LRpair | Pathway | Tissue | Disease Stage |
| Page: 1 |
Top |
Single-cell gene regulatory network inference analysis |
| Find out the significant the regulons (TFs) and the target genes of each regulon across cell types for different disease states |
| TF | Cell Type | Tissue | Disease Stage | Target Gene | RSS | Regulon Activity |
| ∗The dot plots of a searched regulon are shown for all cell subpopulations in each disease state of each tissue based on the regulon specific score inferred using pySCENIC and by calculating the average expression. |
| Page: 1 |
Top |
Somatic mutation of malignant transformation related genes |
| Annotation of somatic variants for genes involved in malignant transformation |
| Hugo Symbol | Variant Class | Variant Classification | dbSNP RS | HGVSc | HGVSp | HGVSp Short | SWISSPROT | BIOTYPE | SIFT | PolyPhen | Tumor Sample Barcode | Tissue | Histology | Sex | Age | Stage | Therapy Types | Drugs | Outcome |
| JTB | SNV | Missense_Mutation | rs747839326 | c.328G>A | p.Glu110Lys | p.E110K | O76095 | protein_coding | deleterious(0.01) | probably_damaging(0.99) | TCGA-KK-A7B4-01 | Prostate | prostate adenocarcinoma | Male | <65 | 9 | Hormone Therapy | leuprolide | PD |
| Page: 1 2 |
Top |
Related drugs of malignant transformation related genes |
| Identification of chemicals and drugs interact with genes involved in malignant transfromation |
| (DGIdb 4.0) |
| Entrez ID | Symbol | Category | Interaction Types | Drug Claim Name | Drug Name | PMIDs |
| Page: 1 |

Copyright 2023-Present -The University of Texas Health Science Center at Houston |