
|
|||||
|
 | |
| |
| |
| |
| |
| |
|
Gene: ISCU |
Gene summary for ISCU |
| Gene information | Species | Human | Gene symbol | ISCU | Gene ID | 23479 |
| Gene name | iron-sulfur cluster assembly enzyme | |
| Gene Alias | 2310020H20Rik | |
| Cytomap | 12q23.3 | |
| Gene Type | protein-coding | GO ID | GO:0000041 | UniProtAcc | B3KQ30 |
Top |
Malignant transformation analysis |
| Identification of the aberrant gene expression in precancerous and cancerous lesions by comparing the gene expression of stem-like cells in diseased tissues with normal stem cells |
| Entrez ID | Symbol | Replicates | Species | Organ | Tissue | Adj P-value | Log2FC | Malignancy |
| 23479 | ISCU | HTA11_3410_2000001011 | Human | Colorectum | AD | 2.65e-09 | 3.05e-01 | 0.0155 |
| 23479 | ISCU | HTA11_2487_2000001011 | Human | Colorectum | SER | 2.48e-04 | 3.85e-01 | -0.1808 |
| 23479 | ISCU | HTA11_1938_2000001011 | Human | Colorectum | AD | 9.41e-11 | 6.12e-01 | -0.0811 |
| 23479 | ISCU | HTA11_78_2000001011 | Human | Colorectum | AD | 7.92e-06 | 3.54e-01 | -0.1088 |
| 23479 | ISCU | HTA11_347_2000001011 | Human | Colorectum | AD | 2.83e-23 | 5.99e-01 | -0.1954 |
| 23479 | ISCU | HTA11_411_2000001011 | Human | Colorectum | SER | 2.37e-07 | 9.83e-01 | -0.2602 |
| 23479 | ISCU | HTA11_83_2000001011 | Human | Colorectum | SER | 4.03e-05 | 3.91e-01 | -0.1526 |
| 23479 | ISCU | HTA11_696_2000001011 | Human | Colorectum | AD | 1.52e-11 | 3.91e-01 | -0.1464 |
| 23479 | ISCU | HTA11_866_2000001011 | Human | Colorectum | AD | 1.15e-06 | 3.03e-01 | -0.1001 |
| 23479 | ISCU | HTA11_1391_2000001011 | Human | Colorectum | AD | 1.86e-17 | 7.25e-01 | -0.059 |
| 23479 | ISCU | HTA11_2992_2000001011 | Human | Colorectum | SER | 1.40e-02 | 5.03e-01 | -0.1706 |
| 23479 | ISCU | HTA11_5212_2000001011 | Human | Colorectum | AD | 1.55e-06 | 4.87e-01 | -0.2061 |
| 23479 | ISCU | HTA11_7862_2000001011 | Human | Colorectum | AD | 3.23e-06 | 4.35e-01 | -0.0179 |
| 23479 | ISCU | HTA11_866_3004761011 | Human | Colorectum | AD | 2.13e-15 | 4.87e-01 | 0.096 |
| 23479 | ISCU | HTA11_4255_2000001011 | Human | Colorectum | SER | 3.93e-05 | 4.52e-01 | 0.0446 |
| 23479 | ISCU | HTA11_8622_2000001021 | Human | Colorectum | SER | 4.07e-08 | 5.78e-01 | 0.0528 |
| 23479 | ISCU | HTA11_7663_2000001011 | Human | Colorectum | SER | 1.61e-05 | 6.42e-01 | 0.0131 |
| 23479 | ISCU | HTA11_10623_2000001011 | Human | Colorectum | AD | 2.47e-02 | 2.90e-01 | -0.0177 |
| 23479 | ISCU | HTA11_6801_2000001011 | Human | Colorectum | SER | 5.92e-06 | 6.52e-01 | 0.0171 |
| 23479 | ISCU | HTA11_10711_2000001011 | Human | Colorectum | AD | 2.16e-02 | 2.91e-01 | 0.0338 |
| Page: 1 2 3 4 5 6 7 8 9 |
| Tissue | Expression Dynamics | Abbreviation |
| Colorectum (GSE201348) |  | FAP: Familial adenomatous polyposis |
| CRC: Colorectal cancer | ||
| Colorectum (HTA11) |  | AD: Adenomas |
| SER: Sessile serrated lesions | ||
| MSI-H: Microsatellite-high colorectal cancer | ||
| MSS: Microsatellite stable colorectal cancer | ||
| Endometrium | 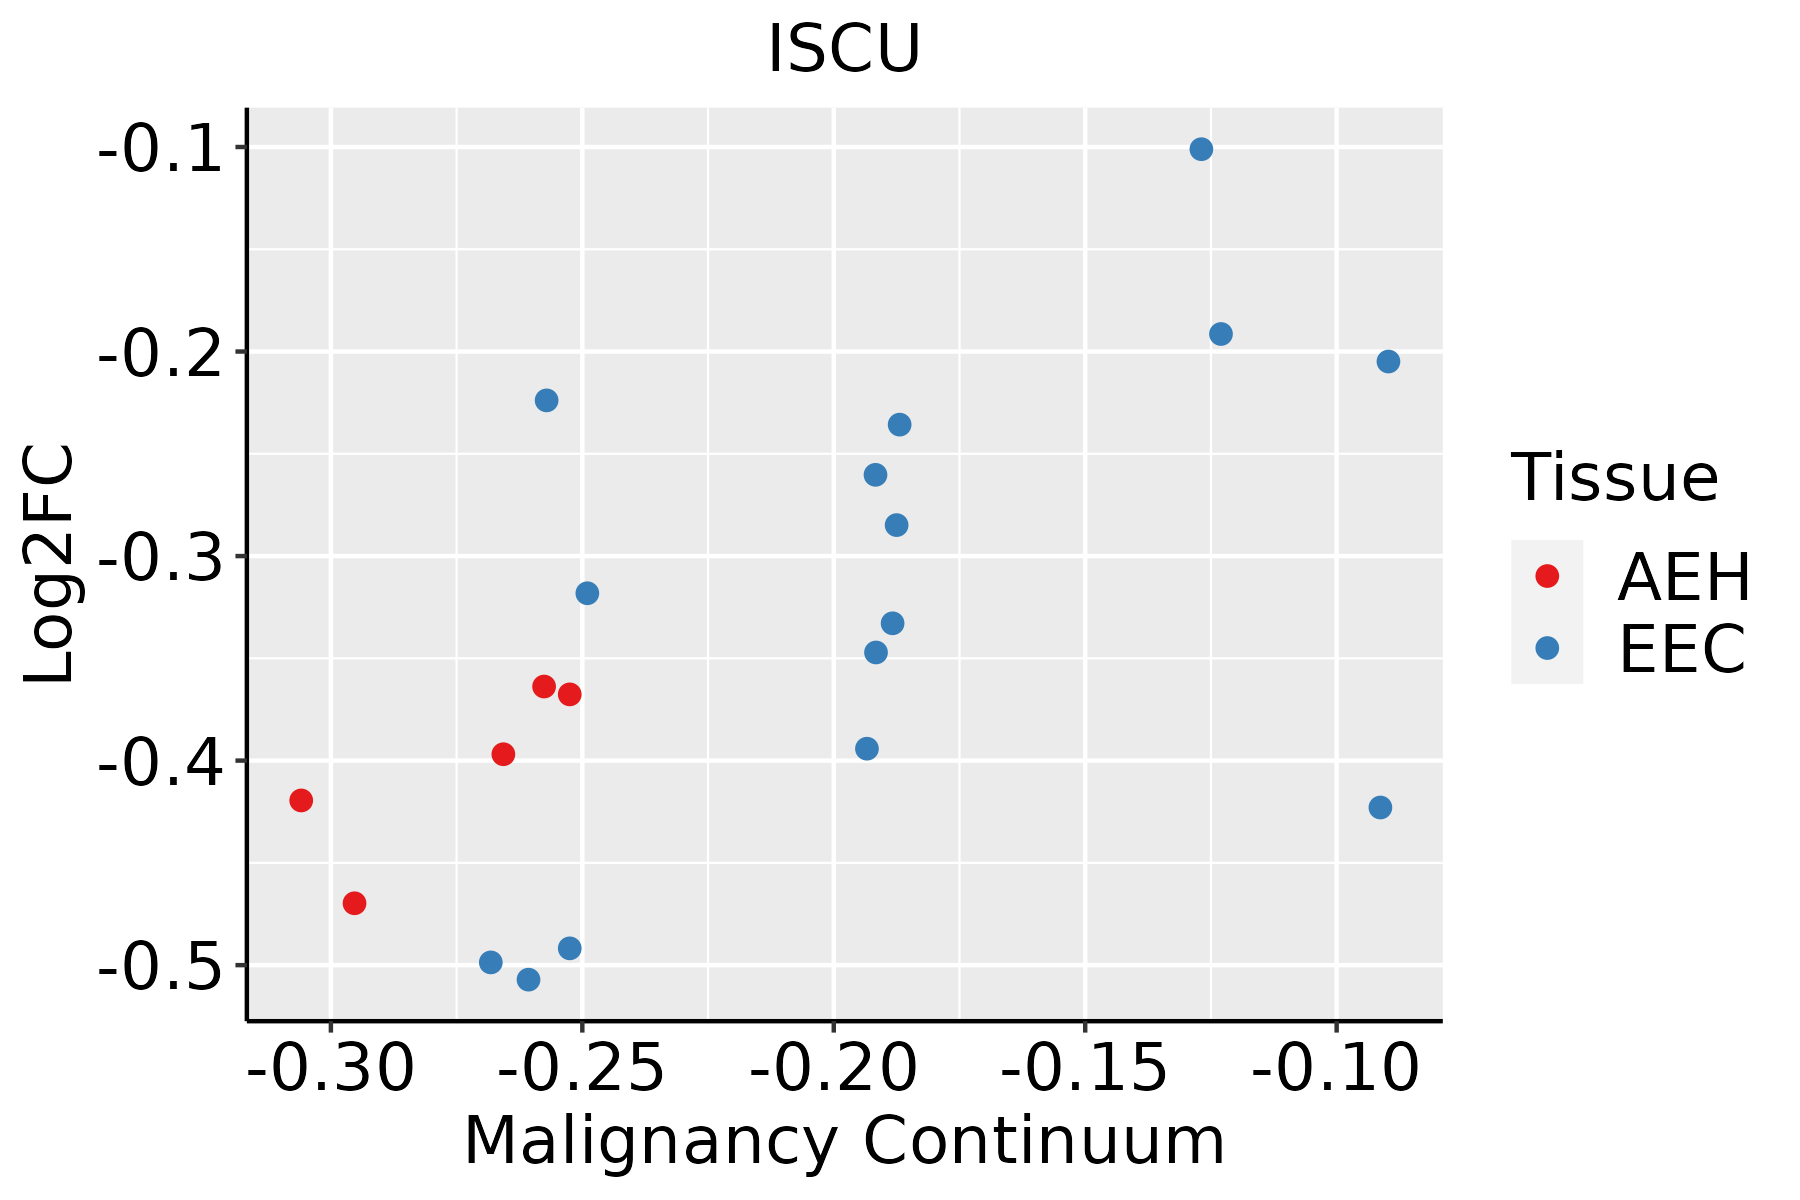 | AEH: Atypical endometrial hyperplasia |
| EEC: Endometrioid Cancer | ||
| Esophagus | 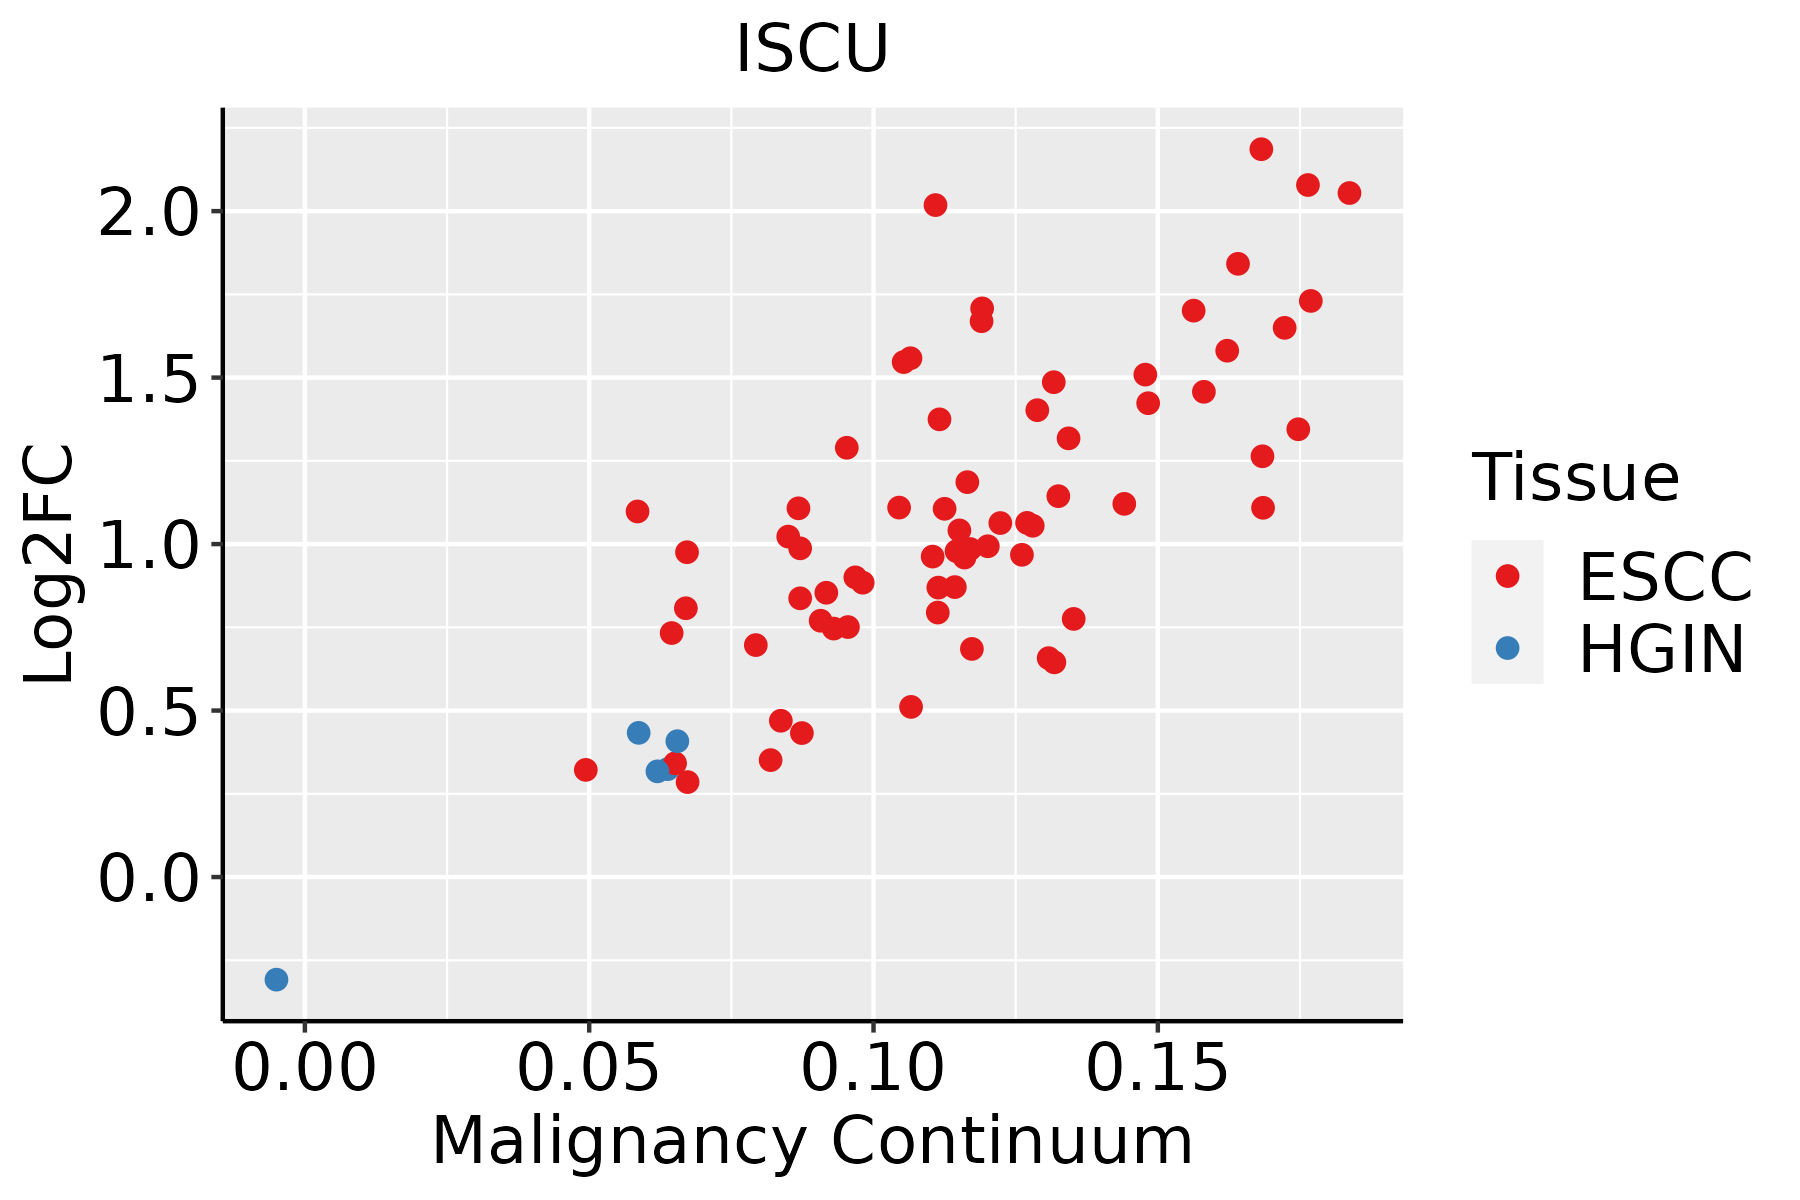 | ESCC: Esophageal squamous cell carcinoma |
| HGIN: High-grade intraepithelial neoplasias | ||
| LGIN: Low-grade intraepithelial neoplasias | ||
| Liver | 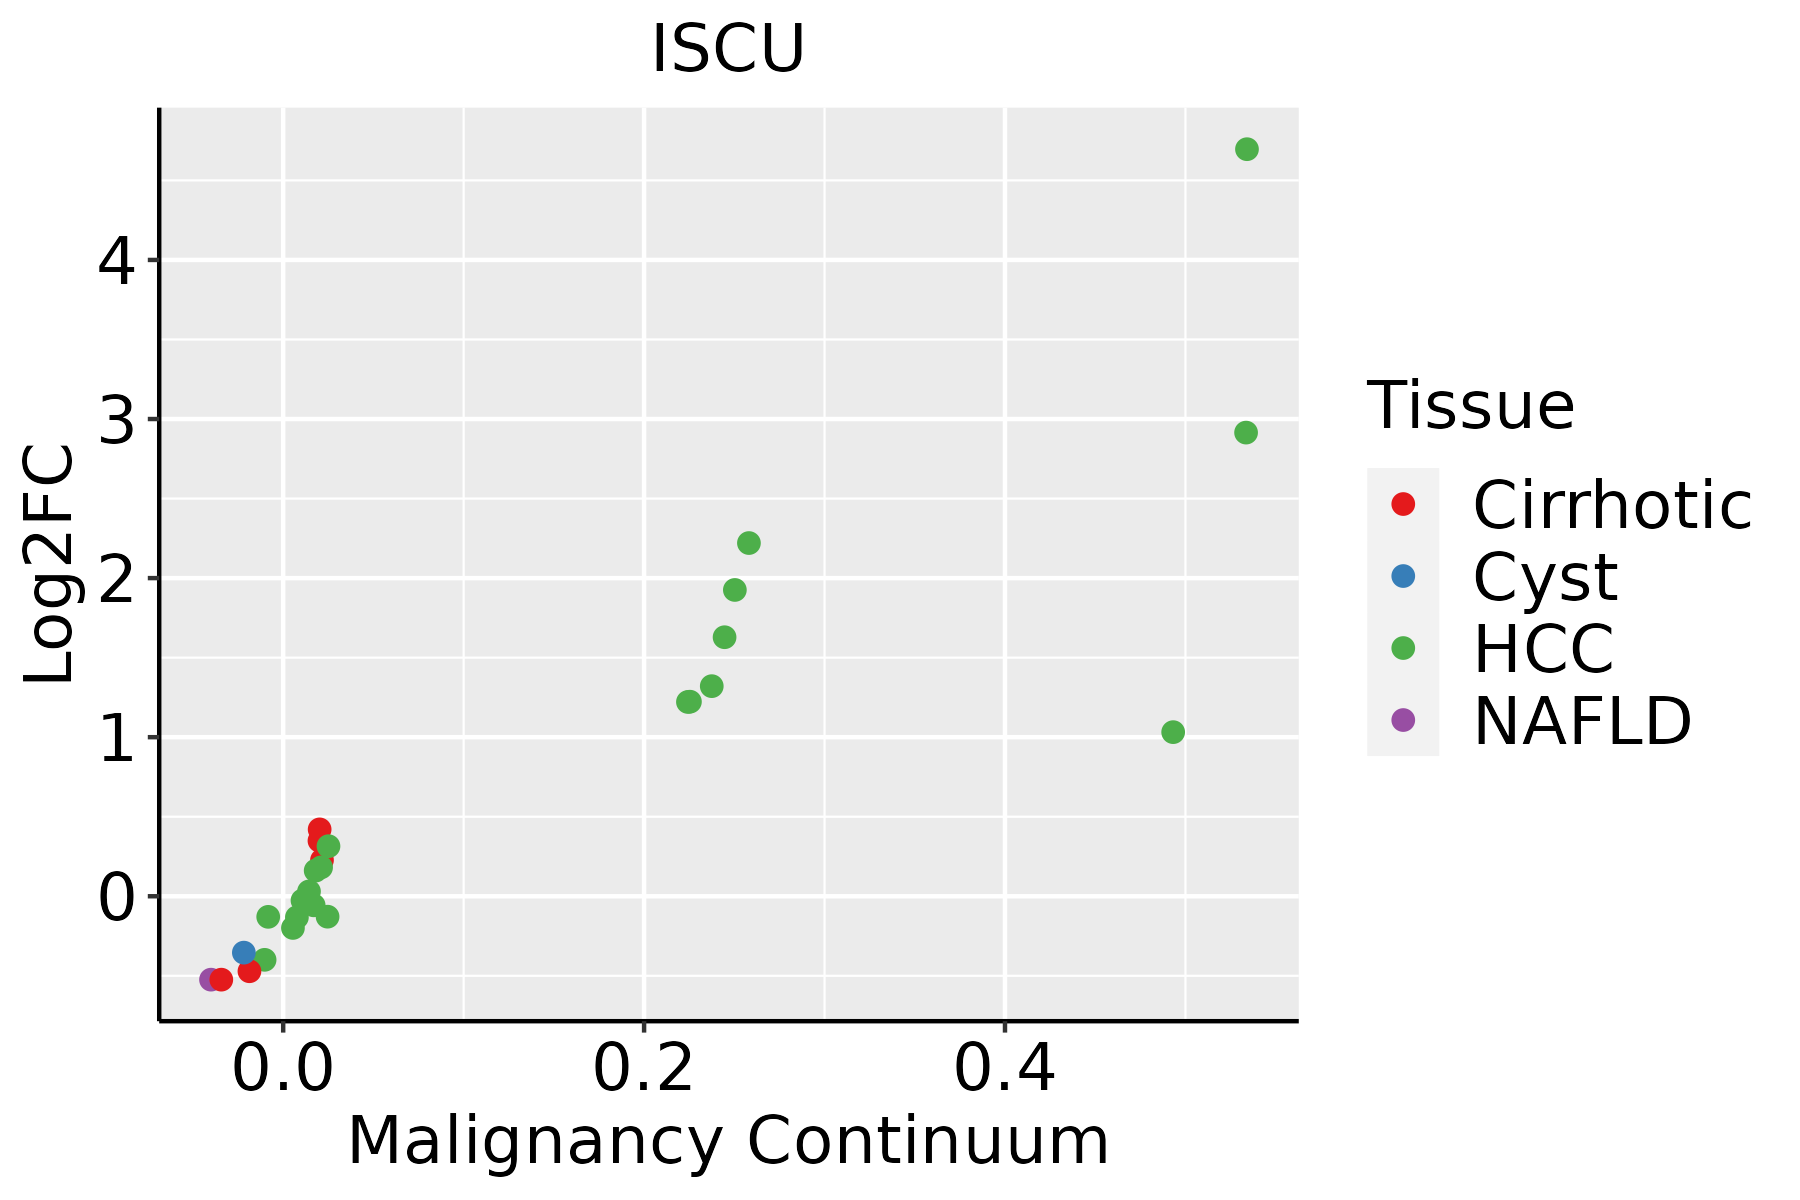 | HCC: Hepatocellular carcinoma |
| NAFLD: Non-alcoholic fatty liver disease | ||
| Oral Cavity | 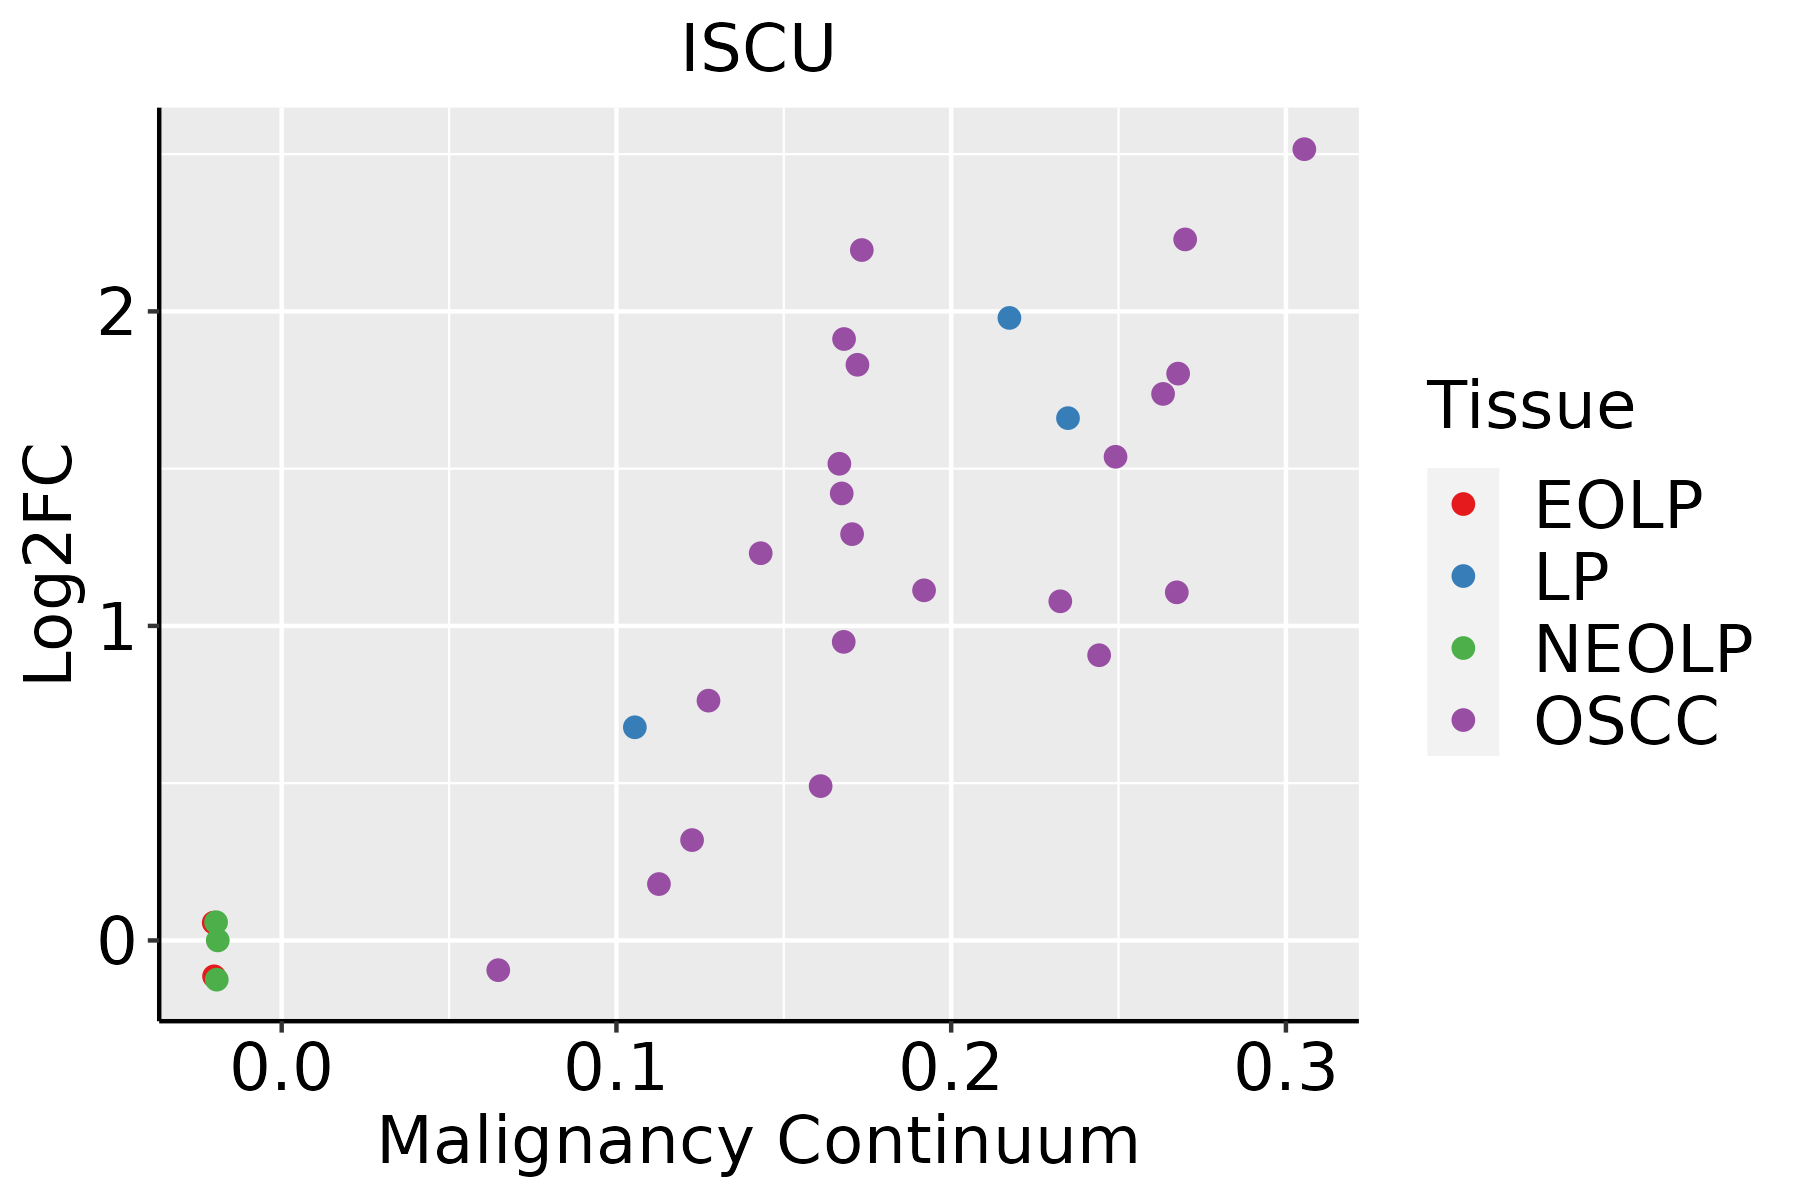 | EOLP: Erosive Oral lichen planus |
| LP: leukoplakia | ||
| NEOLP: Non-erosive oral lichen planus | ||
| OSCC: Oral squamous cell carcinoma | ||
| Prostate |  | BPH: Benign Prostatic Hyperplasia |
| Skin |  | AK: Actinic keratosis |
| cSCC: Cutaneous squamous cell carcinoma | ||
| SCCIS:squamous cell carcinoma in situ | ||
| Thyroid | 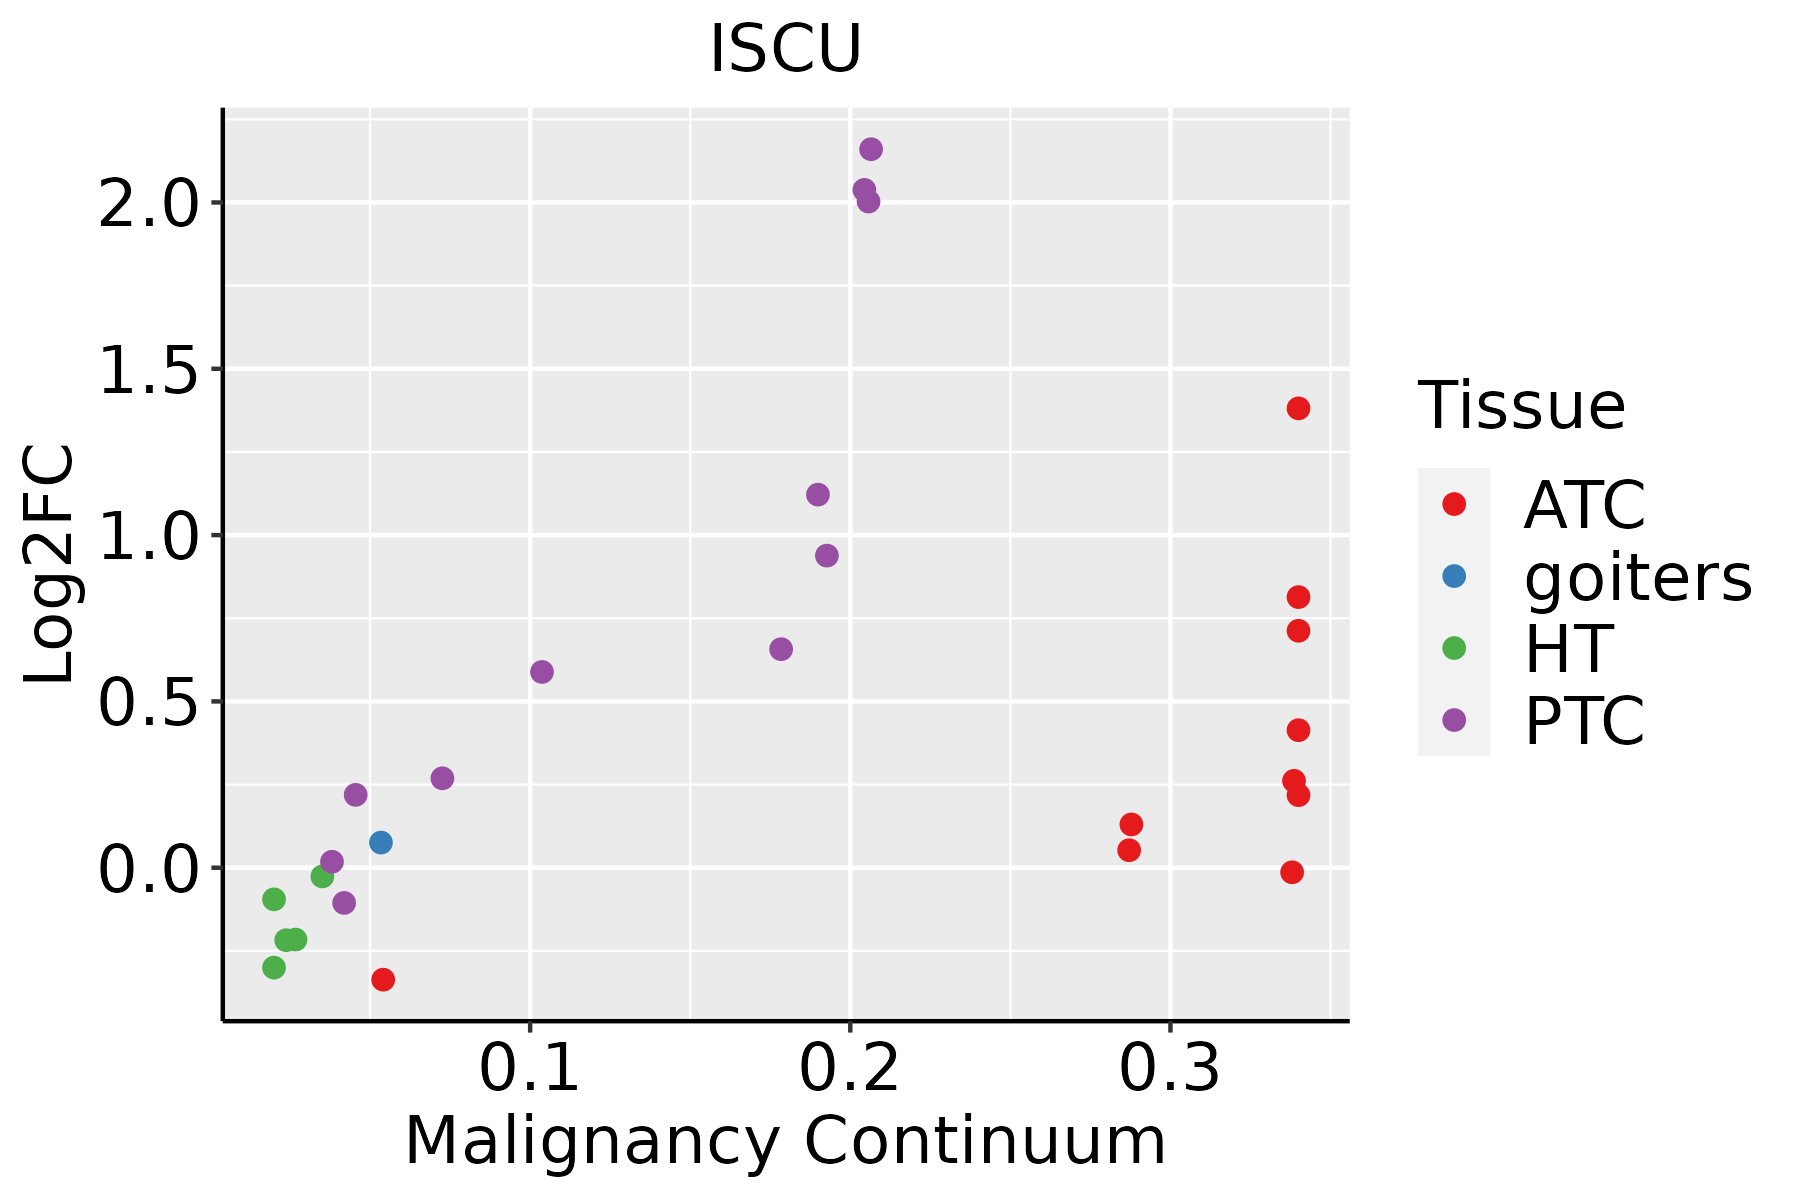 | ATC: Anaplastic thyroid cancer |
| HT: Hashimoto's thyroiditis | ||
| PTC: Papillary thyroid cancer |
| ∗log2FC in expression of this searched gene in stem-like cells from each diseased tissue sample relative to stem-like cells in normal samples in each tissue plotted against the malignancy continuum. Samples are colored based on if they are from different disease stage. |
Top |
Malignant transformation related pathway analysis |
| Find out the enriched GO biological processes and KEGG pathways involved in transition from healthy to precancer to cancer |
| Tissue | Disease Stage | Enriched GO biological Processes |
| Colorectum | AD |  |
| Colorectum | SER |  |
| Colorectum | MSS |  |
| Colorectum | MSI-H |  |
| Colorectum | FAP |  |
| ∗Top 15 enriched GO BP terms are showed in the bar plot of each disease state in each tissue. Each row represents a significant GO biological process which is colored according to the -log10(p.adjust). |
| Page: 1 2 3 4 5 6 7 8 9 |
| GO ID | Tissue | Disease Stage | Description | Gene Ratio | Bg Ratio | pvalue | p.adjust | Count |
| GO:0046034 | Colorectum | AD | ATP metabolic process | 142/3918 | 277/18723 | 2.64e-29 | 8.26e-26 | 142 |
| GO:0006091 | Colorectum | AD | generation of precursor metabolites and energy | 209/3918 | 490/18723 | 3.17e-28 | 6.61e-25 | 209 |
| GO:0009060 | Colorectum | AD | aerobic respiration | 108/3918 | 189/18723 | 9.14e-28 | 1.43e-24 | 108 |
| GO:0045333 | Colorectum | AD | cellular respiration | 119/3918 | 230/18723 | 3.21e-25 | 4.02e-22 | 119 |
| GO:0006119 | Colorectum | AD | oxidative phosphorylation | 83/3918 | 141/18723 | 7.95e-23 | 8.30e-20 | 83 |
| GO:0015980 | Colorectum | AD | energy derivation by oxidation of organic compounds | 143/3918 | 318/18723 | 2.78e-22 | 2.49e-19 | 143 |
| GO:0022900 | Colorectum | AD | electron transport chain | 89/3918 | 175/18723 | 1.42e-18 | 8.91e-16 | 89 |
| GO:0019646 | Colorectum | AD | aerobic electron transport chain | 53/3918 | 87/18723 | 5.58e-16 | 2.16e-13 | 53 |
| GO:0042773 | Colorectum | AD | ATP synthesis coupled electron transport | 56/3918 | 95/18723 | 6.76e-16 | 2.22e-13 | 56 |
| GO:0042775 | Colorectum | AD | mitochondrial ATP synthesis coupled electron transport | 56/3918 | 95/18723 | 6.76e-16 | 2.22e-13 | 56 |
| GO:0022904 | Colorectum | AD | respiratory electron transport chain | 63/3918 | 114/18723 | 8.23e-16 | 2.45e-13 | 63 |
| GO:0006120 | Colorectum | AD | mitochondrial electron transport, NADH to ubiquinone | 32/3918 | 51/18723 | 1.12e-10 | 1.11e-08 | 32 |
| GO:0055076 | Colorectum | AD | transition metal ion homeostasis | 53/3918 | 138/18723 | 1.89e-06 | 5.65e-05 | 53 |
| GO:0043467 | Colorectum | AD | regulation of generation of precursor metabolites and energy | 49/3918 | 130/18723 | 8.33e-06 | 1.99e-04 | 49 |
| GO:0046916 | Colorectum | AD | cellular transition metal ion homeostasis | 43/3918 | 115/18723 | 3.62e-05 | 6.56e-04 | 43 |
| GO:0006790 | Colorectum | AD | sulfur compound metabolic process | 101/3918 | 339/18723 | 6.46e-05 | 1.07e-03 | 101 |
| GO:0055072 | Colorectum | AD | iron ion homeostasis | 32/3918 | 85/18723 | 2.97e-04 | 3.60e-03 | 32 |
| GO:0043457 | Colorectum | AD | regulation of cellular respiration | 20/3918 | 49/18723 | 1.23e-03 | 1.09e-02 | 20 |
| GO:1903715 | Colorectum | AD | regulation of aerobic respiration | 15/3918 | 33/18723 | 1.36e-03 | 1.18e-02 | 15 |
| GO:0006879 | Colorectum | AD | cellular iron ion homeostasis | 25/3918 | 67/18723 | 1.51e-03 | 1.27e-02 | 25 |
| Page: 1 2 3 4 5 6 7 8 9 10 11 12 13 14 15 16 17 18 19 |
| Pathway ID | Tissue | Disease Stage | Description | Gene Ratio | Bg Ratio | pvalue | p.adjust | qvalue | Count |
| Page: 1 |
Top |
Cell-cell communication analysis |
| Identification of potential cell-cell interactions between two cell types and their ligand-receptor pairs for different disease states |
| Ligand | Receptor | LRpair | Pathway | Tissue | Disease Stage |
| Page: 1 |
Top |
Single-cell gene regulatory network inference analysis |
| Find out the significant the regulons (TFs) and the target genes of each regulon across cell types for different disease states |
| TF | Cell Type | Tissue | Disease Stage | Target Gene | RSS | Regulon Activity |
| ∗The dot plots of a searched regulon are shown for all cell subpopulations in each disease state of each tissue based on the regulon specific score inferred using pySCENIC and by calculating the average expression. |
| Page: 1 |
Top |
Somatic mutation of malignant transformation related genes |
| Annotation of somatic variants for genes involved in malignant transformation |
| Hugo Symbol | Variant Class | Variant Classification | dbSNP RS | HGVSc | HGVSp | HGVSp Short | SWISSPROT | BIOTYPE | SIFT | PolyPhen | Tumor Sample Barcode | Tissue | Histology | Sex | Age | Stage | Therapy Types | Drugs | Outcome |
| ISCU | SNV | Missense_Mutation | c.187C>A | p.Leu63Met | p.L63M | Q9H1K1 | protein_coding | tolerated_low_confidence(0.24) | possibly_damaging(0.654) | TCGA-EJ-5518-01 | Prostate | prostate adenocarcinoma | Male | >=65 | 9 | Unknown | Unknown | PD | |
| ISCU | SNV | Missense_Mutation | c.167N>T | p.Ser56Phe | p.S56F | Q9H1K1 | protein_coding | deleterious_low_confidence(0) | probably_damaging(0.934) | TCGA-BR-4257-01 | Stomach | stomach adenocarcinoma | Female | >=65 | I/II | Unknown | Unknown | SD |
| Page: 1 2 |
Top |
Related drugs of malignant transformation related genes |
| Identification of chemicals and drugs interact with genes involved in malignant transfromation |
| (DGIdb 4.0) |
| Entrez ID | Symbol | Category | Interaction Types | Drug Claim Name | Drug Name | PMIDs |
| Page: 1 |

Copyright 2023-Present -The University of Texas Health Science Center at Houston |