
|
|||||
|
 | |
| |
| |
| |
| |
| |
|
Gene: HN1 |
Gene summary for HN1 |
| Gene information | Species | Human | Gene symbol | HN1 | Gene ID | 51155 |
| Gene name | Jupiter microtubule associated homolog 1 | |
| Gene Alias | ARM2 | |
| Cytomap | 17q25.1 | |
| Gene Type | protein-coding | GO ID | GO:0005575 | UniProtAcc | Q9UK76 |
Top |
Malignant transformation analysis |
| Identification of the aberrant gene expression in precancerous and cancerous lesions by comparing the gene expression of stem-like cells in diseased tissues with normal stem cells |
| Entrez ID | Symbol | Replicates | Species | Organ | Tissue | Adj P-value | Log2FC | Malignancy |
| 51155 | HN1 | GSM4909281 | Human | Breast | IDC | 3.69e-10 | -2.03e-01 | 0.21 |
| 51155 | HN1 | GSM4909282 | Human | Breast | IDC | 7.71e-11 | -2.03e-01 | -0.0288 |
| 51155 | HN1 | GSM4909285 | Human | Breast | IDC | 7.71e-11 | -2.03e-01 | 0.21 |
| 51155 | HN1 | GSM4909286 | Human | Breast | IDC | 1.69e-10 | -2.03e-01 | 0.1081 |
| 51155 | HN1 | GSM4909287 | Human | Breast | IDC | 5.04e-09 | -2.03e-01 | 0.2057 |
| 51155 | HN1 | GSM4909290 | Human | Breast | IDC | 6.20e-06 | -2.03e-01 | 0.2096 |
| 51155 | HN1 | GSM4909291 | Human | Breast | IDC | 1.86e-04 | -2.03e-01 | 0.1753 |
| 51155 | HN1 | GSM4909293 | Human | Breast | IDC | 7.71e-11 | -2.03e-01 | 0.1581 |
| 51155 | HN1 | GSM4909294 | Human | Breast | IDC | 3.52e-11 | -2.03e-01 | 0.2022 |
| 51155 | HN1 | GSM4909295 | Human | Breast | IDC | 4.17e-03 | -2.03e-01 | 0.0898 |
| 51155 | HN1 | GSM4909296 | Human | Breast | IDC | 1.69e-10 | -2.03e-01 | 0.1524 |
| 51155 | HN1 | GSM4909297 | Human | Breast | IDC | 3.69e-10 | -2.03e-01 | 0.1517 |
| 51155 | HN1 | GSM4909298 | Human | Breast | IDC | 1.69e-10 | -2.03e-01 | 0.1551 |
| 51155 | HN1 | GSM4909299 | Human | Breast | IDC | 3.69e-10 | -2.03e-01 | 0.035 |
| 51155 | HN1 | GSM4909300 | Human | Breast | IDC | 1.59e-02 | -2.03e-01 | 0.0334 |
| 51155 | HN1 | GSM4909301 | Human | Breast | IDC | 3.30e-12 | -2.03e-01 | 0.1577 |
| 51155 | HN1 | GSM4909302 | Human | Breast | IDC | 7.22e-09 | -2.03e-01 | 0.1545 |
| 51155 | HN1 | GSM4909304 | Human | Breast | IDC | 1.60e-11 | -2.03e-01 | 0.1636 |
| 51155 | HN1 | GSM4909305 | Human | Breast | IDC | 1.14e-05 | -2.03e-01 | 0.0436 |
| 51155 | HN1 | GSM4909306 | Human | Breast | IDC | 7.71e-11 | -2.03e-01 | 0.1564 |
| Page: 1 2 3 4 5 6 7 8 9 10 11 |
| Tissue | Expression Dynamics | Abbreviation |
| Breast | 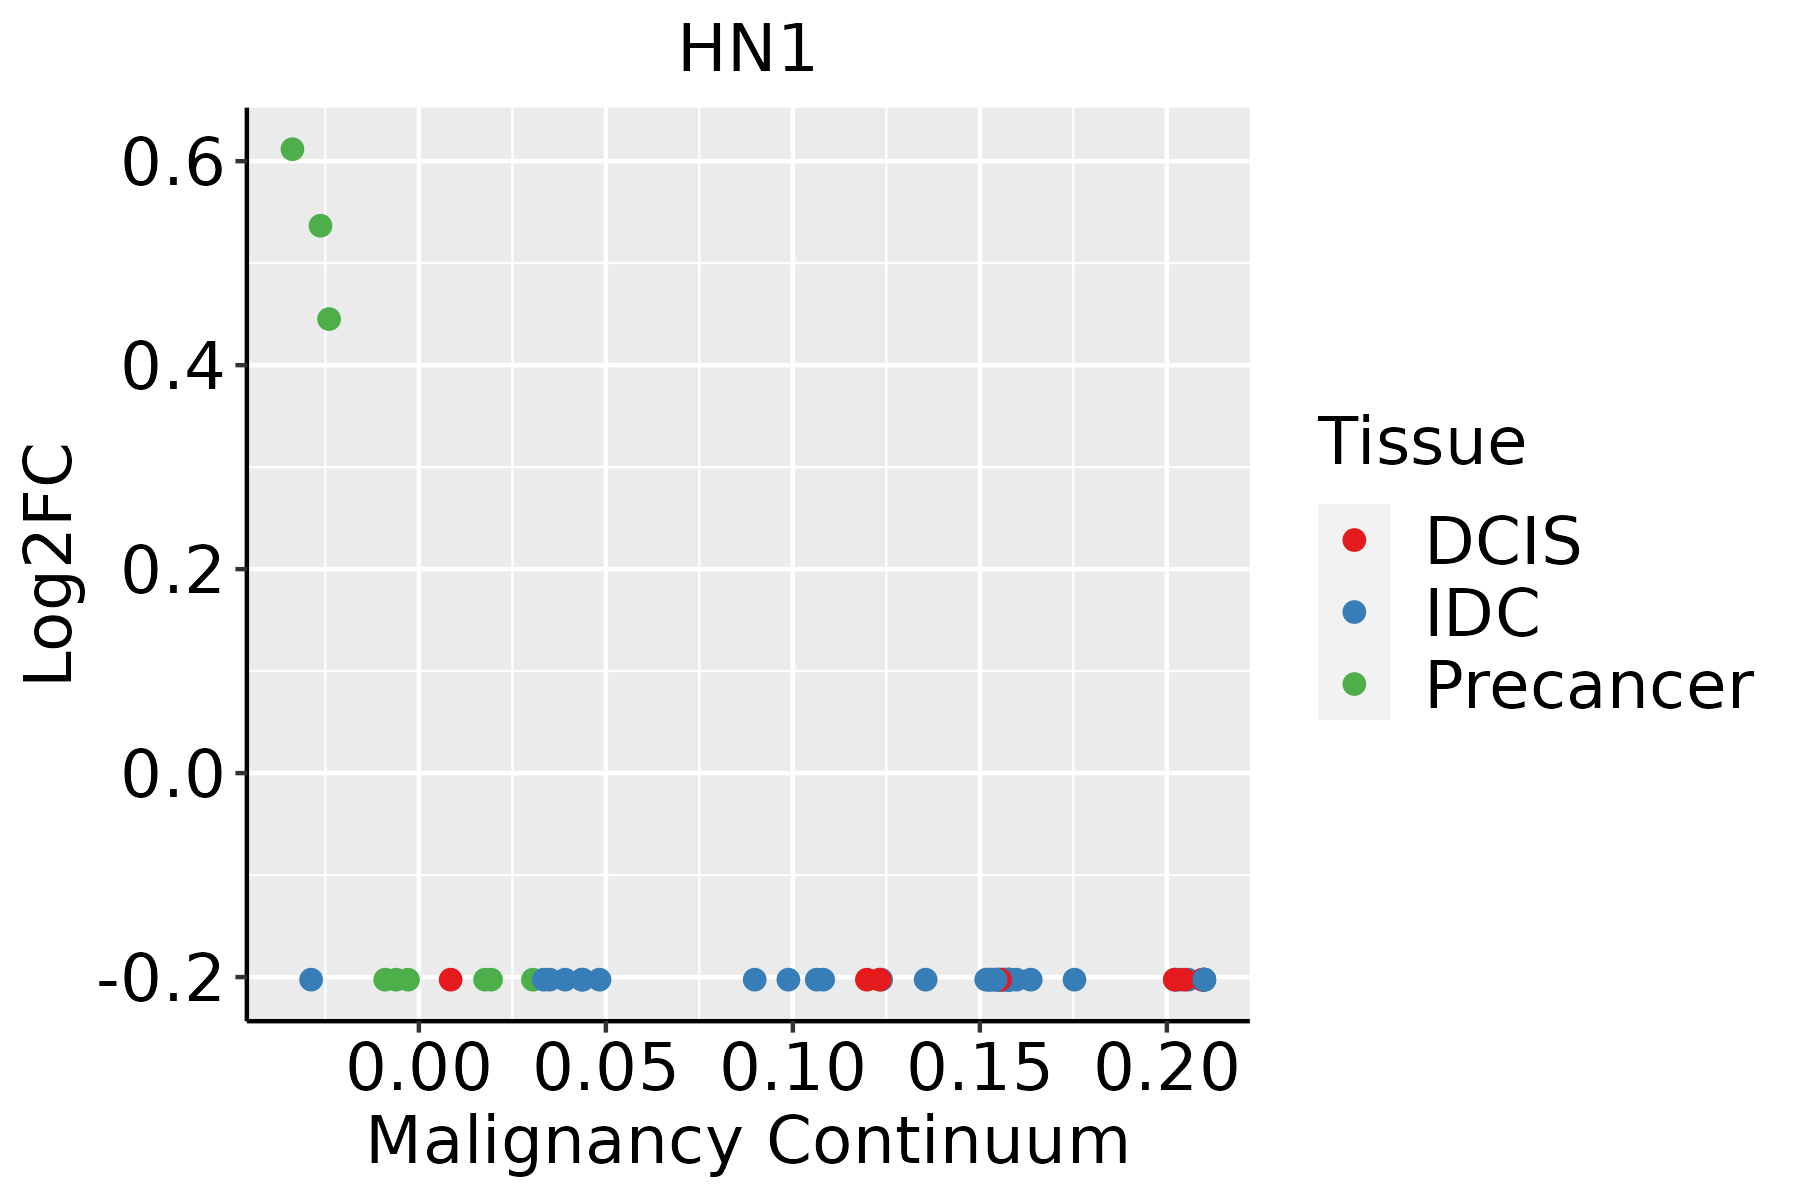 | IDC: Invasive ductal carcinoma |
| DCIS: Ductal carcinoma in situ | ||
| Precancer(BRCA1-mut): Precancerous lesion from BRCA1 mutation carriers | ||
| Colorectum (GSE201348) |  | FAP: Familial adenomatous polyposis |
| CRC: Colorectal cancer | ||
| Colorectum (HTA11) |  | AD: Adenomas |
| SER: Sessile serrated lesions | ||
| MSI-H: Microsatellite-high colorectal cancer | ||
| MSS: Microsatellite stable colorectal cancer | ||
| Esophagus | 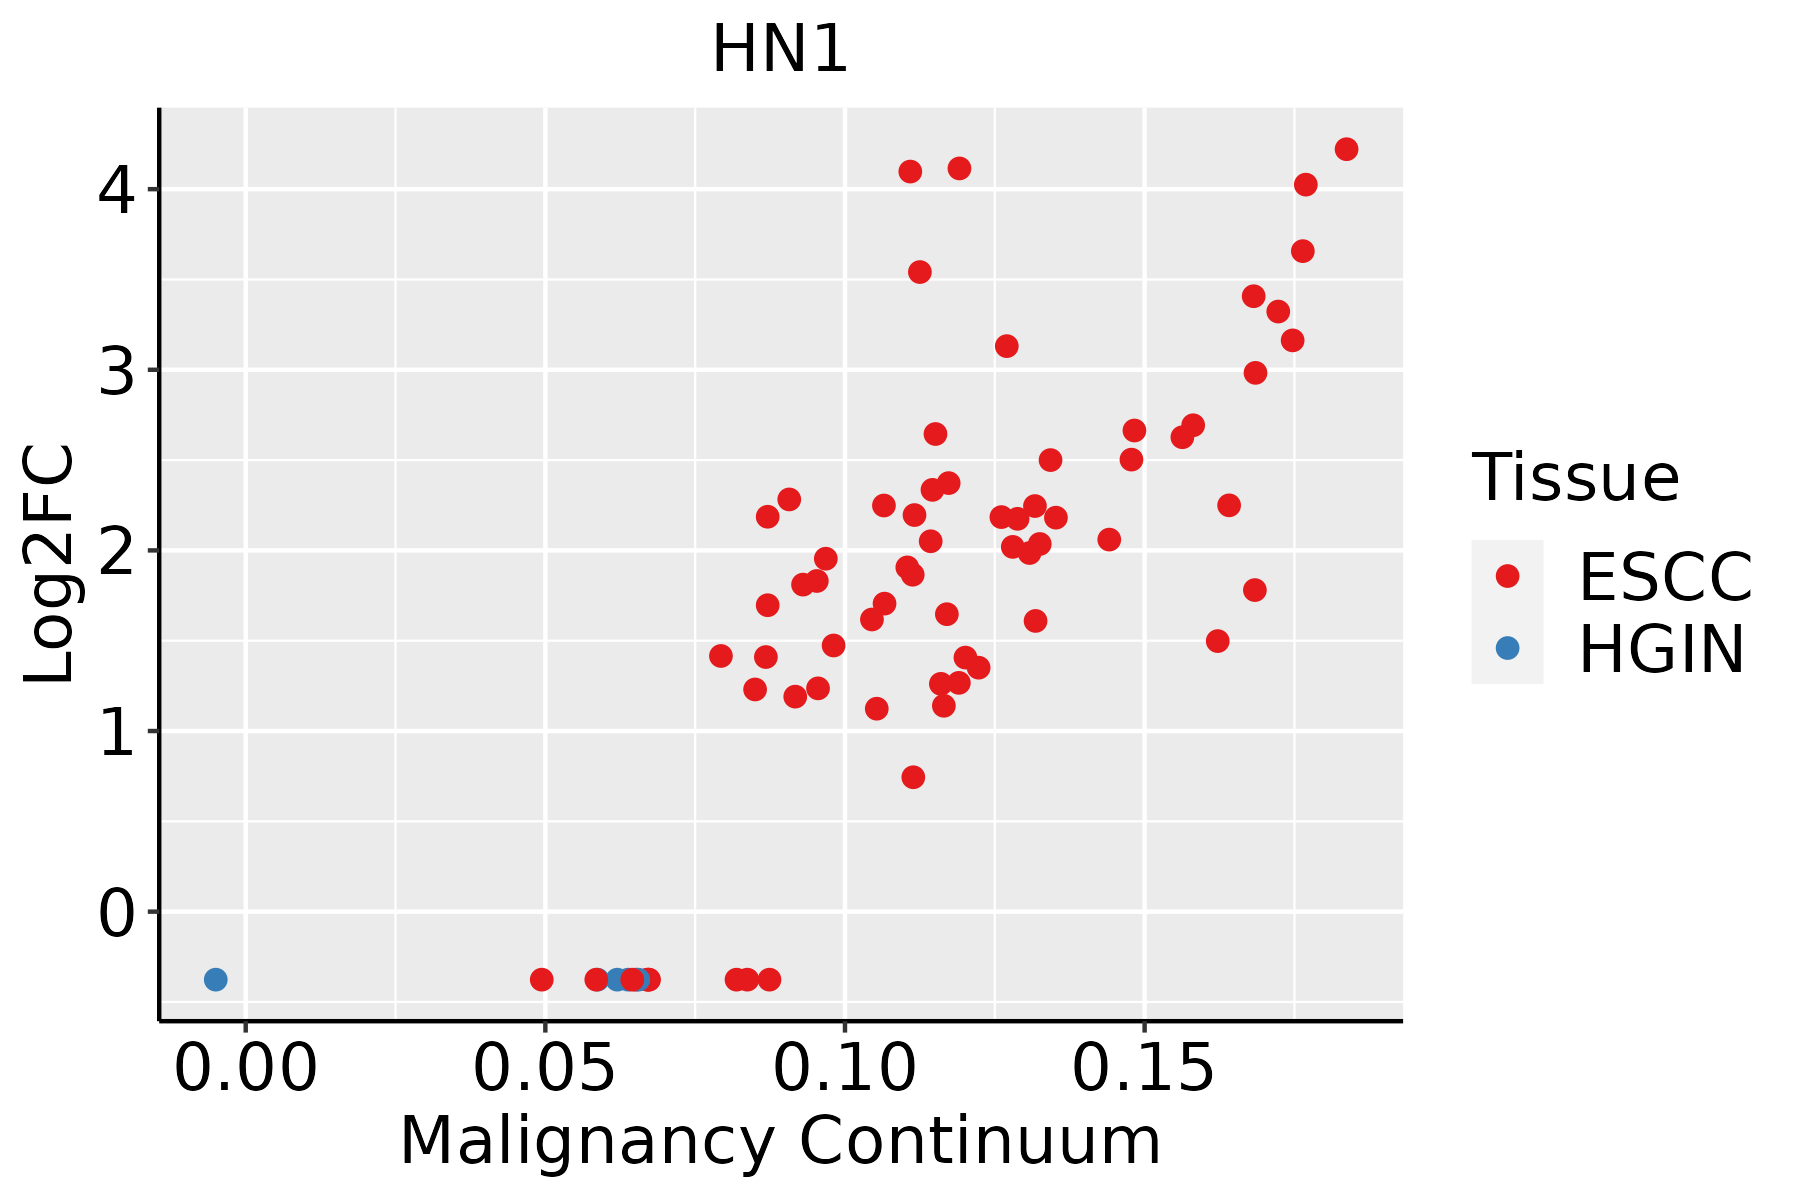 | ESCC: Esophageal squamous cell carcinoma |
| HGIN: High-grade intraepithelial neoplasias | ||
| LGIN: Low-grade intraepithelial neoplasias | ||
| GC |  | CAG: Chronic atrophic gastritis |
| CAG with IM: Chronic atrophic gastritis with intestinal metaplasia | ||
| CSG: Chronic superficial gastritis | ||
| GC: Gastric cancer | ||
| SIM: Severe intestinal metaplasia | ||
| WIM: Wild intestinal metaplasia | ||
| Liver | 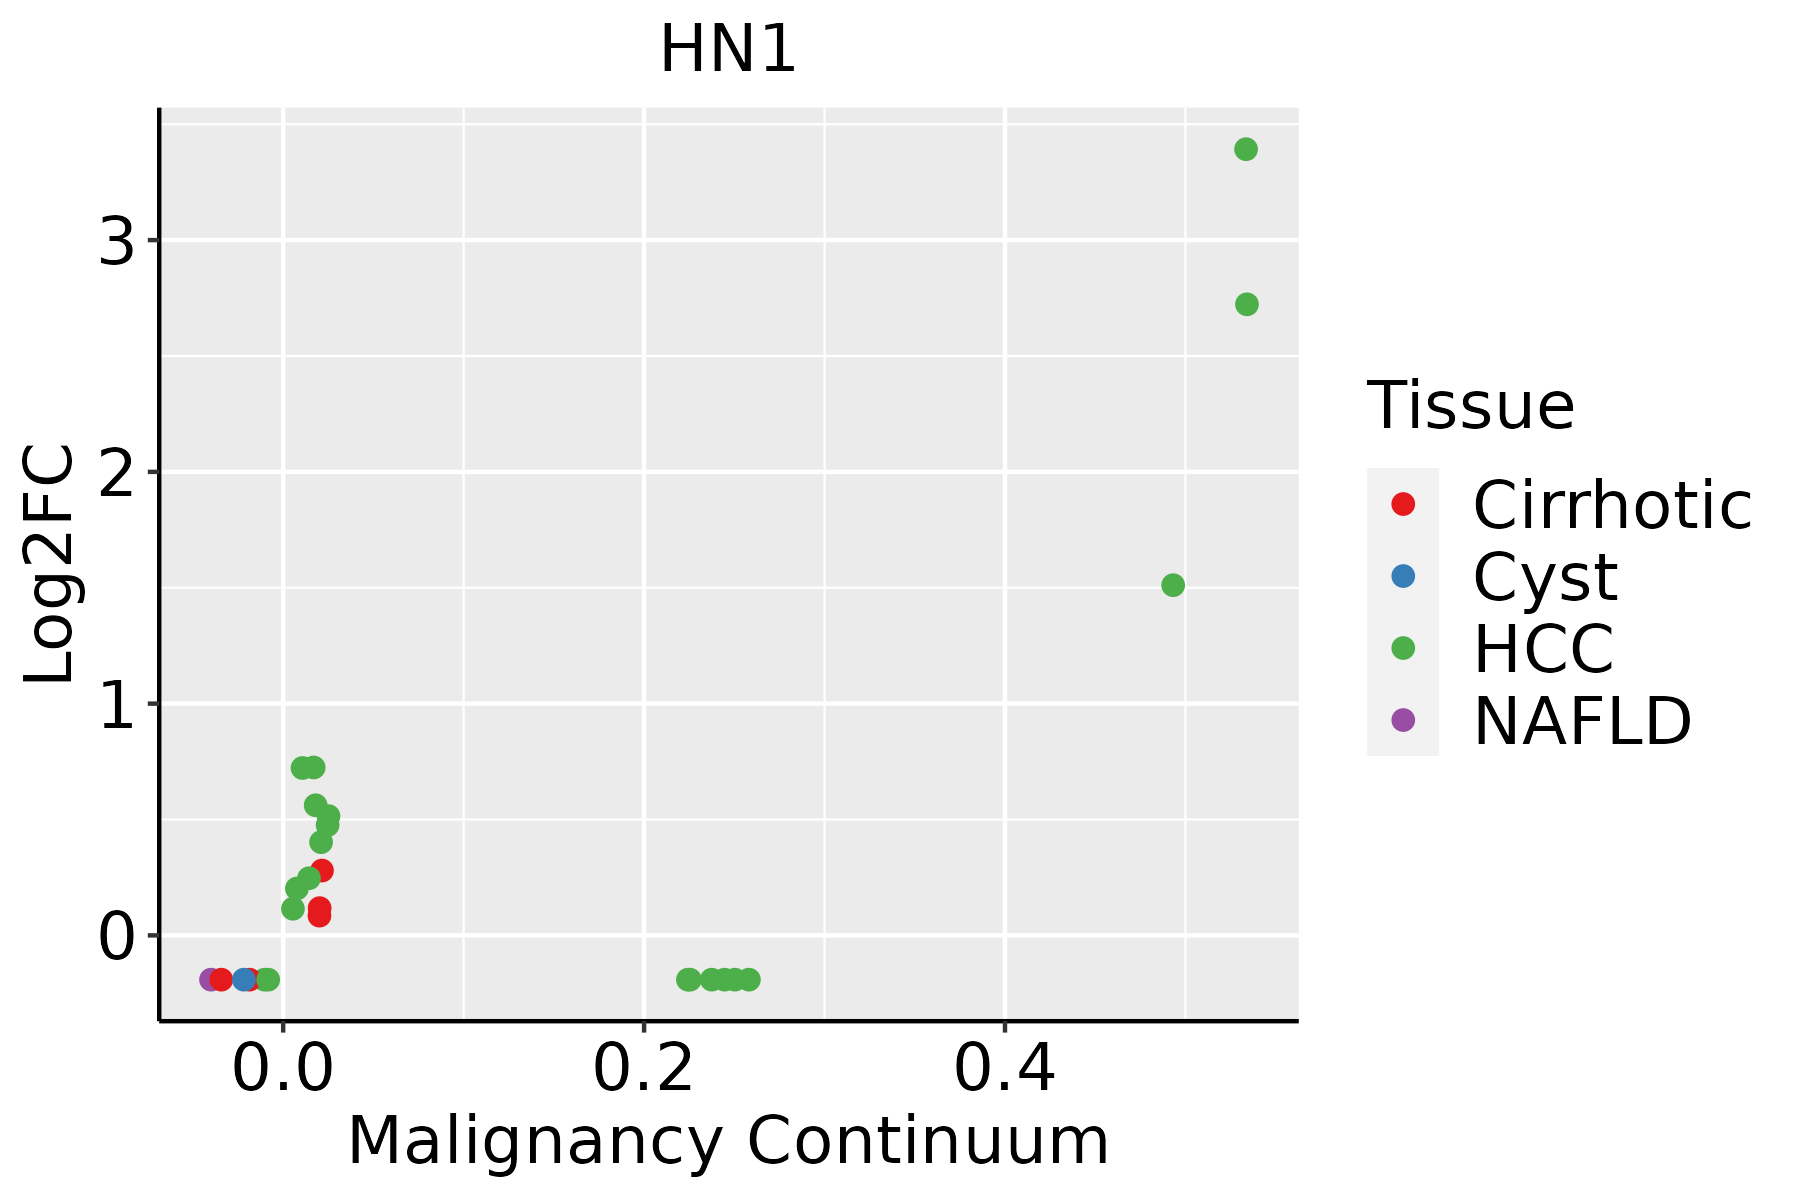 | HCC: Hepatocellular carcinoma |
| NAFLD: Non-alcoholic fatty liver disease | ||
| Oral Cavity |  | EOLP: Erosive Oral lichen planus |
| LP: leukoplakia | ||
| NEOLP: Non-erosive oral lichen planus | ||
| OSCC: Oral squamous cell carcinoma | ||
| Prostate |  | BPH: Benign Prostatic Hyperplasia |
| Skin | 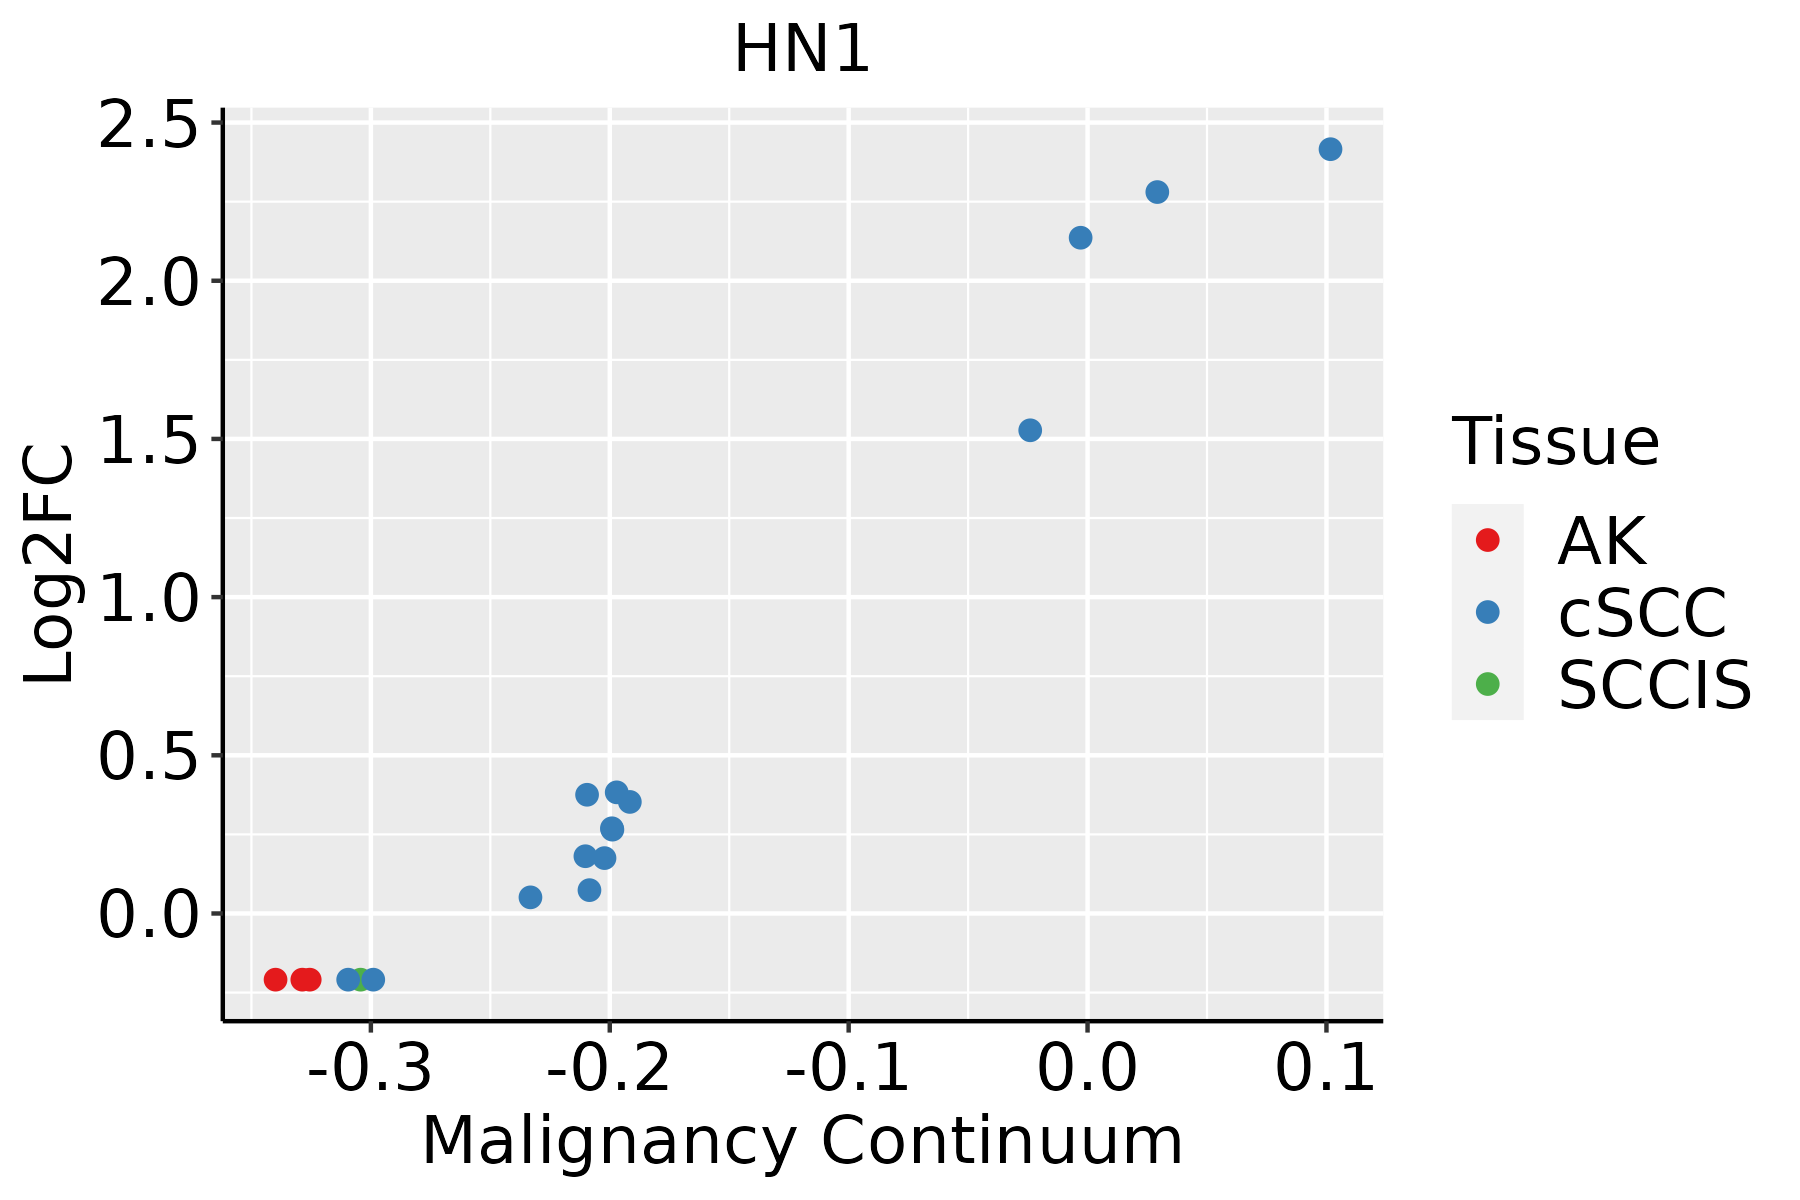 | AK: Actinic keratosis |
| cSCC: Cutaneous squamous cell carcinoma | ||
| SCCIS:squamous cell carcinoma in situ |
| ∗log2FC in expression of this searched gene in stem-like cells from each diseased tissue sample relative to stem-like cells in normal samples in each tissue plotted against the malignancy continuum. Samples are colored based on if they are from different disease stage. |
Top |
Malignant transformation related pathway analysis |
| Find out the enriched GO biological processes and KEGG pathways involved in transition from healthy to precancer to cancer |
| Tissue | Disease Stage | Enriched GO biological Processes |
| Colorectum | AD |  |
| Colorectum | SER |  |
| Colorectum | MSS |  |
| Colorectum | MSI-H |  |
| Colorectum | FAP |  |
| ∗Top 15 enriched GO BP terms are showed in the bar plot of each disease state in each tissue. Each row represents a significant GO biological process which is colored according to the -log10(p.adjust). |
| Page: 1 2 3 4 5 6 7 8 9 |
| GO ID | Tissue | Disease Stage | Description | Gene Ratio | Bg Ratio | pvalue | p.adjust | Count |
| GO:004217616 | Endometrium | AEH | regulation of protein catabolic process | 100/2100 | 391/18723 | 9.58e-16 | 3.59e-13 | 100 |
| GO:190336216 | Endometrium | AEH | regulation of cellular protein catabolic process | 70/2100 | 255/18723 | 5.40e-13 | 1.25e-10 | 70 |
| GO:001049816 | Endometrium | AEH | proteasomal protein catabolic process | 108/2100 | 490/18723 | 2.73e-12 | 4.67e-10 | 108 |
| GO:190305016 | Endometrium | AEH | regulation of proteolysis involved in cellular protein catabolic process | 58/2100 | 221/18723 | 3.58e-10 | 3.77e-08 | 58 |
| GO:006113616 | Endometrium | AEH | regulation of proteasomal protein catabolic process | 49/2100 | 187/18723 | 8.64e-09 | 5.96e-07 | 49 |
| GO:000716310 | Endometrium | AEH | establishment or maintenance of cell polarity | 54/2100 | 218/18723 | 1.30e-08 | 8.47e-07 | 54 |
| GO:004217715 | Endometrium | AEH | negative regulation of protein catabolic process | 34/2100 | 121/18723 | 2.67e-07 | 1.17e-05 | 34 |
| GO:00074098 | Endometrium | AEH | axonogenesis | 81/2100 | 418/18723 | 5.54e-07 | 2.12e-05 | 81 |
| GO:00615648 | Endometrium | AEH | axon development | 88/2100 | 467/18723 | 6.39e-07 | 2.38e-05 | 88 |
| GO:190336310 | Endometrium | AEH | negative regulation of cellular protein catabolic process | 24/2100 | 75/18723 | 1.18e-06 | 3.85e-05 | 24 |
| GO:00300109 | Endometrium | AEH | establishment of cell polarity | 36/2100 | 143/18723 | 2.19e-06 | 6.49e-05 | 36 |
| GO:00343299 | Endometrium | AEH | cell junction assembly | 78/2100 | 420/18723 | 4.80e-06 | 1.24e-04 | 78 |
| GO:190305110 | Endometrium | AEH | negative regulation of proteolysis involved in cellular protein catabolic process | 20/2100 | 64/18723 | 1.34e-05 | 2.88e-04 | 20 |
| GO:003133016 | Endometrium | AEH | negative regulation of cellular catabolic process | 53/2100 | 262/18723 | 1.40e-05 | 2.99e-04 | 53 |
| GO:00510567 | Endometrium | AEH | regulation of small GTPase mediated signal transduction | 59/2100 | 302/18723 | 1.43e-05 | 3.03e-04 | 59 |
| GO:00482598 | Endometrium | AEH | regulation of receptor-mediated endocytosis | 28/2100 | 110/18723 | 2.28e-05 | 4.35e-04 | 28 |
| GO:00072657 | Endometrium | AEH | Ras protein signal transduction | 63/2100 | 337/18723 | 3.09e-05 | 5.66e-04 | 63 |
| GO:00301009 | Endometrium | AEH | regulation of endocytosis | 44/2100 | 211/18723 | 3.39e-05 | 6.05e-04 | 44 |
| GO:00068988 | Endometrium | AEH | receptor-mediated endocytosis | 49/2100 | 244/18723 | 3.54e-05 | 6.24e-04 | 49 |
| GO:000989515 | Endometrium | AEH | negative regulation of catabolic process | 60/2100 | 320/18723 | 4.32e-05 | 7.28e-04 | 60 |
| Page: 1 2 3 4 5 6 7 8 9 10 11 12 13 14 |
| Pathway ID | Tissue | Disease Stage | Description | Gene Ratio | Bg Ratio | pvalue | p.adjust | qvalue | Count |
| Page: 1 |
Top |
Cell-cell communication analysis |
| Identification of potential cell-cell interactions between two cell types and their ligand-receptor pairs for different disease states |
| Ligand | Receptor | LRpair | Pathway | Tissue | Disease Stage |
| Page: 1 |
Top |
Single-cell gene regulatory network inference analysis |
| Find out the significant the regulons (TFs) and the target genes of each regulon across cell types for different disease states |
| TF | Cell Type | Tissue | Disease Stage | Target Gene | RSS | Regulon Activity |
| ∗The dot plots of a searched regulon are shown for all cell subpopulations in each disease state of each tissue based on the regulon specific score inferred using pySCENIC and by calculating the average expression. |
| Page: 1 |
Top |
Somatic mutation of malignant transformation related genes |
| Annotation of somatic variants for genes involved in malignant transformation |
| Hugo Symbol | Variant Class | Variant Classification | dbSNP RS | HGVSc | HGVSp | HGVSp Short | SWISSPROT | BIOTYPE | SIFT | PolyPhen | Tumor Sample Barcode | Tissue | Histology | Sex | Age | Stage | Therapy Types | Drugs | Outcome |
| HN1 | SNV | Missense_Mutation | c.65N>A | p.Arg22Gln | p.R22Q | Q9UK76 | protein_coding | tolerated_low_confidence(0.24) | possibly_damaging(0.836) | TCGA-HU-A4GN-01 | Stomach | stomach adenocarcinoma | Male | <65 | I/II | Chemotherapy | mitomycin | PD | |
| HN1 | SNV | Missense_Mutation | novel | c.427C>A | p.Pro143Thr | p.P143T | Q9UK76 | protein_coding | deleterious_low_confidence(0.01) | possibly_damaging(0.77) | TCGA-FE-A235-01 | Thyroid | thyroid carcinoma | Female | <65 | I/II | Unknown | Unknown | SD |
| Page: 1 2 |
Top |
Related drugs of malignant transformation related genes |
| Identification of chemicals and drugs interact with genes involved in malignant transfromation |
| (DGIdb 4.0) |
| Entrez ID | Symbol | Category | Interaction Types | Drug Claim Name | Drug Name | PMIDs |
| Page: 1 |

Copyright 2023-Present -The University of Texas Health Science Center at Houston |