
|
|||||
|
 | |
| |
| |
| |
| |
| |
|
Gene: FABP2 |
Gene summary for FABP2 |
| Gene information | Species | Human | Gene symbol | FABP2 | Gene ID | 2169 |
| Gene name | fatty acid binding protein 2 | |
| Gene Alias | FABPI | |
| Cytomap | 4q26 | |
| Gene Type | protein-coding | GO ID | GO:0003008 | UniProtAcc | P12104 |
Top |
Malignant transformation analysis |
| Identification of the aberrant gene expression in precancerous and cancerous lesions by comparing the gene expression of stem-like cells in diseased tissues with normal stem cells |
| Entrez ID | Symbol | Replicates | Species | Organ | Tissue | Adj P-value | Log2FC | Malignancy |
| 2169 | FABP2 | Pat01-B | Human | Stomach | GC | 5.32e-84 | 1.56e+00 | 0.5754 |
| 2169 | FABP2 | Pat02-B | Human | Stomach | GC | 8.72e-11 | 4.20e-01 | 0.0368 |
| 2169 | FABP2 | Pat03-B | Human | Stomach | GC | 1.37e-50 | 1.29e+00 | 0.3693 |
| 2169 | FABP2 | Pat05-B | Human | Stomach | GC | 4.01e-09 | 5.96e-01 | -0.0353 |
| 2169 | FABP2 | Pat08-B | Human | Stomach | GC | 3.44e-03 | 3.10e-01 | 0.0182 |
| 2169 | FABP2 | Pat13-B | Human | Stomach | GC | 1.31e-07 | 2.81e-01 | 0.0555 |
| 2169 | FABP2 | Pat16-B | Human | Stomach | GC | 3.44e-13 | 3.99e-01 | 0.1918 |
| 2169 | FABP2 | Pat17-B | Human | Stomach | GC | 8.97e-18 | 6.27e-01 | 0.3109 |
| 2169 | FABP2 | WIM_1 | Human | Stomach | WIM | 2.56e-03 | 2.41e-01 | 0.0335 |
| 2169 | FABP2 | SIM_1 | Human | Stomach | SIM | 1.10e-53 | 1.19e+00 | 0.3573 |
| 2169 | FABP2 | SIM_2 | Human | Stomach | SIM | 7.63e-13 | 4.27e-01 | 0.3139 |
| 2169 | FABP2 | SIM_3 | Human | Stomach | SIM | 1.51e-13 | 5.99e-01 | 0.0345 |
| 2169 | FABP2 | SIM_4 | Human | Stomach | SIM | 1.78e-55 | 1.49e+00 | 0.2664 |
| 2169 | FABP2 | EGC | Human | Stomach | GC | 4.66e-17 | 5.52e-01 | 0.1683 |
| Page: 1 |
| Tissue | Expression Dynamics | Abbreviation |
| GC | 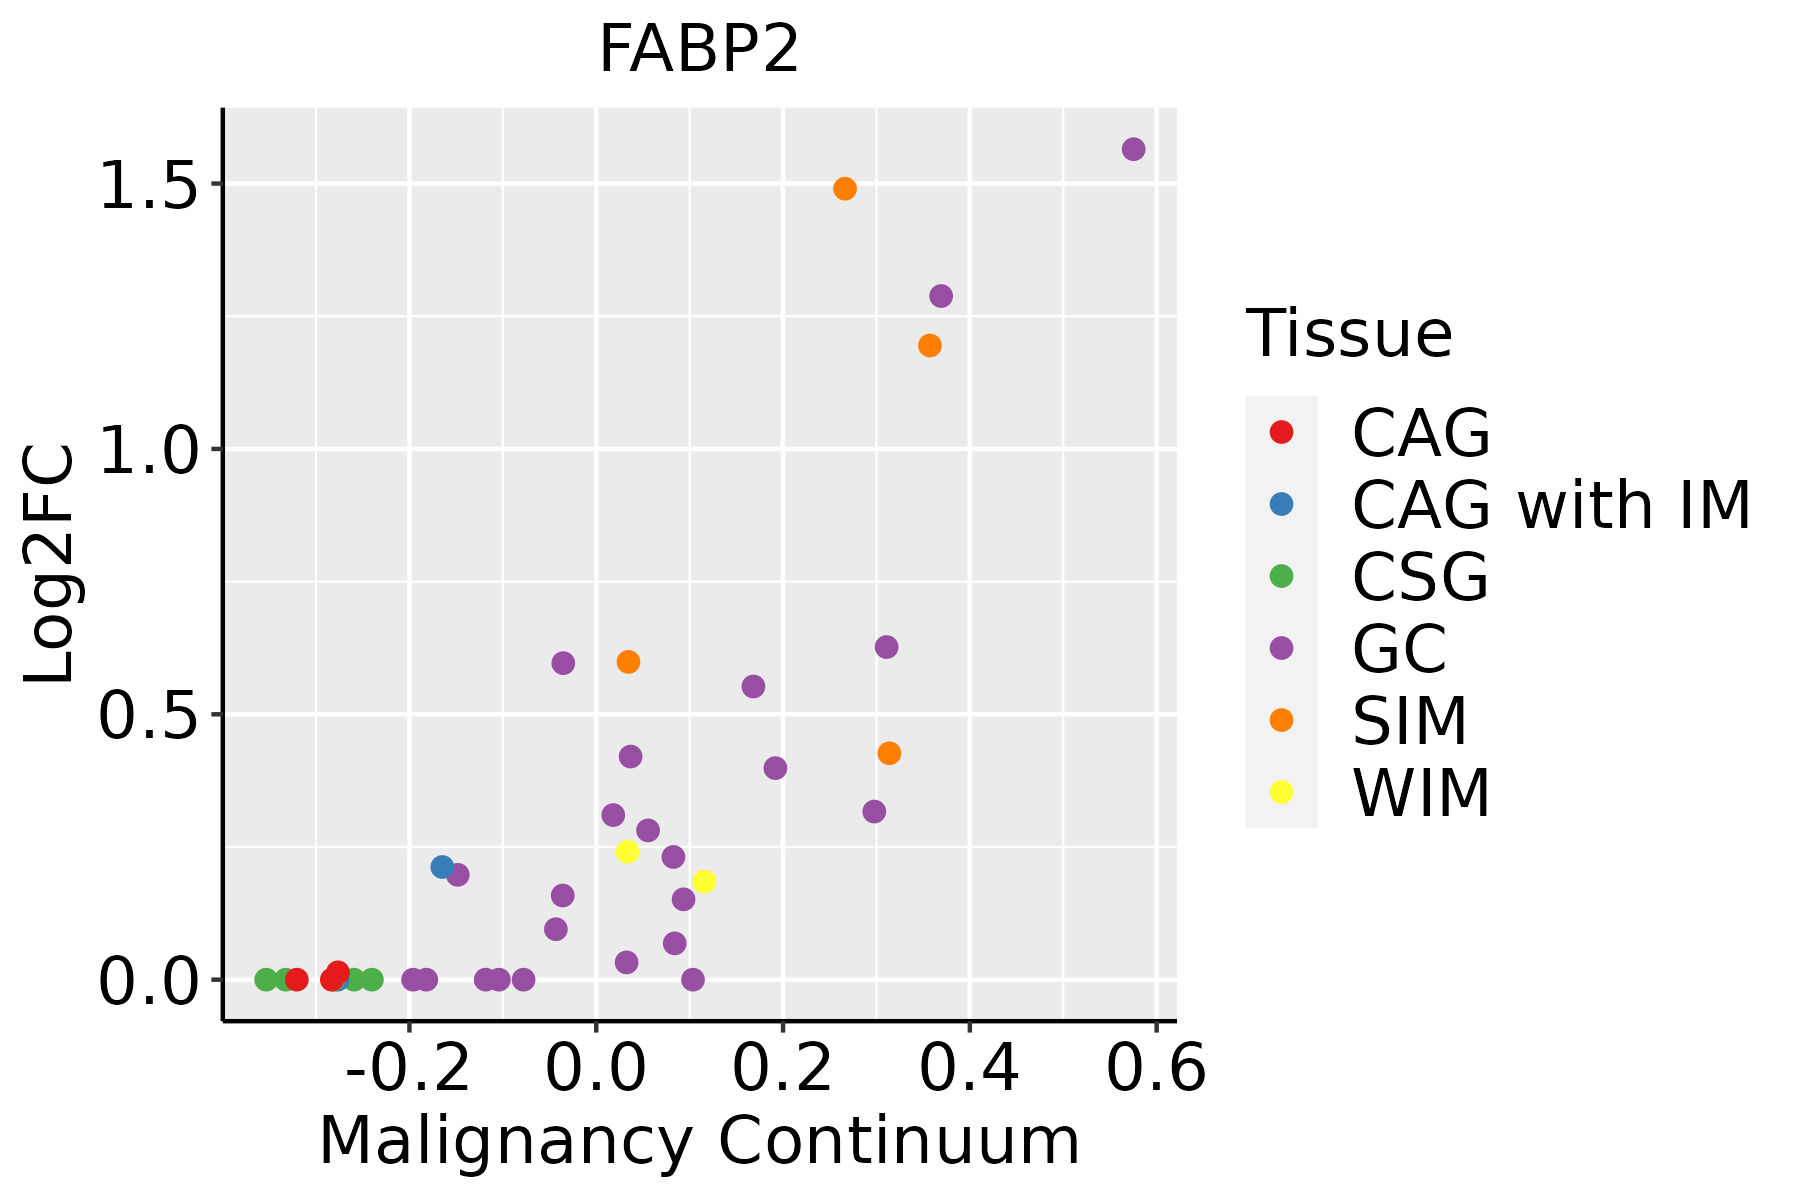 | CAG: Chronic atrophic gastritis |
| CAG with IM: Chronic atrophic gastritis with intestinal metaplasia | ||
| CSG: Chronic superficial gastritis | ||
| GC: Gastric cancer | ||
| SIM: Severe intestinal metaplasia | ||
| WIM: Wild intestinal metaplasia |
| ∗log2FC in expression of this searched gene in stem-like cells from each diseased tissue sample relative to stem-like cells in normal samples in each tissue plotted against the malignancy continuum. Samples are colored based on if they are from different disease stage. |
Top |
Malignant transformation related pathway analysis |
| Find out the enriched GO biological processes and KEGG pathways involved in transition from healthy to precancer to cancer |
| Tissue | Disease Stage | Enriched GO biological Processes |
| Colorectum | AD |  |
| Colorectum | SER |  |
| Colorectum | MSS |  |
| Colorectum | MSI-H |  |
| Colorectum | FAP |  |
| ∗Top 15 enriched GO BP terms are showed in the bar plot of each disease state in each tissue. Each row represents a significant GO biological process which is colored according to the -log10(p.adjust). |
| Page: 1 2 3 4 5 6 7 8 9 |
| GO ID | Tissue | Disease Stage | Description | Gene Ratio | Bg Ratio | pvalue | p.adjust | Count |
| GO:0007586 | Stomach | GC | digestion | 38/1159 | 137/18723 | 1.80e-15 | 1.22e-12 | 38 |
| GO:00226006 | Stomach | GC | digestive system process | 30/1159 | 104/18723 | 5.40e-13 | 2.10e-10 | 30 |
| GO:00508925 | Stomach | GC | intestinal absorption | 18/1159 | 41/18723 | 8.10e-12 | 2.20e-09 | 18 |
| GO:0098856 | Stomach | GC | intestinal lipid absorption | 10/1159 | 21/18723 | 1.50e-07 | 8.56e-06 | 10 |
| GO:00075864 | Stomach | WIM | digestion | 17/426 | 137/18723 | 1.48e-08 | 1.95e-06 | 17 |
| GO:00226004 | Stomach | WIM | digestive system process | 11/426 | 104/18723 | 2.48e-05 | 9.29e-04 | 11 |
| GO:005089231 | Stomach | WIM | intestinal absorption | 6/426 | 41/18723 | 3.07e-04 | 6.33e-03 | 6 |
| GO:00988563 | Stomach | WIM | intestinal lipid absorption | 4/426 | 21/18723 | 1.16e-03 | 1.68e-02 | 4 |
| GO:00075865 | Stomach | SIM | digestion | 24/708 | 137/18723 | 3.20e-10 | 6.29e-08 | 24 |
| GO:00226005 | Stomach | SIM | digestive system process | 18/708 | 104/18723 | 6.37e-08 | 6.30e-06 | 18 |
| GO:00508924 | Stomach | SIM | intestinal absorption | 11/708 | 41/18723 | 2.34e-07 | 1.68e-05 | 11 |
| GO:00988564 | Stomach | SIM | intestinal lipid absorption | 7/708 | 21/18723 | 7.85e-06 | 2.99e-04 | 7 |
| GO:00108764 | Stomach | SIM | lipid localization | 30/708 | 448/18723 | 1.87e-03 | 2.08e-02 | 30 |
| GO:00068693 | Stomach | SIM | lipid transport | 27/708 | 398/18723 | 2.58e-03 | 2.55e-02 | 27 |
| Page: 1 |
| Pathway ID | Tissue | Disease Stage | Description | Gene Ratio | Bg Ratio | pvalue | p.adjust | qvalue | Count |
| hsa04975 | Stomach | GC | Fat digestion and absorption | 14/708 | 43/8465 | 5.71e-06 | 8.30e-05 | 5.84e-05 | 14 |
| hsa03320 | Stomach | GC | PPAR signaling pathway | 18/708 | 75/8465 | 3.26e-05 | 4.01e-04 | 2.82e-04 | 18 |
| hsa049751 | Stomach | GC | Fat digestion and absorption | 14/708 | 43/8465 | 5.71e-06 | 8.30e-05 | 5.84e-05 | 14 |
| hsa033201 | Stomach | GC | PPAR signaling pathway | 18/708 | 75/8465 | 3.26e-05 | 4.01e-04 | 2.82e-04 | 18 |
| hsa049752 | Stomach | SIM | Fat digestion and absorption | 12/465 | 43/8465 | 2.11e-06 | 3.05e-05 | 2.45e-05 | 12 |
| hsa033202 | Stomach | SIM | PPAR signaling pathway | 15/465 | 75/8465 | 1.08e-05 | 1.42e-04 | 1.14e-04 | 15 |
| hsa049753 | Stomach | SIM | Fat digestion and absorption | 12/465 | 43/8465 | 2.11e-06 | 3.05e-05 | 2.45e-05 | 12 |
| hsa033203 | Stomach | SIM | PPAR signaling pathway | 15/465 | 75/8465 | 1.08e-05 | 1.42e-04 | 1.14e-04 | 15 |
| Page: 1 |
Top |
Cell-cell communication analysis |
| Identification of potential cell-cell interactions between two cell types and their ligand-receptor pairs for different disease states |
| Ligand | Receptor | LRpair | Pathway | Tissue | Disease Stage |
| Page: 1 |
Top |
Single-cell gene regulatory network inference analysis |
| Find out the significant the regulons (TFs) and the target genes of each regulon across cell types for different disease states |
| TF | Cell Type | Tissue | Disease Stage | Target Gene | RSS | Regulon Activity |
| ∗The dot plots of a searched regulon are shown for all cell subpopulations in each disease state of each tissue based on the regulon specific score inferred using pySCENIC and by calculating the average expression. |
| Page: 1 |
Top |
Somatic mutation of malignant transformation related genes |
| Annotation of somatic variants for genes involved in malignant transformation |
| Hugo Symbol | Variant Class | Variant Classification | dbSNP RS | HGVSc | HGVSp | HGVSp Short | SWISSPROT | BIOTYPE | SIFT | PolyPhen | Tumor Sample Barcode | Tissue | Histology | Sex | Age | Stage | Therapy Types | Drugs | Outcome |
| FABP2 | SNV | Missense_Mutation | novel | c.224A>T | p.Asp75Val | p.D75V | P12104 | protein_coding | deleterious(0) | probably_damaging(0.993) | TCGA-DD-AADS-01 | Liver | liver hepatocellular carcinoma | Male | <65 | I/II | Unknown | Unknown | SD |
| FABP2 | SNV | Missense_Mutation | novel | c.97N>A | p.Ala33Thr | p.A33T | P12104 | protein_coding | deleterious(0.03) | benign(0.181) | TCGA-85-A4JB-01 | Lung | lung squamous cell carcinoma | Male | >=65 | I/II | Chemotherapy | unknown | CR |
| FABP2 | SNV | Missense_Mutation | novel | c.190G>C | p.Glu64Gln | p.E64Q | P12104 | protein_coding | tolerated(0.46) | possibly_damaging(0.635) | TCGA-CX-A4AQ-01 | Oral cavity | head & neck squamous cell carcinoma | Male | <65 | I/II | Unknown | Unknown | SD |
| FABP2 | deletion | Frame_Shift_Del | novel | c.369delN | p.Glu124LysfsTer66 | p.E124Kfs*66 | P12104 | protein_coding | TCGA-HC-7818-01 | Prostate | prostate adenocarcinoma | Male | >=65 | 7 | Unknown | Unknown | SD | ||
| FABP2 | SNV | Missense_Mutation | c.239N>T | p.Arg80Met | p.R80M | P12104 | protein_coding | deleterious(0.02) | benign(0.071) | TCGA-BR-8373-01 | Stomach | stomach adenocarcinoma | Female | >=65 | III/IV | Chemotherapy | 5-fluorouracil | CR |
| Page: 1 2 |
Top |
Related drugs of malignant transformation related genes |
| Identification of chemicals and drugs interact with genes involved in malignant transfromation |
| (DGIdb 4.0) |
| Entrez ID | Symbol | Category | Interaction Types | Drug Claim Name | Drug Name | PMIDs |
| Page: 1 |

Copyright 2023-Present -The University of Texas Health Science Center at Houston |