
|
|||||
|
 | |
| |
| |
| |
| |
| |
|
Gene: CHURC1 |
Gene summary for CHURC1 |
| Gene information | Species | Human | Gene symbol | CHURC1 | Gene ID | 91612 |
| Gene name | churchill domain containing 1 | |
| Gene Alias | C14orf52 | |
| Cytomap | 14q23.3 | |
| Gene Type | protein-coding | GO ID | GO:0006139 | UniProtAcc | Q8WUH1 |
Top |
Malignant transformation analysis |
| Identification of the aberrant gene expression in precancerous and cancerous lesions by comparing the gene expression of stem-like cells in diseased tissues with normal stem cells |
| Entrez ID | Symbol | Replicates | Species | Organ | Tissue | Adj P-value | Log2FC | Malignancy |
| 91612 | CHURC1 | CA_HPV_1 | Human | Cervix | CC | 1.07e-05 | -7.14e-02 | 0.0264 |
| 91612 | CHURC1 | HSIL_HPV_2 | Human | Cervix | HSIL_HPV | 4.42e-02 | 1.95e-01 | 0.0208 |
| 91612 | CHURC1 | CCI_1 | Human | Cervix | CC | 4.30e-07 | -6.15e-01 | 0.528 |
| 91612 | CHURC1 | CCI_2 | Human | Cervix | CC | 7.90e-09 | -6.36e-01 | 0.5249 |
| 91612 | CHURC1 | CCI_3 | Human | Cervix | CC | 5.70e-13 | -6.36e-01 | 0.516 |
| 91612 | CHURC1 | CCII_1 | Human | Cervix | CC | 4.86e-18 | -6.36e-01 | 0.3249 |
| 91612 | CHURC1 | sample3 | Human | Cervix | CC | 2.13e-02 | 2.03e-01 | 0.1387 |
| 91612 | CHURC1 | L1 | Human | Cervix | CC | 3.13e-02 | -2.42e-01 | 0.0802 |
| 91612 | CHURC1 | HTA11_3410_2000001011 | Human | Colorectum | AD | 6.00e-08 | 1.81e-01 | 0.0155 |
| 91612 | CHURC1 | HTA11_2487_2000001011 | Human | Colorectum | SER | 1.03e-09 | 3.09e-01 | -0.1808 |
| 91612 | CHURC1 | HTA11_2951_2000001011 | Human | Colorectum | AD | 3.40e-03 | 2.15e-01 | 0.0216 |
| 91612 | CHURC1 | HTA11_1938_2000001011 | Human | Colorectum | AD | 3.90e-21 | 5.19e-01 | -0.0811 |
| 91612 | CHURC1 | HTA11_78_2000001011 | Human | Colorectum | AD | 1.40e-18 | 4.72e-01 | -0.1088 |
| 91612 | CHURC1 | HTA11_347_2000001011 | Human | Colorectum | AD | 7.03e-39 | 6.51e-01 | -0.1954 |
| 91612 | CHURC1 | HTA11_411_2000001011 | Human | Colorectum | SER | 4.01e-04 | 3.61e-01 | -0.2602 |
| 91612 | CHURC1 | HTA11_2112_2000001011 | Human | Colorectum | SER | 1.90e-02 | 3.00e-01 | -0.2196 |
| 91612 | CHURC1 | HTA11_3361_2000001011 | Human | Colorectum | AD | 6.03e-08 | 2.50e-01 | -0.1207 |
| 91612 | CHURC1 | HTA11_83_2000001011 | Human | Colorectum | SER | 2.83e-15 | 5.14e-01 | -0.1526 |
| 91612 | CHURC1 | HTA11_696_2000001011 | Human | Colorectum | AD | 6.79e-12 | 3.58e-01 | -0.1464 |
| 91612 | CHURC1 | HTA11_866_2000001011 | Human | Colorectum | AD | 1.39e-11 | 3.16e-01 | -0.1001 |
| Page: 1 2 3 4 5 6 7 8 9 10 11 12 |
| Tissue | Expression Dynamics | Abbreviation |
| Cervix |  | CC: Cervix cancer |
| HSIL_HPV: HPV-infected high-grade squamous intraepithelial lesions | ||
| N_HPV: HPV-infected normal cervix | ||
| Colorectum (GSE201348) |  | FAP: Familial adenomatous polyposis |
| CRC: Colorectal cancer | ||
| Colorectum (HTA11) | 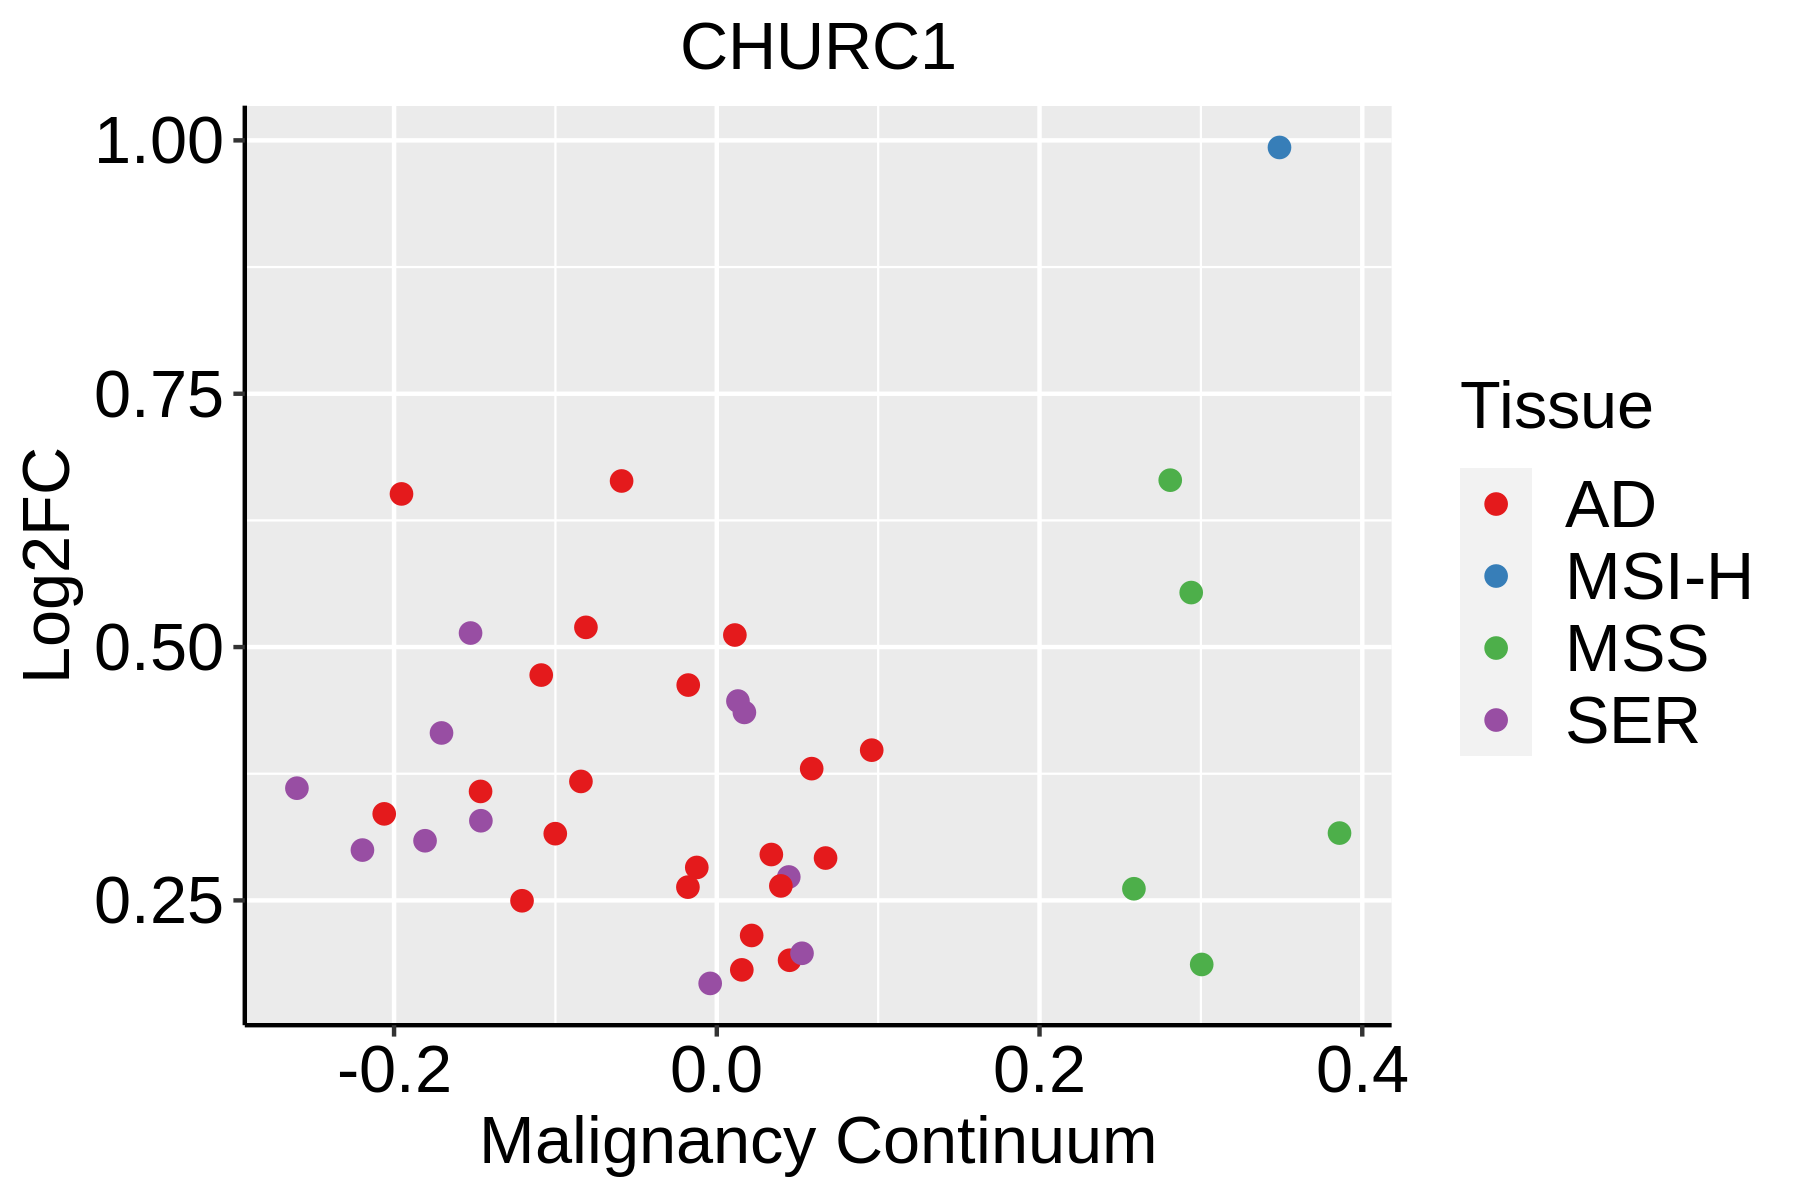 | AD: Adenomas |
| SER: Sessile serrated lesions | ||
| MSI-H: Microsatellite-high colorectal cancer | ||
| MSS: Microsatellite stable colorectal cancer | ||
| Endometrium |  | AEH: Atypical endometrial hyperplasia |
| EEC: Endometrioid Cancer | ||
| Esophagus |  | ESCC: Esophageal squamous cell carcinoma |
| HGIN: High-grade intraepithelial neoplasias | ||
| LGIN: Low-grade intraepithelial neoplasias | ||
| GC |  | CAG: Chronic atrophic gastritis |
| CAG with IM: Chronic atrophic gastritis with intestinal metaplasia | ||
| CSG: Chronic superficial gastritis | ||
| GC: Gastric cancer | ||
| SIM: Severe intestinal metaplasia | ||
| WIM: Wild intestinal metaplasia | ||
| Liver |  | HCC: Hepatocellular carcinoma |
| NAFLD: Non-alcoholic fatty liver disease | ||
| Oral Cavity | 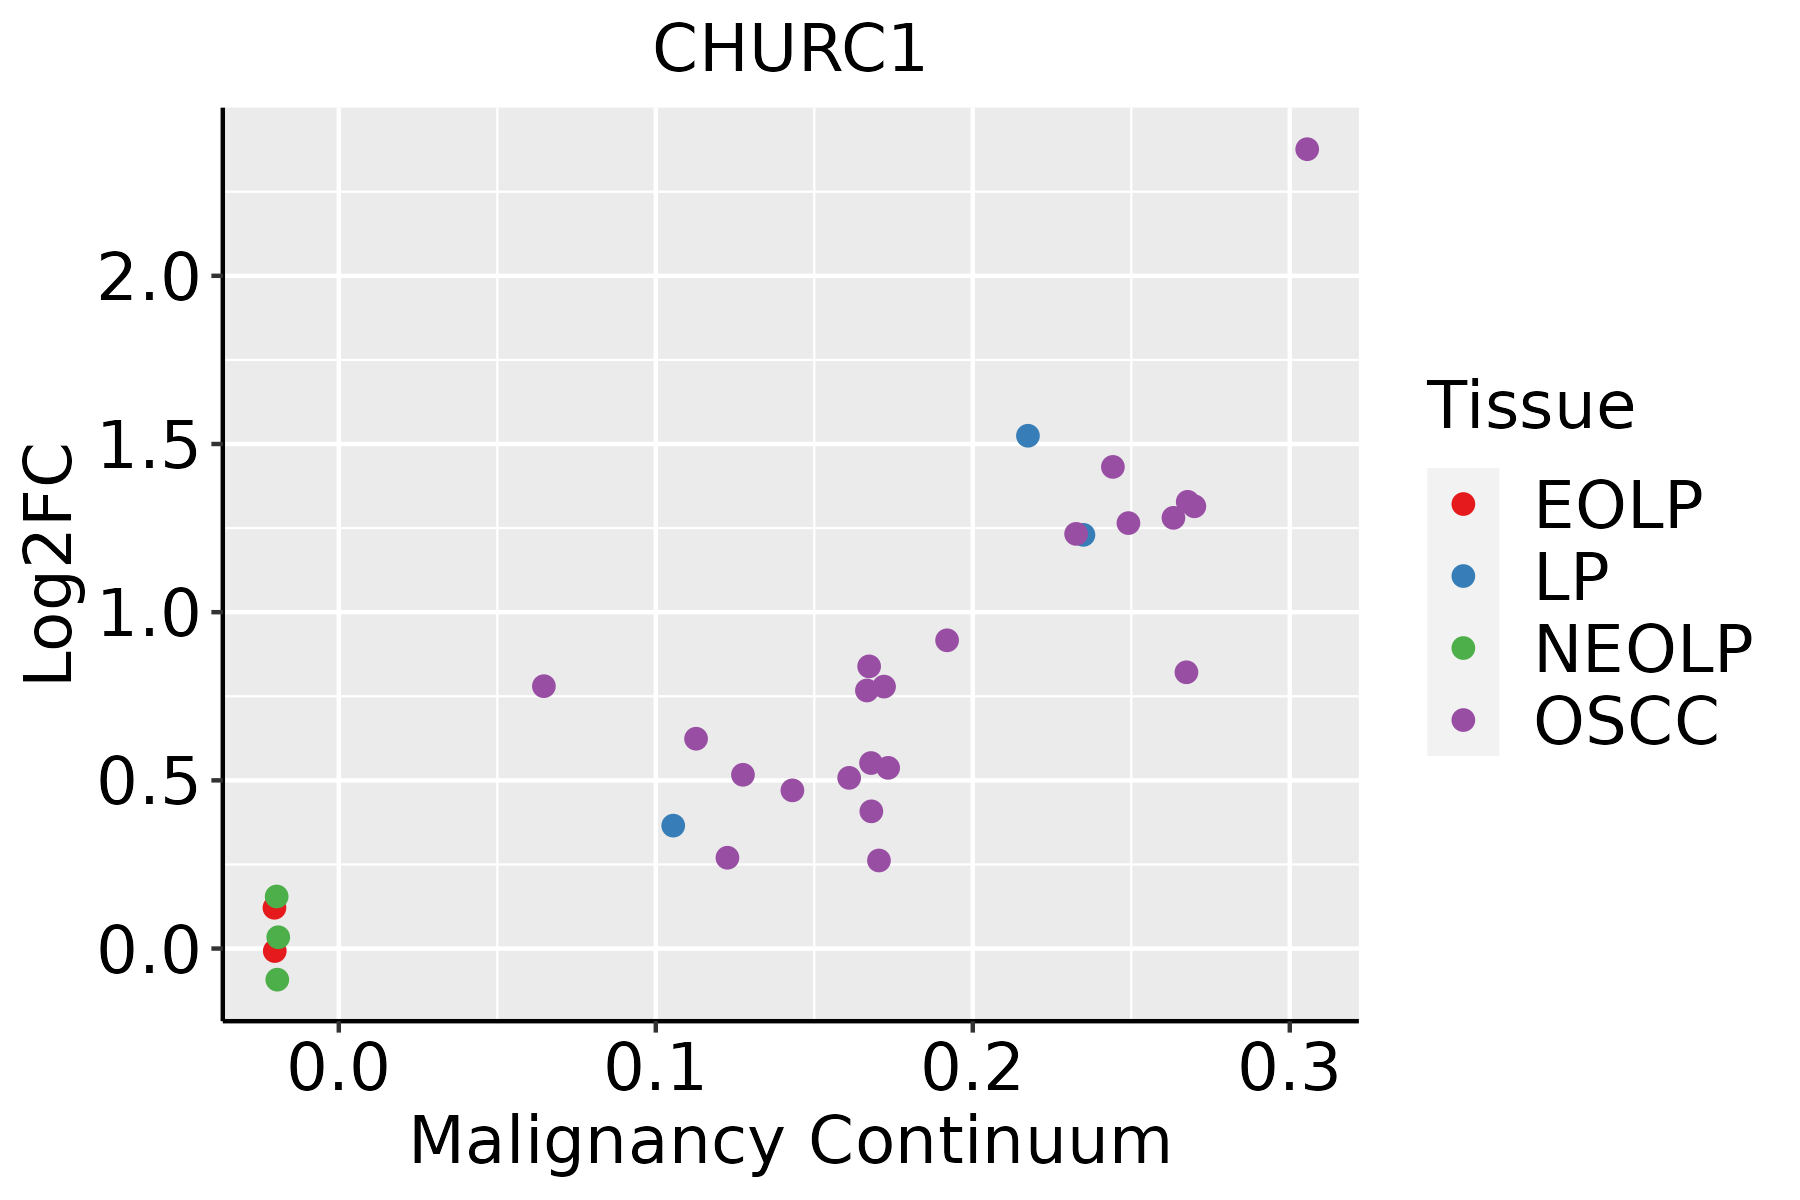 | EOLP: Erosive Oral lichen planus |
| LP: leukoplakia | ||
| NEOLP: Non-erosive oral lichen planus | ||
| OSCC: Oral squamous cell carcinoma | ||
| Prostate | 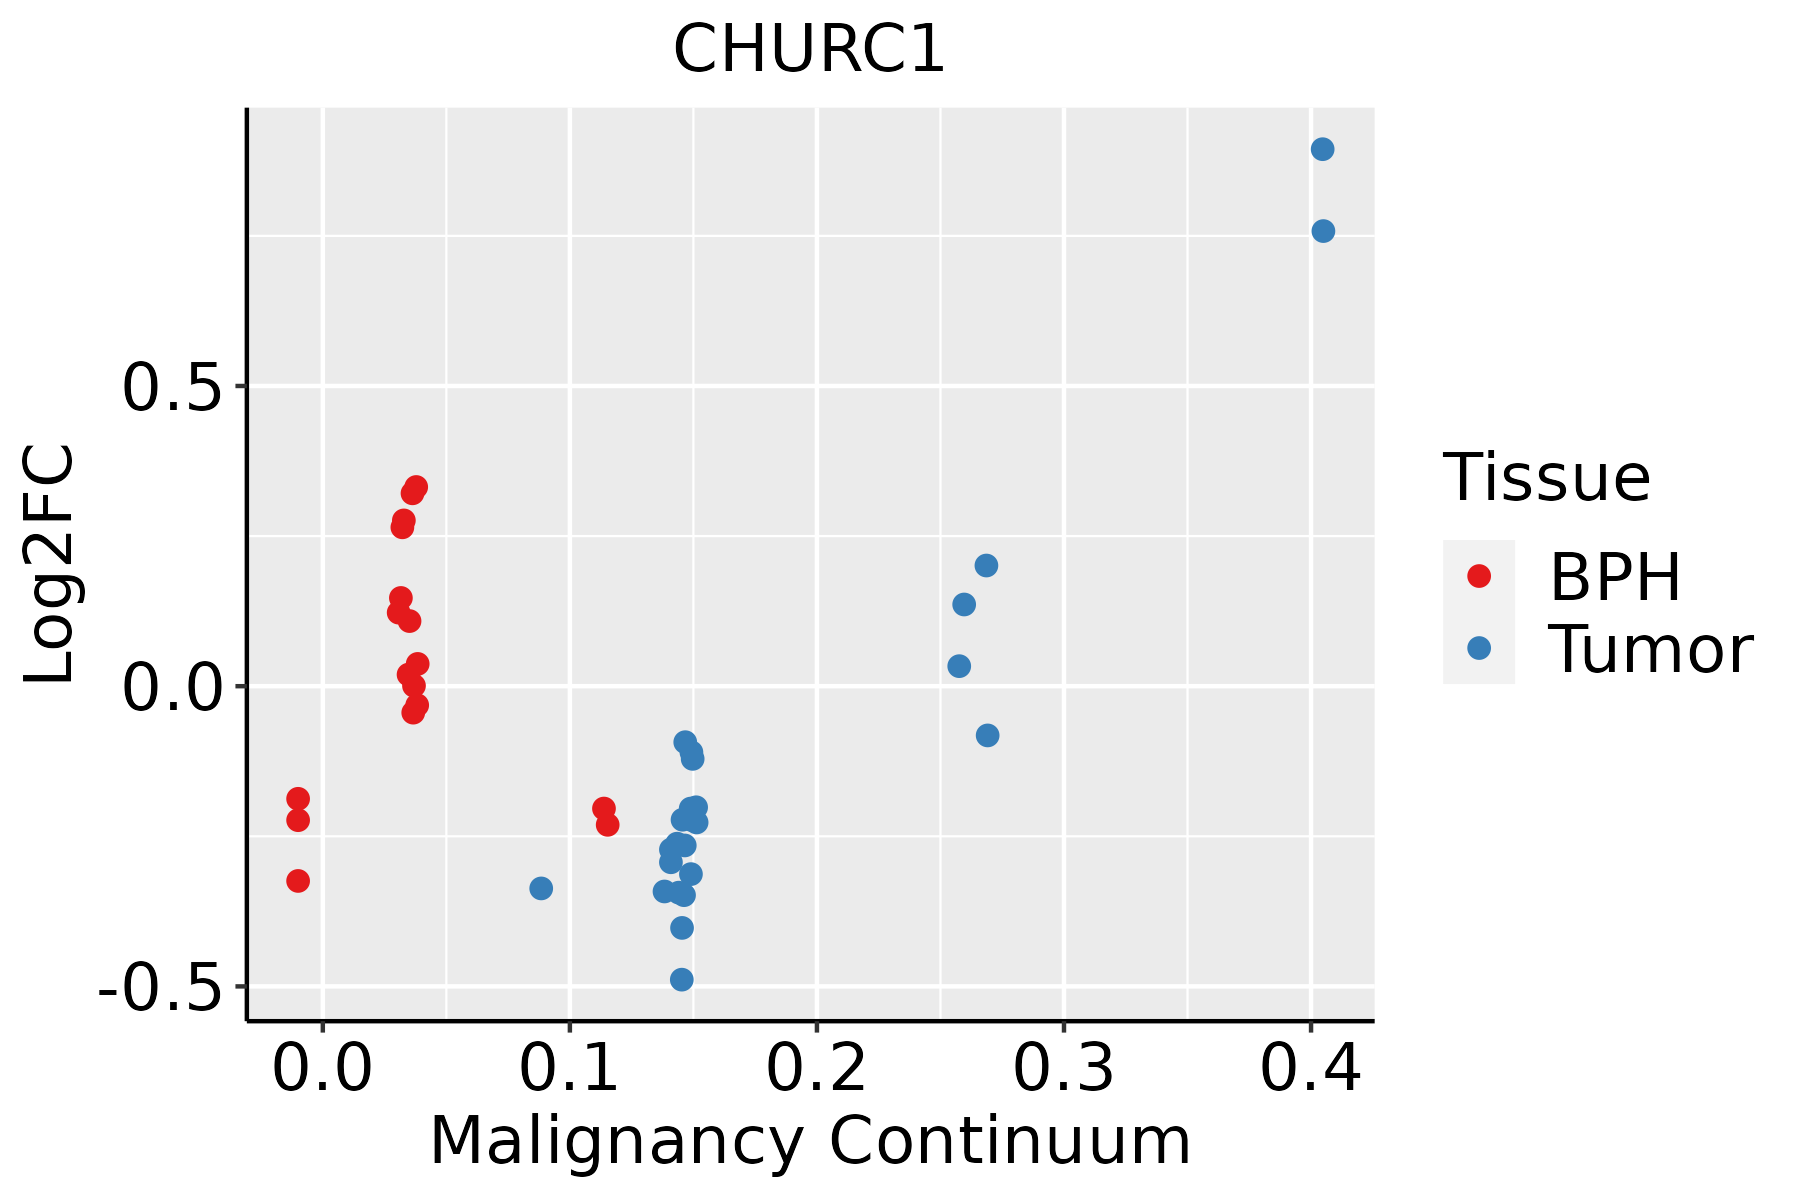 | BPH: Benign Prostatic Hyperplasia |
| Skin | 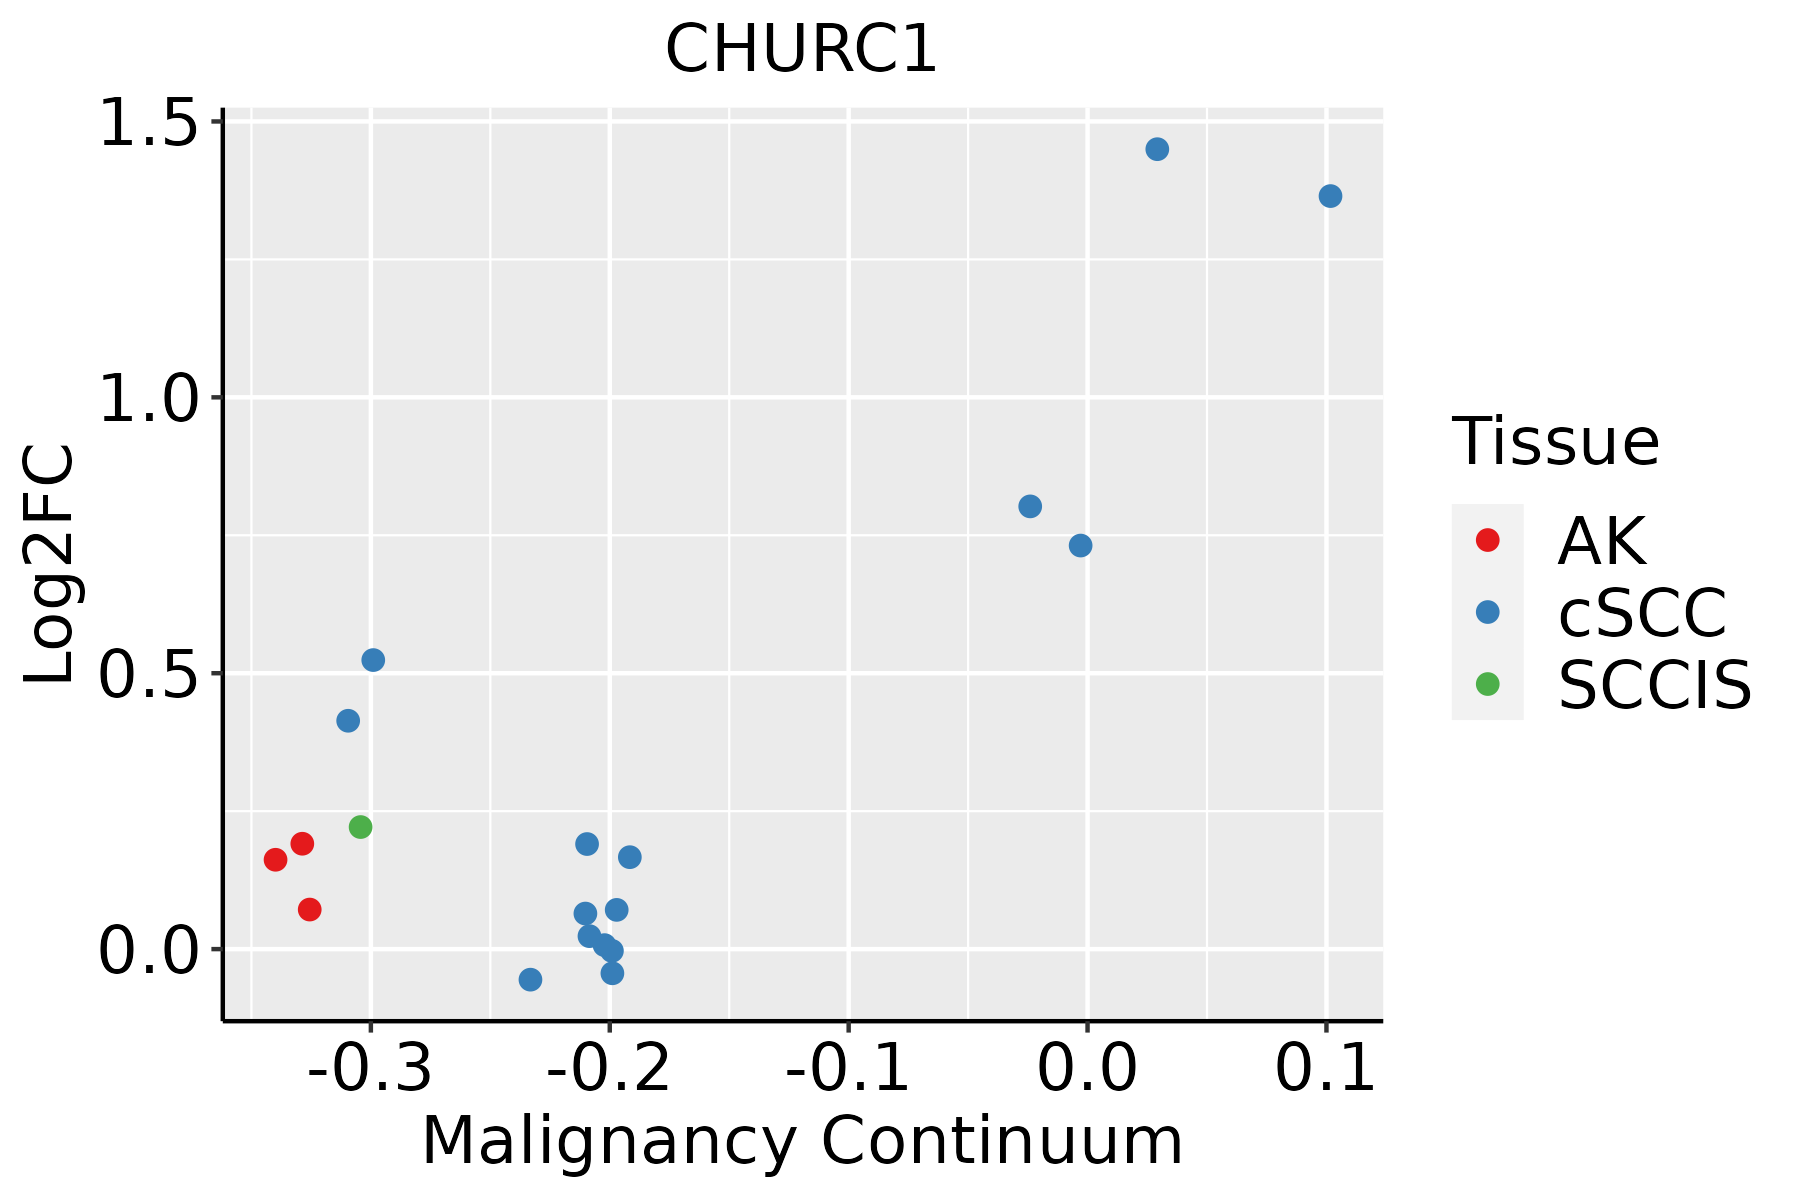 | AK: Actinic keratosis |
| cSCC: Cutaneous squamous cell carcinoma | ||
| SCCIS:squamous cell carcinoma in situ | ||
| Thyroid | 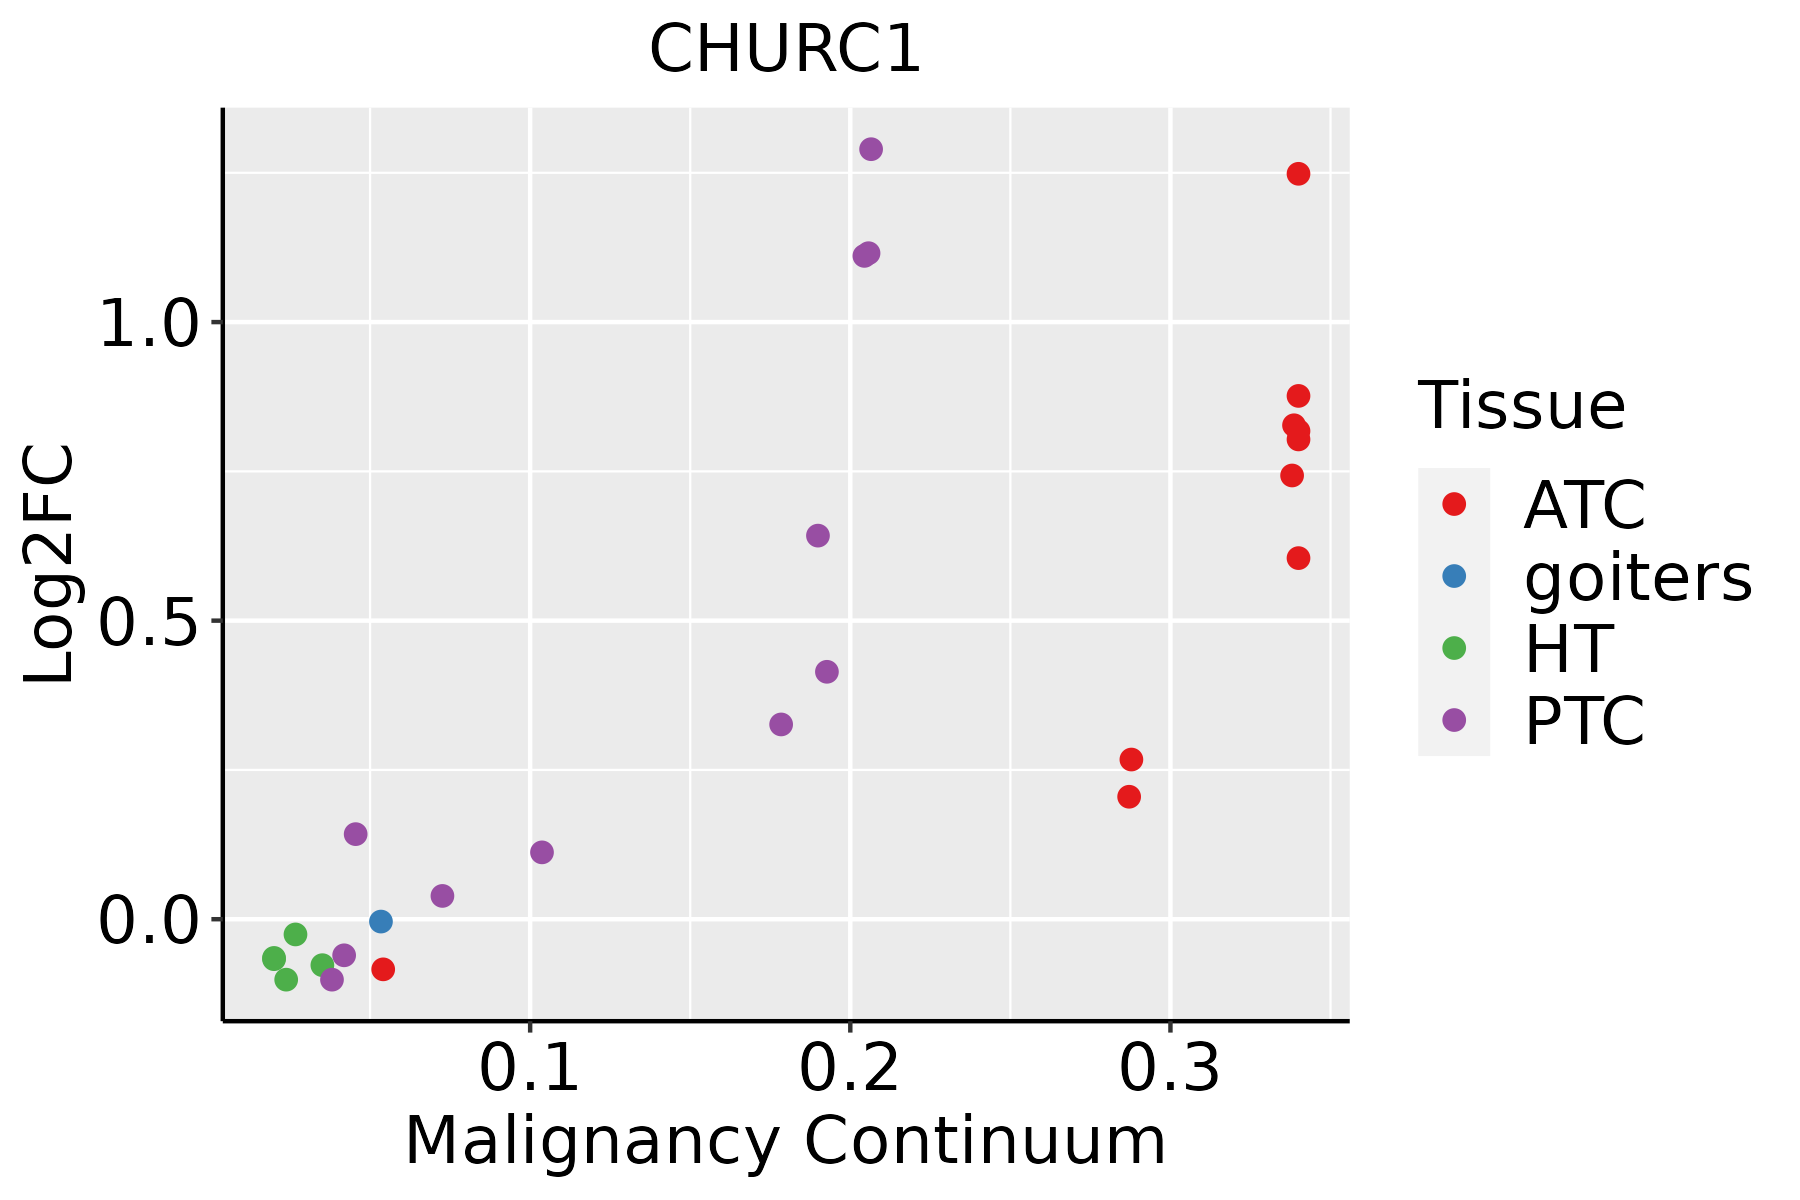 | ATC: Anaplastic thyroid cancer |
| HT: Hashimoto's thyroiditis | ||
| PTC: Papillary thyroid cancer |
| ∗log2FC in expression of this searched gene in stem-like cells from each diseased tissue sample relative to stem-like cells in normal samples in each tissue plotted against the malignancy continuum. Samples are colored based on if they are from different disease stage. |
Top |
Malignant transformation related pathway analysis |
| Find out the enriched GO biological processes and KEGG pathways involved in transition from healthy to precancer to cancer |
| Tissue | Disease Stage | Enriched GO biological Processes |
| Colorectum | AD |  |
| Colorectum | SER |  |
| Colorectum | MSS |  |
| Colorectum | MSI-H |  |
| Colorectum | FAP |  |
| ∗Top 15 enriched GO BP terms are showed in the bar plot of each disease state in each tissue. Each row represents a significant GO biological process which is colored according to the -log10(p.adjust). |
| Page: 1 2 3 4 5 6 7 8 9 |
| GO ID | Tissue | Disease Stage | Description | Gene Ratio | Bg Ratio | pvalue | p.adjust | Count |
| GO:00717742 | Prostate | BPH | response to fibroblast growth factor | 31/3107 | 120/18723 | 6.55e-03 | 2.94e-02 | 31 |
| GO:00443441 | Prostate | BPH | cellular response to fibroblast growth factor stimulus | 29/3107 | 113/18723 | 9.17e-03 | 3.91e-02 | 29 |
| GO:00717741 | Prostate | Tumor | response to fibroblast growth factor | 31/3246 | 120/18723 | 1.22e-02 | 4.97e-02 | 31 |
| GO:00717743 | Skin | AK | response to fibroblast growth factor | 28/1910 | 120/18723 | 2.23e-05 | 4.08e-04 | 28 |
| GO:00443442 | Skin | AK | cellular response to fibroblast growth factor stimulus | 26/1910 | 113/18723 | 5.55e-05 | 8.43e-04 | 26 |
| Page: 1 |
| Pathway ID | Tissue | Disease Stage | Description | Gene Ratio | Bg Ratio | pvalue | p.adjust | qvalue | Count |
| Page: 1 |
Top |
Cell-cell communication analysis |
| Identification of potential cell-cell interactions between two cell types and their ligand-receptor pairs for different disease states |
| Ligand | Receptor | LRpair | Pathway | Tissue | Disease Stage |
| Page: 1 |
Top |
Single-cell gene regulatory network inference analysis |
| Find out the significant the regulons (TFs) and the target genes of each regulon across cell types for different disease states |
| TF | Cell Type | Tissue | Disease Stage | Target Gene | RSS | Regulon Activity |
| CHURC1 | BN | Breast | ADJ | MPP7,IPP,GNL1, etc. | 1.65e-01 |  |
| CHURC1 | TFH | Breast | DCIS | MPP7,IPP,GNL1, etc. | 8.61e-02 |  |
| CHURC1 | BN | Breast | IDC | MPP7,IPP,GNL1, etc. | 1.83e-01 |  |
| CHURC1 | CD4TN | Breast | IDC | MPP7,IPP,GNL1, etc. | 1.16e-01 | |
| CHURC1 | BN | Breast | Precancer | MPP7,IPP,GNL1, etc. | 6.77e-02 |  |
| CHURC1 | MYOFIB | Colorectum | CRC | SOD3,APOL3,PDSS1, etc. | 5.13e-02 |  |
| CHURC1 | GDT | Endometrium | ADJ | RNF157,OTUD5,MYL9, etc. | 1.50e-01 |  |
| CHURC1 | CD8TCM | Endometrium | ADJ | RNF157,OTUD5,MYL9, etc. | 1.77e-01 | |
| CHURC1 | TH1 | Endometrium | EEC | RNF157,OTUD5,MYL9, etc. | 9.54e-02 |  |
| CHURC1 | MSC.MVA | Oral cavity | EOLP | TUBA4A,DSTN,SLPI, etc. | 3.33e-02 |  |
| ∗The dot plots of a searched regulon are shown for all cell subpopulations in each disease state of each tissue based on the regulon specific score inferred using pySCENIC and by calculating the average expression. |
| Page: 1 2 3 |
Top |
Somatic mutation of malignant transformation related genes |
| Annotation of somatic variants for genes involved in malignant transformation |
| Hugo Symbol | Variant Class | Variant Classification | dbSNP RS | HGVSc | HGVSp | HGVSp Short | SWISSPROT | BIOTYPE | SIFT | PolyPhen | Tumor Sample Barcode | Tissue | Histology | Sex | Age | Stage | Therapy Types | Drugs | Outcome |
| CHURC1 | SNV | Missense_Mutation | novel | c.200N>C | p.Leu67Pro | p.L67P | Q8WUH1 | protein_coding | tolerated(0.1) | probably_damaging(0.951) | TCGA-CV-5966-01 | Oral cavity | head & neck squamous cell carcinoma | Female | <65 | I/II | Unknown | Unknown | SD |
| CHURC1 | SNV | Missense_Mutation | c.38C>T | p.Ser13Phe | p.S13F | Q8WUH1 | protein_coding | tolerated_low_confidence(0.07) | possibly_damaging(0.692) | TCGA-CD-5813-01 | Stomach | stomach adenocarcinoma | Male | <65 | I/II | Unknown | Unknown | PD | |
| CHURC1 | SNV | Missense_Mutation | c.289N>C | p.Ala97Pro | p.A97P | Q8WUH1 | protein_coding | deleterious(0) | probably_damaging(0.998) | TCGA-HF-7132-01 | Stomach | stomach adenocarcinoma | Male | Unknown | I/II | Chemotherapy | fluorouracil | SD |
| Page: 1 2 |
Top |
Related drugs of malignant transformation related genes |
| Identification of chemicals and drugs interact with genes involved in malignant transfromation |
| (DGIdb 4.0) |
| Entrez ID | Symbol | Category | Interaction Types | Drug Claim Name | Drug Name | PMIDs |
| 91612 | CHURC1 | NA | methylphenidate | METHYLPHENIDATE | 29382897 |
| Page: 1 |

Copyright 2023-Present -The University of Texas Health Science Center at Houston |