
|
|||||
|
 | |
| |
| |
| |
| |
| |
|
Gene: APBB1 |
Gene summary for APBB1 |
| Gene information | Species | Human | Gene symbol | APBB1 | Gene ID | 322 |
| Gene name | amyloid beta precursor protein binding family B member 1 | |
| Gene Alias | FE65 | |
| Cytomap | 11p15.4 | |
| Gene Type | protein-coding | GO ID | GO:0000122 | UniProtAcc | O00213 |
Top |
Malignant transformation analysis |
| Identification of the aberrant gene expression in precancerous and cancerous lesions by comparing the gene expression of stem-like cells in diseased tissues with normal stem cells |
| Entrez ID | Symbol | Replicates | Species | Organ | Tissue | Adj P-value | Log2FC | Malignancy |
| 322 | APBB1 | HCC1_Meng | Human | Liver | HCC | 2.77e-09 | -4.56e-02 | 0.0246 |
| 322 | APBB1 | S014 | Human | Liver | HCC | 1.44e-16 | 6.08e-01 | 0.2254 |
| 322 | APBB1 | S015 | Human | Liver | HCC | 6.33e-09 | 5.27e-01 | 0.2375 |
| 322 | APBB1 | S016 | Human | Liver | HCC | 4.40e-17 | 5.19e-01 | 0.2243 |
| Page: 1 |
| Tissue | Expression Dynamics | Abbreviation |
| Liver | 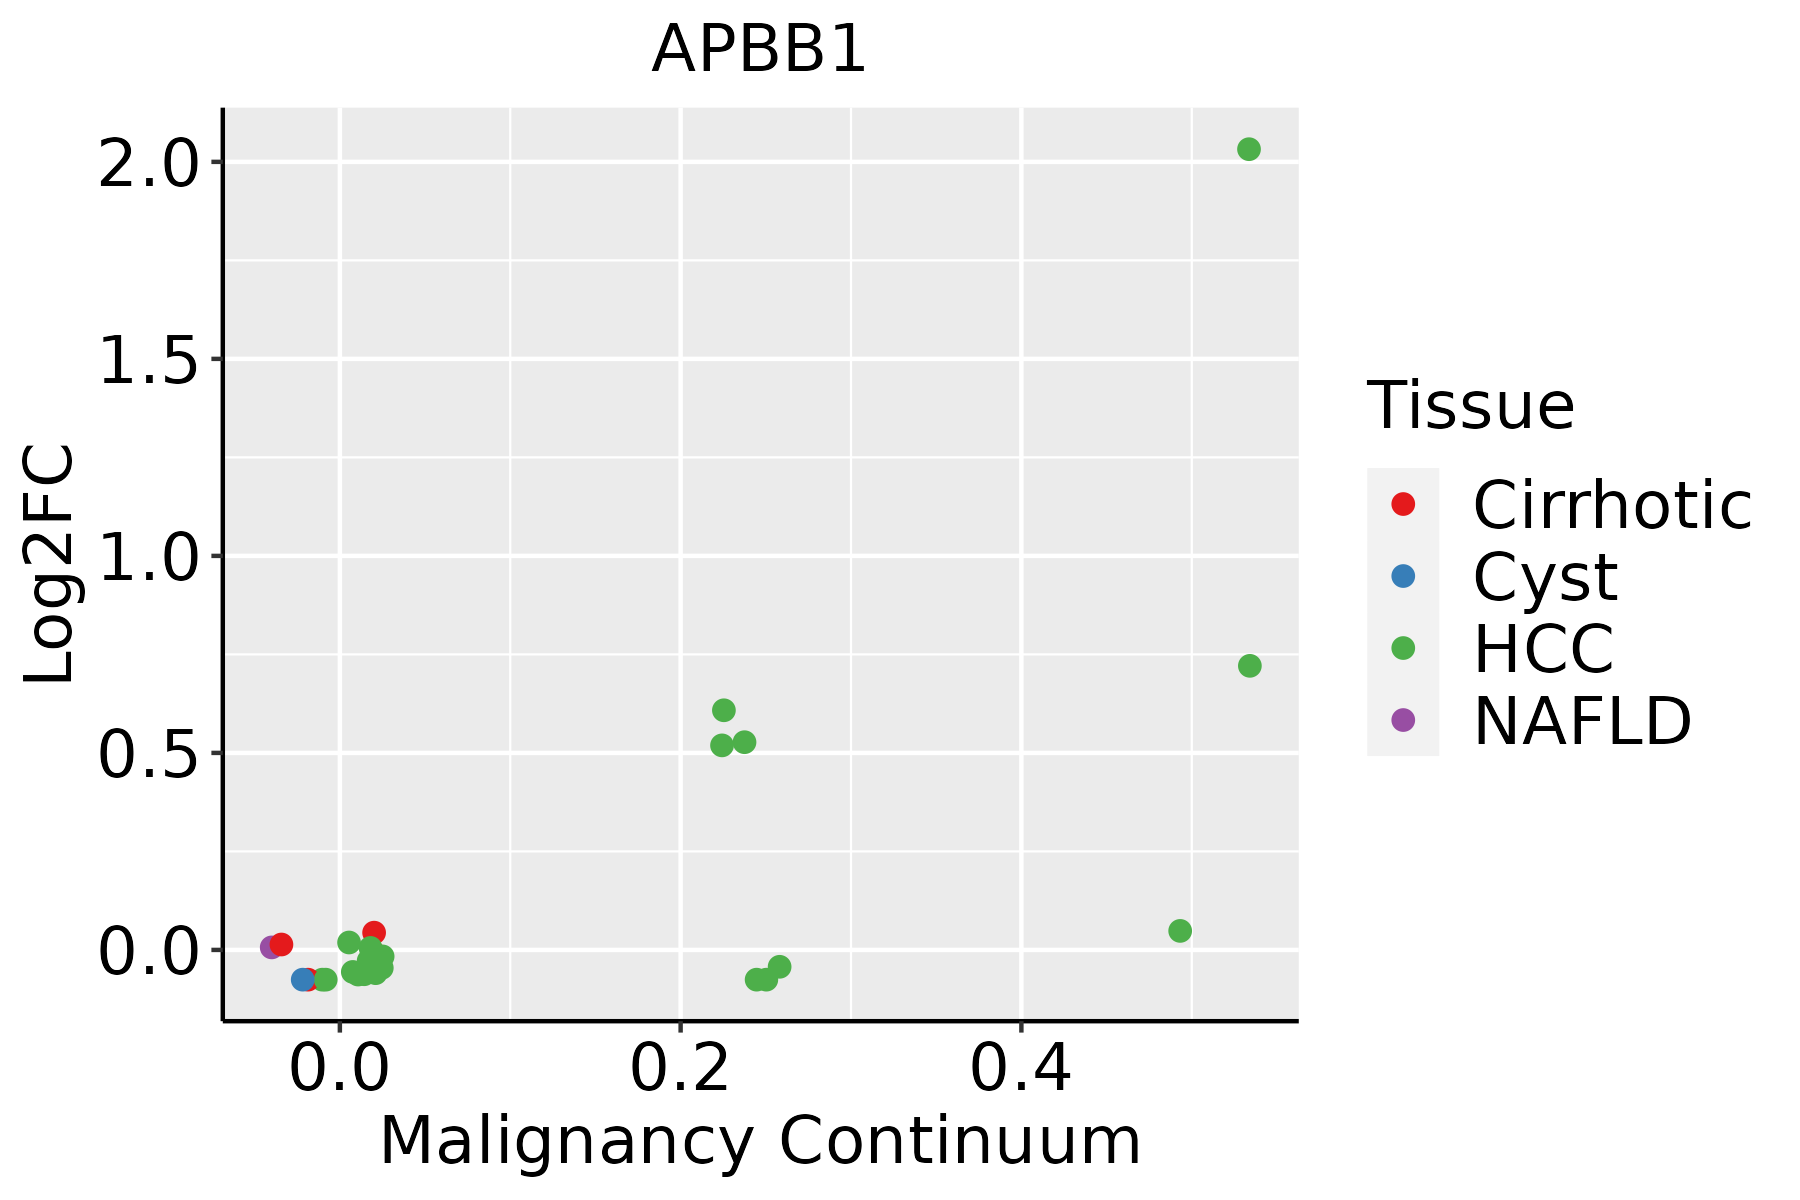 | HCC: Hepatocellular carcinoma |
| NAFLD: Non-alcoholic fatty liver disease |
| ∗log2FC in expression of this searched gene in stem-like cells from each diseased tissue sample relative to stem-like cells in normal samples in each tissue plotted against the malignancy continuum. Samples are colored based on if they are from different disease stage. |
Top |
Malignant transformation related pathway analysis |
| Find out the enriched GO biological processes and KEGG pathways involved in transition from healthy to precancer to cancer |
| Tissue | Disease Stage | Enriched GO biological Processes |
| Colorectum | AD |  |
| Colorectum | SER |  |
| Colorectum | MSS |  |
| Colorectum | MSI-H |  |
| Colorectum | FAP |  |
| ∗Top 15 enriched GO BP terms are showed in the bar plot of each disease state in each tissue. Each row represents a significant GO biological process which is colored according to the -log10(p.adjust). |
| Page: 1 2 3 4 5 6 7 8 9 |
| GO ID | Tissue | Disease Stage | Description | Gene Ratio | Bg Ratio | pvalue | p.adjust | Count |
| GO:00457857 | Liver | Cirrhotic | positive regulation of cell adhesion | 141/4634 | 437/18723 | 2.05e-04 | 1.89e-03 | 141 |
| GO:001657021 | Liver | HCC | histone modification | 283/7958 | 463/18723 | 2.68e-16 | 2.33e-14 | 283 |
| GO:190495122 | Liver | HCC | positive regulation of establishment of protein localization | 207/7958 | 319/18723 | 3.95e-16 | 3.29e-14 | 207 |
| GO:005122222 | Liver | HCC | positive regulation of protein transport | 194/7958 | 303/18723 | 2.41e-14 | 1.56e-12 | 194 |
| GO:00182052 | Liver | HCC | peptidyl-lysine modification | 230/7958 | 376/18723 | 1.51e-13 | 8.32e-12 | 230 |
| GO:00064732 | Liver | HCC | protein acetylation | 135/7958 | 201/18723 | 1.20e-12 | 5.92e-11 | 135 |
| GO:00435432 | Liver | HCC | protein acylation | 157/7958 | 243/18723 | 2.40e-12 | 1.12e-10 | 157 |
| GO:00183942 | Liver | HCC | peptidyl-lysine acetylation | 116/7958 | 169/18723 | 5.11e-12 | 2.23e-10 | 116 |
| GO:00064752 | Liver | HCC | internal protein amino acid acetylation | 107/7958 | 160/18723 | 3.77e-10 | 1.23e-08 | 107 |
| GO:00183932 | Liver | HCC | internal peptidyl-lysine acetylation | 105/7958 | 158/18723 | 9.48e-10 | 2.90e-08 | 105 |
| GO:00165732 | Liver | HCC | histone acetylation | 101/7958 | 152/18723 | 1.99e-09 | 5.63e-08 | 101 |
| GO:00439671 | Liver | HCC | histone H4 acetylation | 50/7958 | 67/18723 | 9.14e-08 | 1.82e-06 | 50 |
| GO:001003822 | Liver | HCC | response to metal ion | 208/7958 | 373/18723 | 1.35e-07 | 2.56e-06 | 208 |
| GO:005105221 | Liver | HCC | regulation of DNA metabolic process | 198/7958 | 359/18723 | 7.62e-07 | 1.17e-05 | 198 |
| GO:200102021 | Liver | HCC | regulation of response to DNA damage stimulus | 128/7958 | 219/18723 | 1.31e-06 | 1.90e-05 | 128 |
| GO:19019871 | Liver | HCC | regulation of cell cycle phase transition | 211/7958 | 390/18723 | 2.11e-06 | 2.89e-05 | 211 |
| GO:003134611 | Liver | HCC | positive regulation of cell projection organization | 193/7958 | 353/18723 | 2.28e-06 | 3.08e-05 | 193 |
| GO:0045786 | Liver | HCC | negative regulation of cell cycle | 204/7958 | 385/18723 | 1.84e-05 | 1.99e-04 | 204 |
| GO:00448432 | Liver | HCC | cell cycle G1/S phase transition | 134/7958 | 241/18723 | 2.60e-05 | 2.70e-04 | 134 |
| GO:005105411 | Liver | HCC | positive regulation of DNA metabolic process | 113/7958 | 201/18723 | 5.76e-05 | 5.33e-04 | 113 |
| Page: 1 2 |
| Pathway ID | Tissue | Disease Stage | Description | Gene Ratio | Bg Ratio | pvalue | p.adjust | qvalue | Count |
| hsa0501022 | Liver | HCC | Alzheimer disease | 254/4020 | 384/8465 | 3.75e-14 | 8.97e-13 | 4.99e-13 | 254 |
| hsa0501032 | Liver | HCC | Alzheimer disease | 254/4020 | 384/8465 | 3.75e-14 | 8.97e-13 | 4.99e-13 | 254 |
| Page: 1 |
Top |
Cell-cell communication analysis |
| Identification of potential cell-cell interactions between two cell types and their ligand-receptor pairs for different disease states |
| Ligand | Receptor | LRpair | Pathway | Tissue | Disease Stage |
| Page: 1 |
Top |
Single-cell gene regulatory network inference analysis |
| Find out the significant the regulons (TFs) and the target genes of each regulon across cell types for different disease states |
| TF | Cell Type | Tissue | Disease Stage | Target Gene | RSS | Regulon Activity |
| ∗The dot plots of a searched regulon are shown for all cell subpopulations in each disease state of each tissue based on the regulon specific score inferred using pySCENIC and by calculating the average expression. |
| Page: 1 |
Top |
Somatic mutation of malignant transformation related genes |
| Annotation of somatic variants for genes involved in malignant transformation |
| Hugo Symbol | Variant Class | Variant Classification | dbSNP RS | HGVSc | HGVSp | HGVSp Short | SWISSPROT | BIOTYPE | SIFT | PolyPhen | Tumor Sample Barcode | Tissue | Histology | Sex | Age | Stage | Therapy Types | Drugs | Outcome |
| APBB1 | SNV | Missense_Mutation | rs748833409 | c.1363N>A | p.Val455Ile | p.V455I | O00213 | protein_coding | deleterious(0.01) | benign(0.058) | TCGA-AA-3672-01 | Colorectum | colon adenocarcinoma | Female | >=65 | III/IV | Unknown | Unknown | SD |
| APBB1 | SNV | Missense_Mutation | c.450N>T | p.Glu150Asp | p.E150D | O00213 | protein_coding | tolerated(0.28) | benign(0.037) | TCGA-AA-3715-01 | Colorectum | colon adenocarcinoma | Male | >=65 | I/II | Unknown | Unknown | PD | |
| APBB1 | SNV | Missense_Mutation | rs370357442 | c.1196N>A | p.Arg399His | p.R399H | O00213 | protein_coding | deleterious(0) | benign(0.043) | TCGA-AA-3846-01 | Colorectum | colon adenocarcinoma | Female | >=65 | I/II | Unknown | Unknown | SD |
| APBB1 | SNV | Missense_Mutation | novel | c.2015N>A | p.Cys672Tyr | p.C672Y | O00213 | protein_coding | tolerated(0.07) | possibly_damaging(0.735) | TCGA-AA-3848-01 | Colorectum | colon adenocarcinoma | Female | >=65 | III/IV | Unknown | Unknown | PD |
| APBB1 | SNV | Missense_Mutation | rs367708086 | c.61G>A | p.Ala21Thr | p.A21T | O00213 | protein_coding | tolerated(0.23) | benign(0.059) | TCGA-AA-3947-01 | Colorectum | colon adenocarcinoma | Female | <65 | I/II | Unknown | Unknown | SD |
| APBB1 | SNV | Missense_Mutation | novel | c.1841N>C | p.Val614Ala | p.V614A | O00213 | protein_coding | deleterious(0) | probably_damaging(0.991) | TCGA-AD-6895-01 | Colorectum | colon adenocarcinoma | Male | >=65 | III/IV | Unknown | Unknown | SD |
| APBB1 | SNV | Missense_Mutation | novel | c.1958C>T | p.Ala653Val | p.A653V | O00213 | protein_coding | deleterious(0) | probably_damaging(0.998) | TCGA-AZ-4315-01 | Colorectum | colon adenocarcinoma | Male | <65 | I/II | Unknown | Unknown | SD |
| APBB1 | SNV | Missense_Mutation | c.1840G>A | p.Val614Met | p.V614M | O00213 | protein_coding | deleterious(0) | probably_damaging(0.996) | TCGA-AZ-4615-01 | Colorectum | colon adenocarcinoma | Male | >=65 | III/IV | Chemotherapy | xeloda | PD | |
| APBB1 | SNV | Missense_Mutation | rs368805217 | c.1117N>T | p.Arg373Cys | p.R373C | O00213 | protein_coding | deleterious(0.02) | probably_damaging(0.992) | TCGA-AZ-6601-01 | Colorectum | colon adenocarcinoma | Male | >=65 | I/II | Unknown | Unknown | PD |
| APBB1 | SNV | Missense_Mutation | novel | c.1596N>A | p.Phe532Leu | p.F532L | O00213 | protein_coding | deleterious(0) | benign(0.219) | TCGA-CA-6717-01 | Colorectum | colon adenocarcinoma | Male | <65 | I/II | Chemotherapy | oxaliplatin | CR |
| Page: 1 2 3 4 5 6 7 8 9 10 |
Top |
Related drugs of malignant transformation related genes |
| Identification of chemicals and drugs interact with genes involved in malignant transfromation |
| (DGIdb 4.0) |
| Entrez ID | Symbol | Category | Interaction Types | Drug Claim Name | Drug Name | PMIDs |
| 322 | APBB1 | ENZYME, TRANSCRIPTION FACTOR, TRANSCRIPTION FACTOR BINDING | Trimidox | TRIMETHOPRIM/SULFADOXINE | ||
| 322 | APBB1 | ENZYME, TRANSCRIPTION FACTOR, TRANSCRIPTION FACTOR BINDING | G-207 virus construct | |||
| 322 | APBB1 | ENZYME, TRANSCRIPTION FACTOR, TRANSCRIPTION FACTOR BINDING | Clofarabine | CLOFARABINE | ||
| 322 | APBB1 | ENZYME, TRANSCRIPTION FACTOR, TRANSCRIPTION FACTOR BINDING | COH29 | COH-29 |
| Page: 1 |

Copyright 2023-Present -The University of Texas Health Science Center at Houston |