
|
|||||
|
 | |
| |
| |
| |
| |
| |
|
Gene: CDH2 |
Gene summary for CDH2 |
| Gene information | Species | Human | Gene symbol | CDH2 | Gene ID | 1000 |
| Gene name | cadherin 2 | |
| Gene Alias | ACOGS | |
| Cytomap | 18q12.1 | |
| Gene Type | protein-coding | GO ID | GO:0000165 | UniProtAcc | P19022 |
Top |
Malignant transformation analysis |
| Identification of the aberrant gene expression in precancerous and cancerous lesions by comparing the gene expression of stem-like cells in diseased tissues with normal stem cells |
| Entrez ID | Symbol | Replicates | Species | Organ | Tissue | Adj P-value | Log2FC | Malignancy |
| 1000 | CDH2 | P10T-E | Human | Esophagus | ESCC | 1.13e-16 | 3.21e-01 | 0.116 |
| 1000 | CDH2 | P11T-E | Human | Esophagus | ESCC | 2.06e-07 | 4.78e-01 | 0.1426 |
| 1000 | CDH2 | P19T-E | Human | Esophagus | ESCC | 2.95e-08 | 6.23e-01 | 0.1662 |
| 1000 | CDH2 | P24T-E | Human | Esophagus | ESCC | 1.88e-04 | 3.06e-01 | 0.1287 |
| 1000 | CDH2 | P32T-E | Human | Esophagus | ESCC | 2.41e-29 | 5.86e-01 | 0.1666 |
| 1000 | CDH2 | P37T-E | Human | Esophagus | ESCC | 2.88e-04 | 1.59e-01 | 0.1371 |
| 1000 | CDH2 | P61T-E | Human | Esophagus | ESCC | 1.19e-12 | 4.20e-01 | 0.099 |
| 1000 | CDH2 | P76T-E | Human | Esophagus | ESCC | 1.66e-02 | 1.43e-01 | 0.1207 |
| 1000 | CDH2 | P107T-E | Human | Esophagus | ESCC | 2.29e-02 | 1.58e-01 | 0.171 |
| 1000 | CDH2 | NAFLD1 | Human | Liver | NAFLD | 6.04e-06 | 6.20e-01 | -0.04 |
| 1000 | CDH2 | S41 | Human | Liver | Cirrhotic | 2.25e-02 | 6.33e-01 | -0.0343 |
| 1000 | CDH2 | S43 | Human | Liver | Cirrhotic | 3.41e-19 | -2.03e-02 | -0.0187 |
| 1000 | CDH2 | HCC1_Meng | Human | Liver | HCC | 4.65e-83 | 5.94e-02 | 0.0246 |
| 1000 | CDH2 | HCC2_Meng | Human | Liver | HCC | 2.37e-21 | -4.21e-01 | 0.0107 |
| 1000 | CDH2 | cirrhotic1 | Human | Liver | Cirrhotic | 2.96e-04 | -1.45e-01 | 0.0202 |
| 1000 | CDH2 | cirrhotic2 | Human | Liver | Cirrhotic | 3.59e-09 | 1.91e-01 | 0.0201 |
| 1000 | CDH2 | cirrhotic3 | Human | Liver | Cirrhotic | 3.23e-06 | -1.61e-01 | 0.0215 |
| 1000 | CDH2 | HCC1 | Human | Liver | HCC | 4.03e-07 | 3.95e+00 | 0.5336 |
| 1000 | CDH2 | HCC2 | Human | Liver | HCC | 9.19e-11 | 4.04e+00 | 0.5341 |
| 1000 | CDH2 | HCC5 | Human | Liver | HCC | 9.05e-07 | 5.63e-01 | 0.4932 |
| Page: 1 2 |
| Tissue | Expression Dynamics | Abbreviation |
| Esophagus |  | ESCC: Esophageal squamous cell carcinoma |
| HGIN: High-grade intraepithelial neoplasias | ||
| LGIN: Low-grade intraepithelial neoplasias | ||
| Liver | 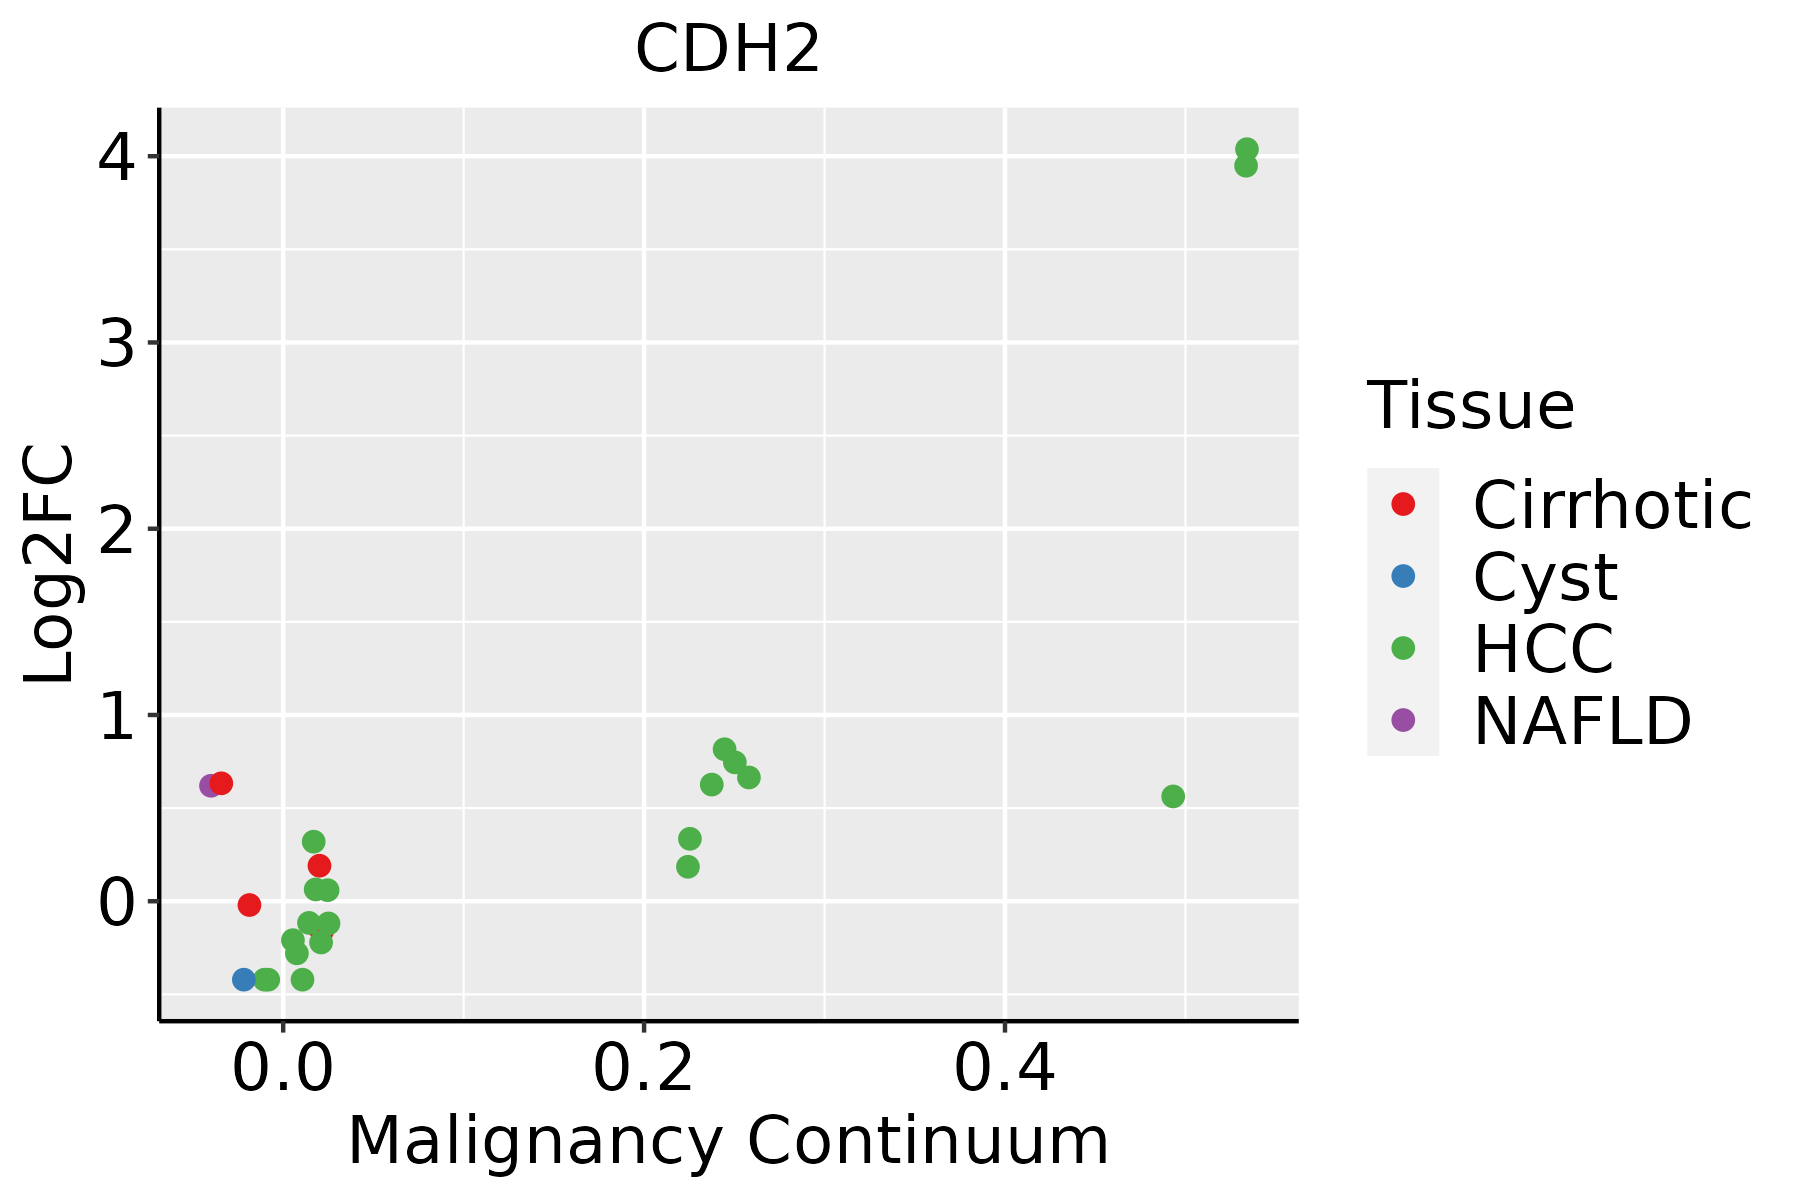 | HCC: Hepatocellular carcinoma |
| NAFLD: Non-alcoholic fatty liver disease | ||
| Thyroid | 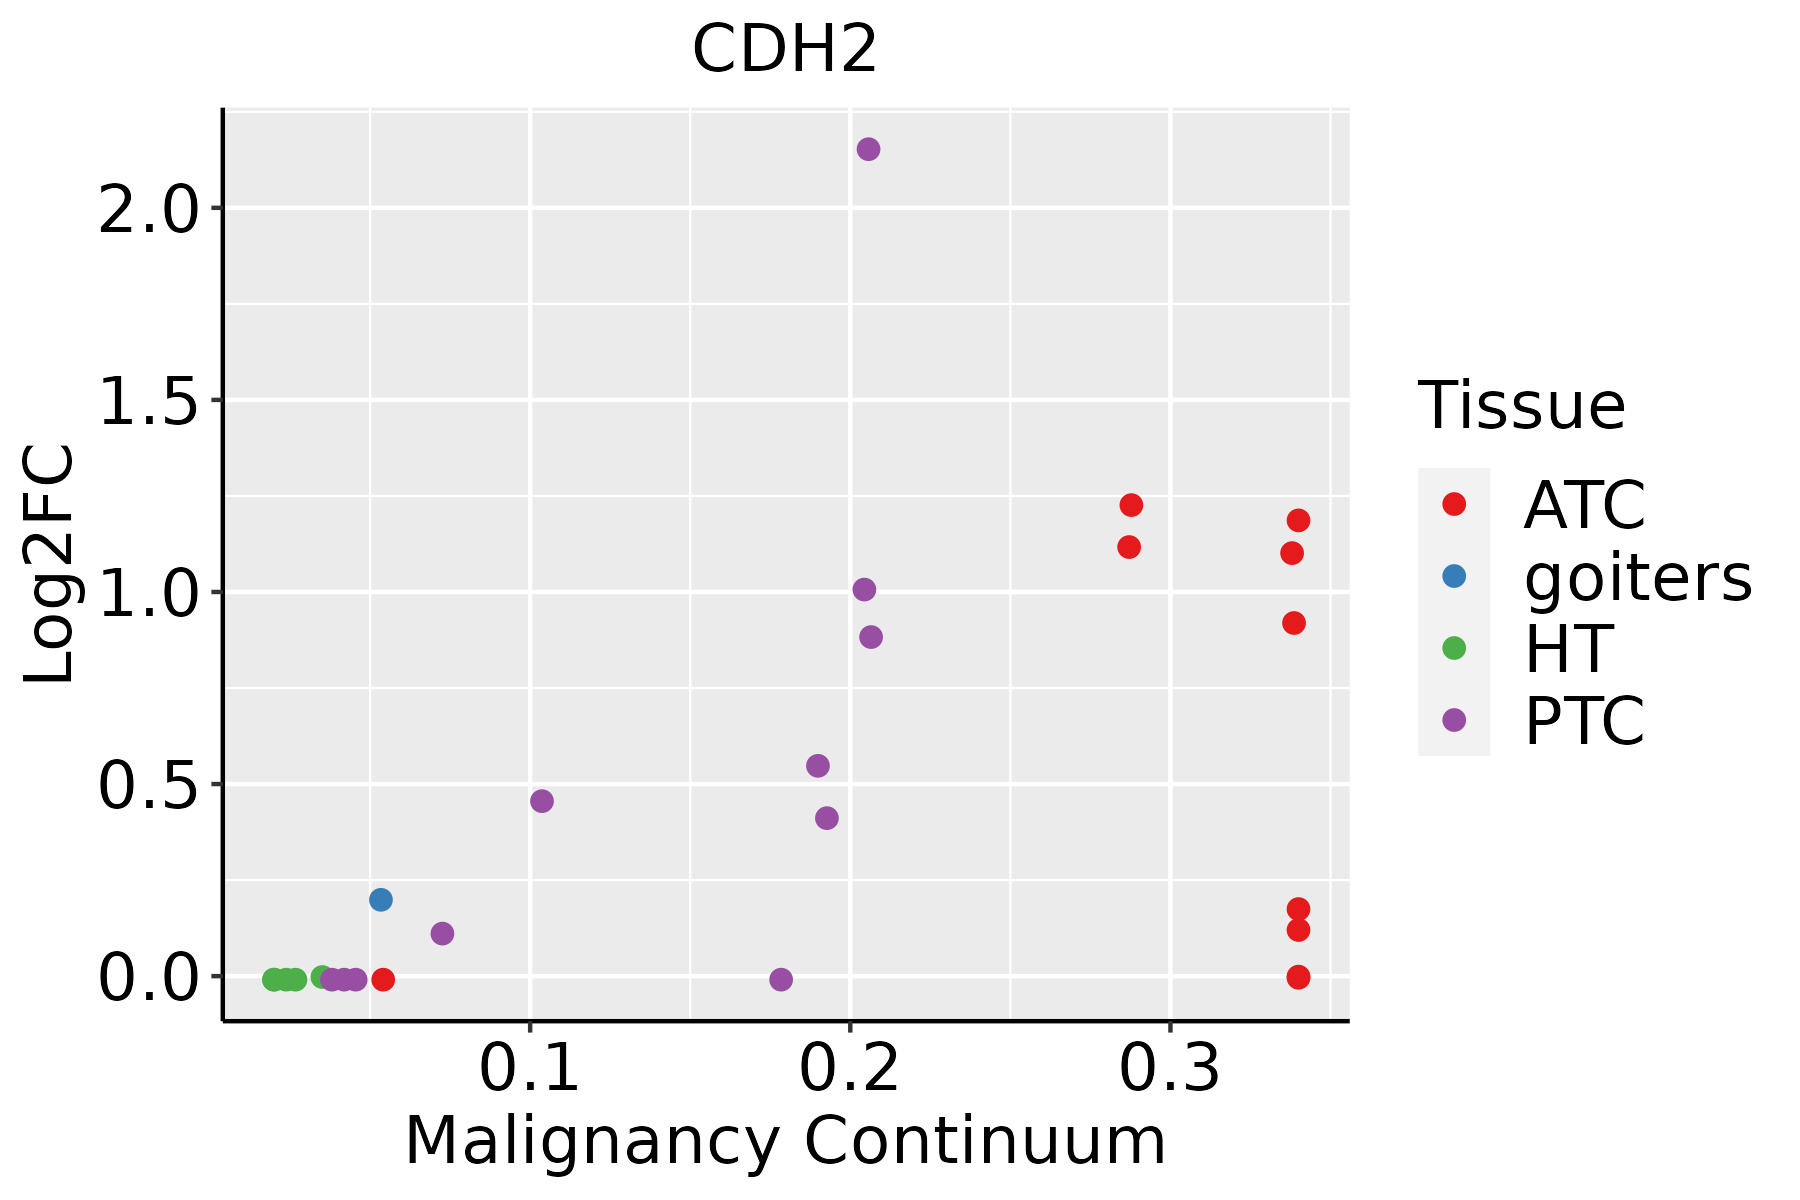 | ATC: Anaplastic thyroid cancer |
| HT: Hashimoto's thyroiditis | ||
| PTC: Papillary thyroid cancer |
| ∗log2FC in expression of this searched gene in stem-like cells from each diseased tissue sample relative to stem-like cells in normal samples in each tissue plotted against the malignancy continuum. Samples are colored based on if they are from different disease stage. |
Top |
Malignant transformation related pathway analysis |
| Find out the enriched GO biological processes and KEGG pathways involved in transition from healthy to precancer to cancer |
| Tissue | Disease Stage | Enriched GO biological Processes |
| Colorectum | AD |  |
| Colorectum | SER |  |
| Colorectum | MSS |  |
| Colorectum | MSI-H |  |
| Colorectum | FAP |  |
| ∗Top 15 enriched GO BP terms are showed in the bar plot of each disease state in each tissue. Each row represents a significant GO biological process which is colored according to the -log10(p.adjust). |
| Page: 1 2 3 4 5 6 7 8 9 |
| GO ID | Tissue | Disease Stage | Description | Gene Ratio | Bg Ratio | pvalue | p.adjust | Count |
| GO:0072659110 | Esophagus | ESCC | protein localization to plasma membrane | 193/8552 | 284/18723 | 1.95e-14 | 1.03e-12 | 193 |
| GO:199077819 | Esophagus | ESCC | protein localization to cell periphery | 217/8552 | 333/18723 | 4.08e-13 | 1.88e-11 | 217 |
| GO:001605517 | Esophagus | ESCC | Wnt signaling pathway | 268/8552 | 444/18723 | 2.32e-10 | 6.58e-09 | 268 |
| GO:019873817 | Esophagus | ESCC | cell-cell signaling by wnt | 269/8552 | 446/18723 | 2.41e-10 | 6.79e-09 | 269 |
| GO:005164815 | Esophagus | ESCC | vesicle localization | 119/8552 | 177/18723 | 5.16e-09 | 1.08e-07 | 119 |
| GO:190547519 | Esophagus | ESCC | regulation of protein localization to membrane | 117/8552 | 175/18723 | 1.14e-08 | 2.26e-07 | 117 |
| GO:009872714 | Esophagus | ESCC | maintenance of cell number | 90/8552 | 134/18723 | 3.94e-07 | 5.43e-06 | 90 |
| GO:001982714 | Esophagus | ESCC | stem cell population maintenance | 88/8552 | 131/18723 | 5.23e-07 | 6.97e-06 | 88 |
| GO:003011117 | Esophagus | ESCC | regulation of Wnt signaling pathway | 194/8552 | 328/18723 | 5.39e-07 | 7.14e-06 | 194 |
| GO:006007016 | Esophagus | ESCC | canonical Wnt signaling pathway | 180/8552 | 303/18723 | 9.15e-07 | 1.17e-05 | 180 |
| GO:000206420 | Esophagus | ESCC | epithelial cell development | 136/8552 | 220/18723 | 9.50e-07 | 1.21e-05 | 136 |
| GO:006082817 | Esophagus | ESCC | regulation of canonical Wnt signaling pathway | 153/8552 | 253/18723 | 1.38e-06 | 1.67e-05 | 153 |
| GO:0048872111 | Esophagus | ESCC | homeostasis of number of cells | 163/8552 | 272/18723 | 1.40e-06 | 1.69e-05 | 163 |
| GO:00420636 | Esophagus | ESCC | gliogenesis | 172/8552 | 301/18723 | 3.75e-05 | 3.04e-04 | 172 |
| GO:00488638 | Esophagus | ESCC | stem cell differentiation | 122/8552 | 206/18723 | 5.95e-05 | 4.59e-04 | 122 |
| GO:006156415 | Esophagus | ESCC | axon development | 251/8552 | 467/18723 | 2.41e-04 | 1.49e-03 | 251 |
| GO:001097516 | Esophagus | ESCC | regulation of neuron projection development | 240/8552 | 445/18723 | 2.48e-04 | 1.53e-03 | 240 |
| GO:00100016 | Esophagus | ESCC | glial cell differentiation | 129/8552 | 225/18723 | 2.73e-04 | 1.65e-03 | 129 |
| GO:003432918 | Esophagus | ESCC | cell junction assembly | 227/8552 | 420/18723 | 3.06e-04 | 1.83e-03 | 227 |
| GO:000961216 | Esophagus | ESCC | response to mechanical stimulus | 124/8552 | 216/18723 | 3.30e-04 | 1.94e-03 | 124 |
| Page: 1 2 3 4 5 6 7 8 9 |
| Pathway ID | Tissue | Disease Stage | Description | Gene Ratio | Bg Ratio | pvalue | p.adjust | qvalue | Count |
| Page: 1 |
Top |
Cell-cell communication analysis |
| Identification of potential cell-cell interactions between two cell types and their ligand-receptor pairs for different disease states |
| Ligand | Receptor | LRpair | Pathway | Tissue | Disease Stage |
| CDH2 | CDH2 | CDH2_CDH2 | CDH | CRC | FAP |
| CDH2 | CDH2 | CDH2_CDH2 | CDH | Endometrium | ADJ |
| CDH2 | CDH2 | CDH2_CDH2 | CDH | GC | ADJ |
| CDH2 | CDH2 | CDH2_CDH2 | CDH | Liver | HCC |
| CDH2 | CDH2 | CDH2_CDH2 | CDH | Liver | Healthy |
| CDH2 | CDH2 | CDH2_CDH2 | CDH | Liver | Precancer |
| CDH2 | CDH2 | CDH2_CDH2 | CDH | THCA | PTC |
| Page: 1 |
Top |
Single-cell gene regulatory network inference analysis |
| Find out the significant the regulons (TFs) and the target genes of each regulon across cell types for different disease states |
| TF | Cell Type | Tissue | Disease Stage | Target Gene | RSS | Regulon Activity |
| ∗The dot plots of a searched regulon are shown for all cell subpopulations in each disease state of each tissue based on the regulon specific score inferred using pySCENIC and by calculating the average expression. |
| Page: 1 |
Top |
Somatic mutation of malignant transformation related genes |
| Annotation of somatic variants for genes involved in malignant transformation |
| Hugo Symbol | Variant Class | Variant Classification | dbSNP RS | HGVSc | HGVSp | HGVSp Short | SWISSPROT | BIOTYPE | SIFT | PolyPhen | Tumor Sample Barcode | Tissue | Histology | Sex | Age | Stage | Therapy Types | Drugs | Outcome |
| CDH2 | SNV | Missense_Mutation | novel | c.2405N>C | p.Lys802Thr | p.K802T | P19022 | protein_coding | deleterious(0) | probably_damaging(0.935) | TCGA-VQ-AA68-01 | Stomach | stomach adenocarcinoma | Female | <65 | III/IV | Chemotherapy | fluorouracil | CR |
| CDH2 | SNV | Missense_Mutation | novel | c.1747N>T | p.Pro583Ser | p.P583S | P19022 | protein_coding | deleterious(0.01) | probably_damaging(0.94) | TCGA-VQ-AA6G-01 | Stomach | stomach adenocarcinoma | Male | >=65 | I/II | Chemotherapy | fluorouracil | PD |
| CDH2 | insertion | Frame_Shift_Ins | novel | c.1499_1500insA | p.Asn500LysfsTer3 | p.N500Kfs*3 | P19022 | protein_coding | TCGA-HU-A4GT-01 | Stomach | stomach adenocarcinoma | Female | >=65 | I/II | Chemotherapy | copolang | SD |
| Page: 1 2 3 4 5 6 7 8 9 10 11 12 13 14 15 16 17 18 19 |
Top |
Related drugs of malignant transformation related genes |
| Identification of chemicals and drugs interact with genes involved in malignant transfromation |
| (DGIdb 4.0) |
| Entrez ID | Symbol | Category | Interaction Types | Drug Claim Name | Drug Name | PMIDs |
| 1000 | CDH2 | CELL SURFACE, DRUGGABLE GENOME | ADH-1 | ADH-1 | ||
| 1000 | CDH2 | CELL SURFACE, DRUGGABLE GENOME | Exherin | |||
| 1000 | CDH2 | CELL SURFACE, DRUGGABLE GENOME | methadone | METHADONE |
| Page: 1 |

Copyright 2023-Present -The University of Texas Health Science Center at Houston |