
|
|||||
|
 | |
| |
| |
| |
| |
| |
|
Gene: NCAPD3 |
Gene summary for NCAPD3 |
| Gene information | Species | Human | Gene symbol | NCAPD3 | Gene ID | 23310 |
| Gene name | non-SMC condensin II complex subunit D3 | |
| Gene Alias | CAP-D3 | |
| Cytomap | 11q25 | |
| Gene Type | protein-coding | GO ID | GO:0000003 | UniProtAcc | P42695 |
Top |
Malignant transformation analysis |
| Identification of the aberrant gene expression in precancerous and cancerous lesions by comparing the gene expression of stem-like cells in diseased tissues with normal stem cells |
| Entrez ID | Symbol | Replicates | Species | Organ | Tissue | Adj P-value | Log2FC | Malignancy |
| 23310 | NCAPD3 | LZE7T | Human | Esophagus | ESCC | 2.89e-04 | 3.01e-01 | 0.0667 |
| 23310 | NCAPD3 | LZE20T | Human | Esophagus | ESCC | 1.84e-02 | 1.02e-01 | 0.0662 |
| 23310 | NCAPD3 | LZE24T | Human | Esophagus | ESCC | 1.11e-06 | 1.82e-01 | 0.0596 |
| 23310 | NCAPD3 | P1T-E | Human | Esophagus | ESCC | 1.04e-02 | 2.05e-01 | 0.0875 |
| 23310 | NCAPD3 | P2T-E | Human | Esophagus | ESCC | 9.52e-09 | 1.83e-01 | 0.1177 |
| 23310 | NCAPD3 | P4T-E | Human | Esophagus | ESCC | 2.78e-23 | 6.60e-01 | 0.1323 |
| 23310 | NCAPD3 | P5T-E | Human | Esophagus | ESCC | 1.56e-05 | 1.58e-01 | 0.1327 |
| 23310 | NCAPD3 | P8T-E | Human | Esophagus | ESCC | 1.51e-11 | 2.28e-01 | 0.0889 |
| 23310 | NCAPD3 | P9T-E | Human | Esophagus | ESCC | 1.07e-04 | 1.72e-01 | 0.1131 |
| 23310 | NCAPD3 | P10T-E | Human | Esophagus | ESCC | 3.33e-17 | 3.71e-01 | 0.116 |
| 23310 | NCAPD3 | P12T-E | Human | Esophagus | ESCC | 1.29e-16 | 2.30e-01 | 0.1122 |
| 23310 | NCAPD3 | P15T-E | Human | Esophagus | ESCC | 2.97e-06 | 1.69e-01 | 0.1149 |
| 23310 | NCAPD3 | P16T-E | Human | Esophagus | ESCC | 2.42e-11 | 2.36e-01 | 0.1153 |
| 23310 | NCAPD3 | P19T-E | Human | Esophagus | ESCC | 5.24e-04 | 2.97e-01 | 0.1662 |
| 23310 | NCAPD3 | P20T-E | Human | Esophagus | ESCC | 1.17e-05 | 9.10e-02 | 0.1124 |
| 23310 | NCAPD3 | P21T-E | Human | Esophagus | ESCC | 7.55e-14 | 3.58e-01 | 0.1617 |
| 23310 | NCAPD3 | P22T-E | Human | Esophagus | ESCC | 6.61e-08 | 1.52e-01 | 0.1236 |
| 23310 | NCAPD3 | P23T-E | Human | Esophagus | ESCC | 5.95e-05 | 1.39e-01 | 0.108 |
| 23310 | NCAPD3 | P24T-E | Human | Esophagus | ESCC | 3.36e-04 | 1.32e-01 | 0.1287 |
| 23310 | NCAPD3 | P26T-E | Human | Esophagus | ESCC | 1.69e-09 | 2.27e-01 | 0.1276 |
| Page: 1 2 3 4 |
| Tissue | Expression Dynamics | Abbreviation |
| Esophagus | 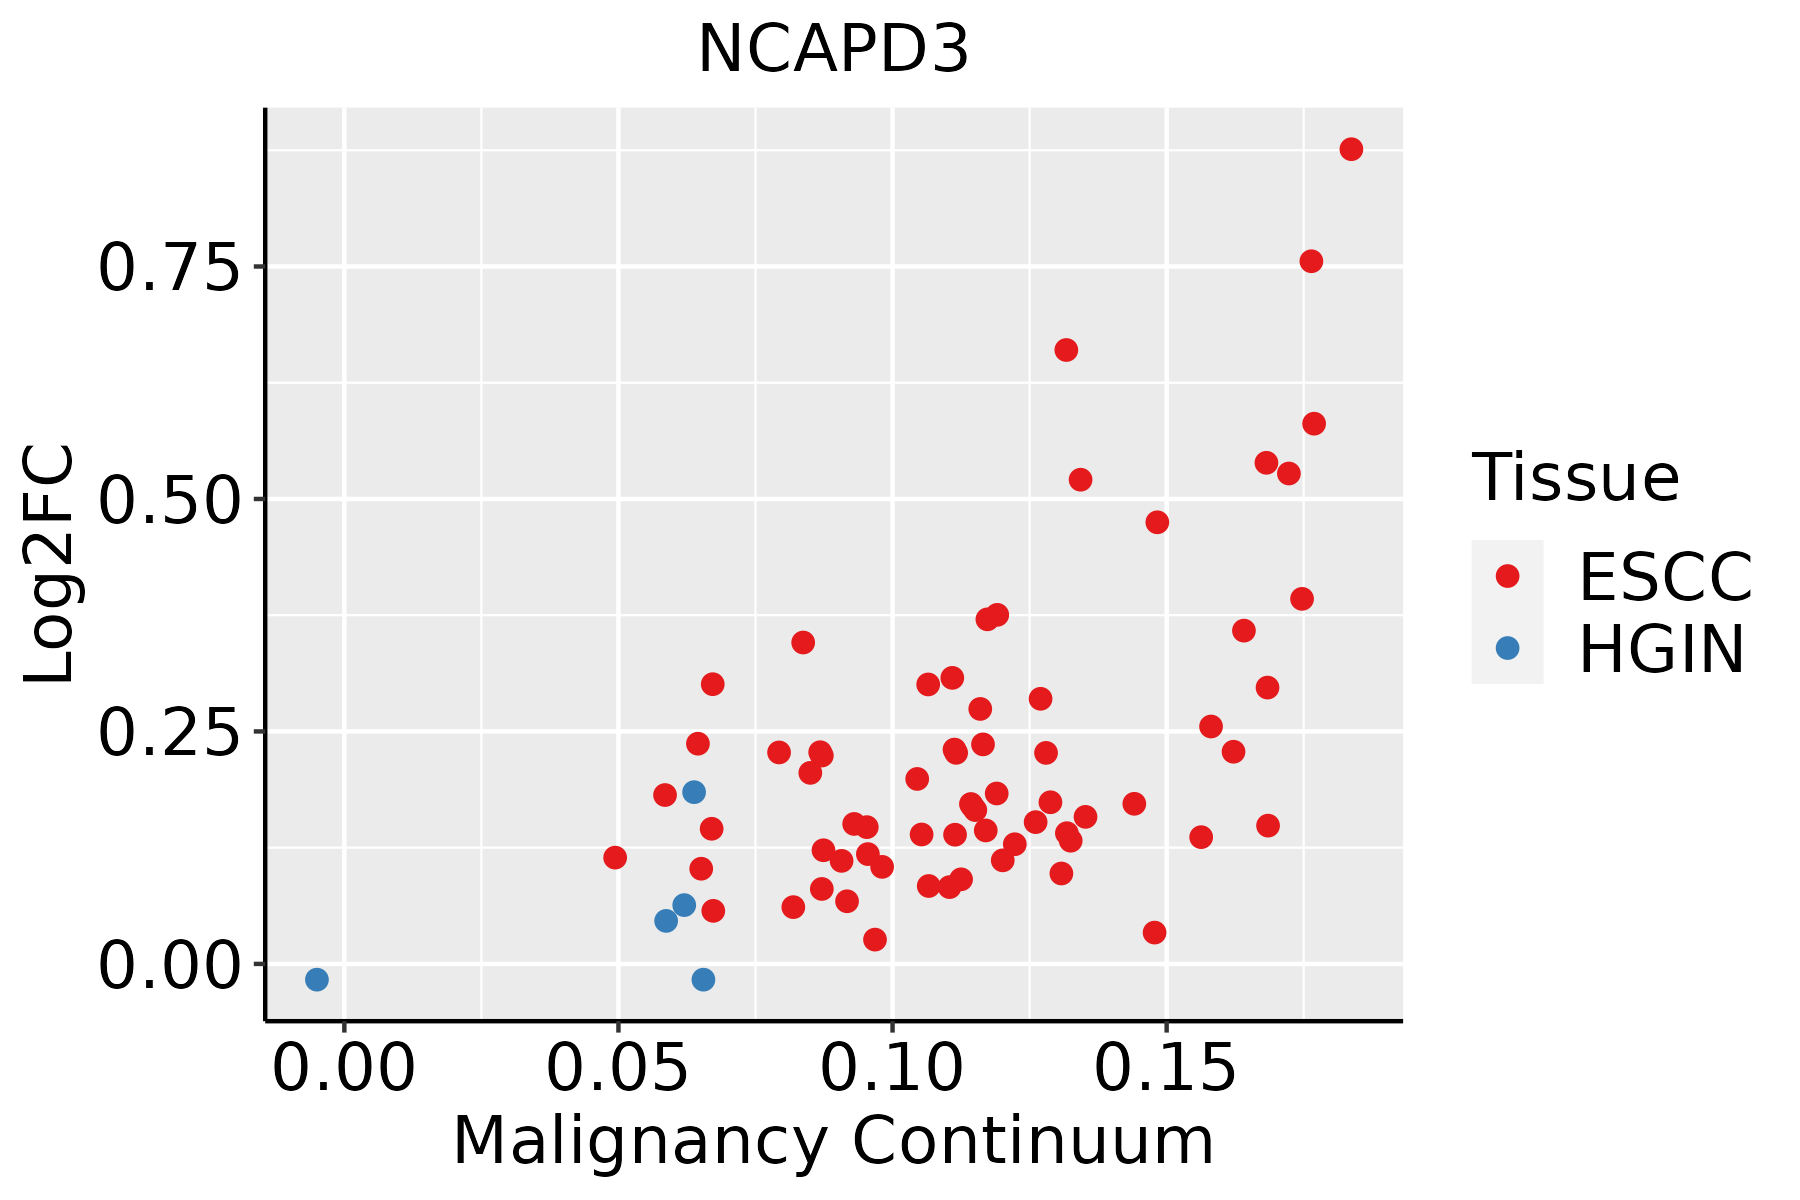 | ESCC: Esophageal squamous cell carcinoma |
| HGIN: High-grade intraepithelial neoplasias | ||
| LGIN: Low-grade intraepithelial neoplasias | ||
| Oral Cavity | 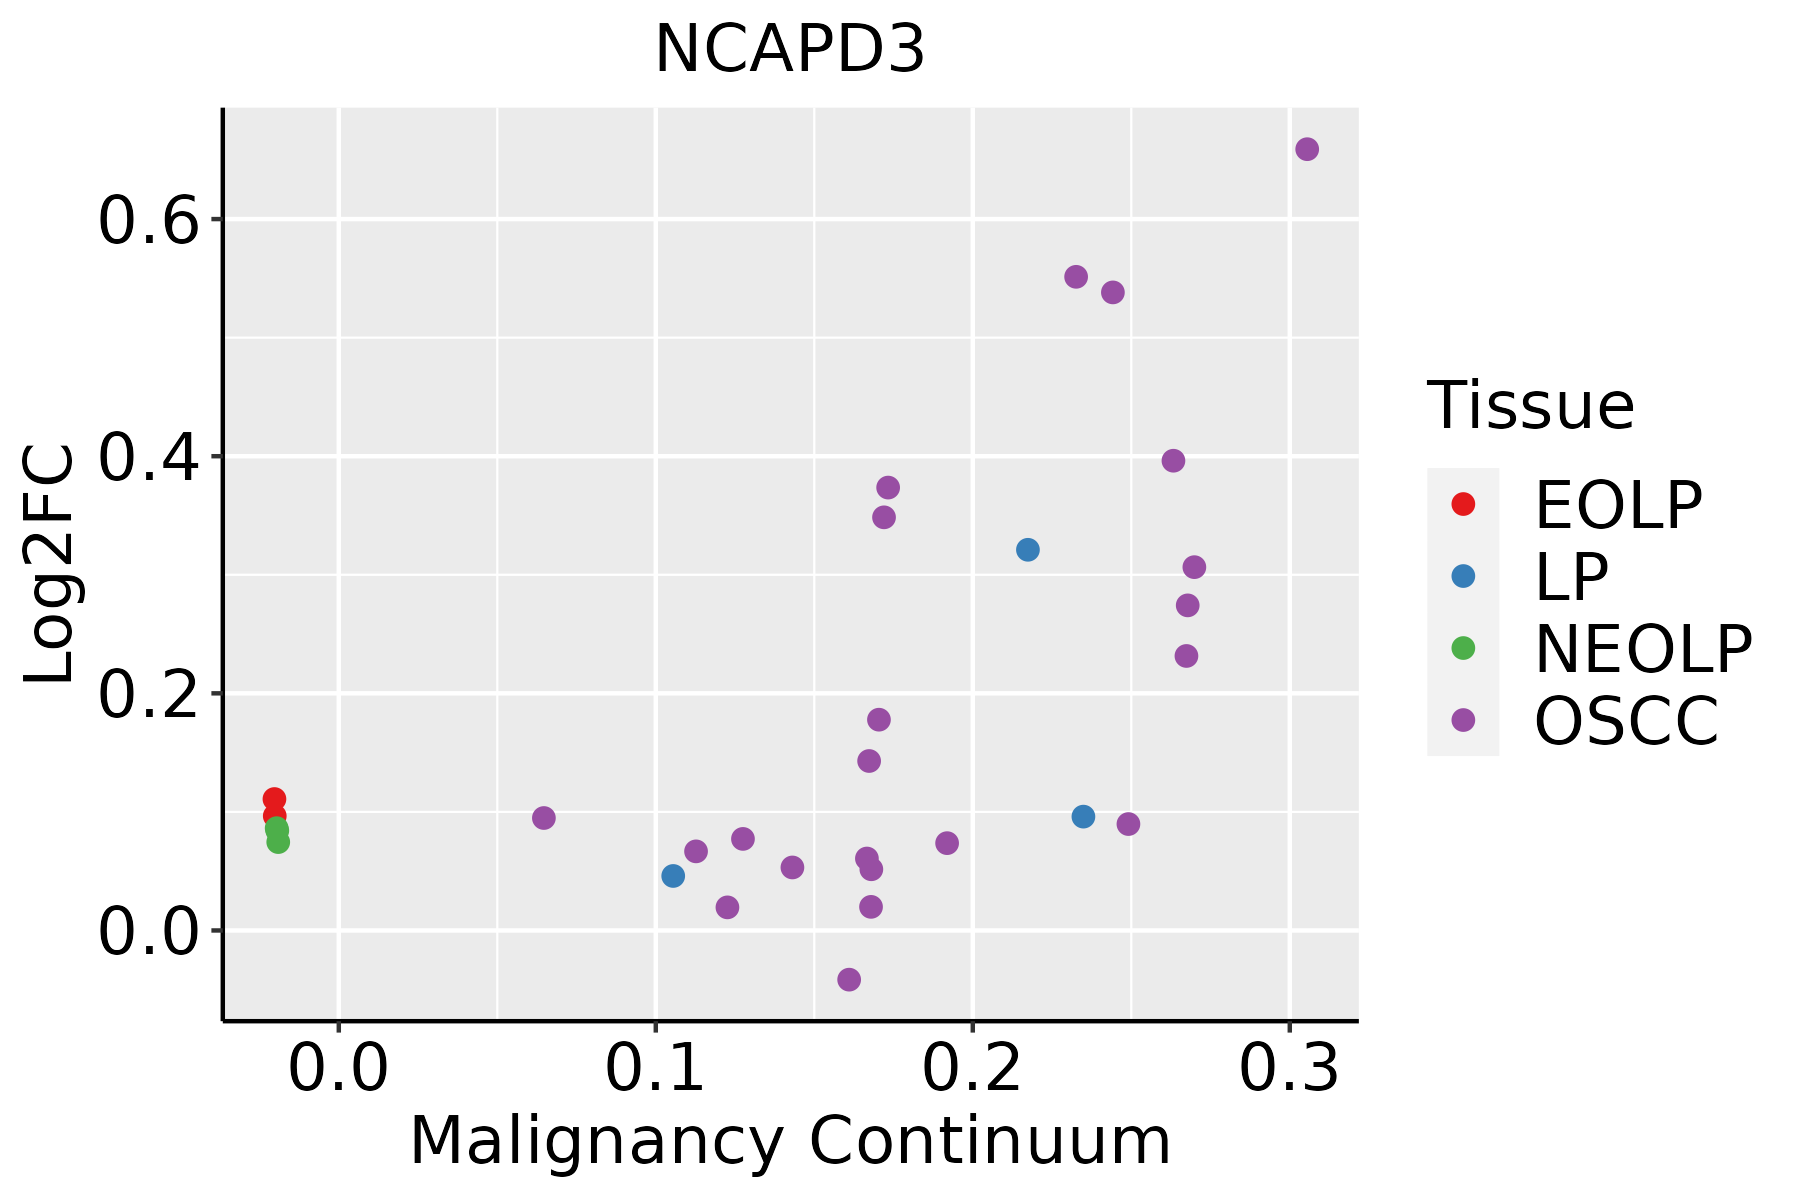 | EOLP: Erosive Oral lichen planus |
| LP: leukoplakia | ||
| NEOLP: Non-erosive oral lichen planus | ||
| OSCC: Oral squamous cell carcinoma | ||
| Prostate | 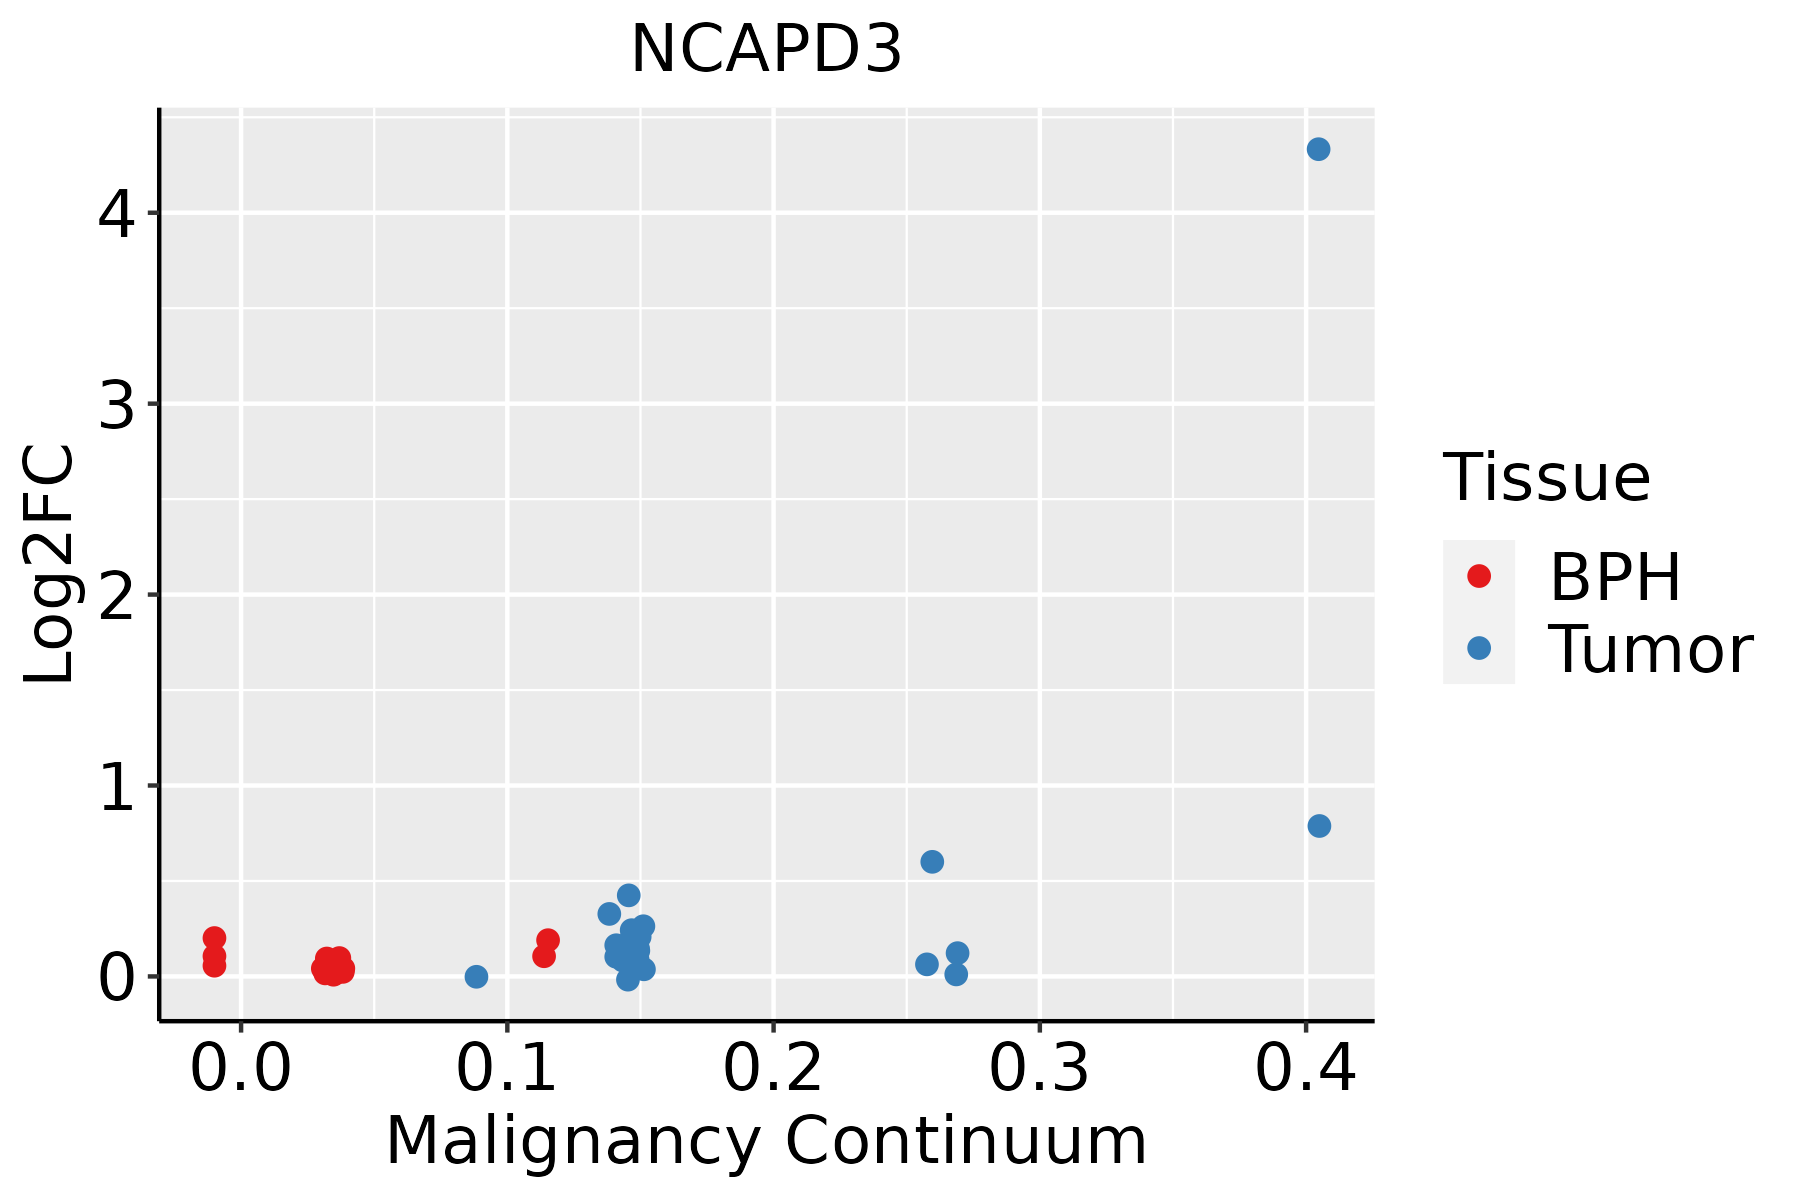 | BPH: Benign Prostatic Hyperplasia |
| Thyroid |  | ATC: Anaplastic thyroid cancer |
| HT: Hashimoto's thyroiditis | ||
| PTC: Papillary thyroid cancer |
| ∗log2FC in expression of this searched gene in stem-like cells from each diseased tissue sample relative to stem-like cells in normal samples in each tissue plotted against the malignancy continuum. Samples are colored based on if they are from different disease stage. |
Top |
Malignant transformation related pathway analysis |
| Find out the enriched GO biological processes and KEGG pathways involved in transition from healthy to precancer to cancer |
| Tissue | Disease Stage | Enriched GO biological Processes |
| Colorectum | AD |  |
| Colorectum | SER |  |
| Colorectum | MSS |  |
| Colorectum | MSI-H |  |
| Colorectum | FAP |  |
| ∗Top 15 enriched GO BP terms are showed in the bar plot of each disease state in each tissue. Each row represents a significant GO biological process which is colored according to the -log10(p.adjust). |
| Page: 1 2 3 4 5 6 7 8 9 |
| GO ID | Tissue | Disease Stage | Description | Gene Ratio | Bg Ratio | pvalue | p.adjust | Count |
| GO:014001414 | Esophagus | ESCC | mitotic nuclear division | 218/8552 | 287/18723 | 6.17e-26 | 1.78e-23 | 218 |
| GO:000007011 | Esophagus | ESCC | mitotic sister chromatid segregation | 138/8552 | 168/18723 | 1.37e-22 | 2.63e-20 | 138 |
| GO:00008194 | Esophagus | ESCC | sister chromatid segregation | 157/8552 | 202/18723 | 8.41e-21 | 1.33e-18 | 157 |
| GO:000705911 | Esophagus | ESCC | chromosome segregation | 238/8552 | 346/18723 | 1.72e-18 | 1.82e-16 | 238 |
| GO:00482853 | Esophagus | ESCC | organelle fission | 301/8552 | 488/18723 | 4.64e-13 | 2.12e-11 | 301 |
| GO:00988133 | Esophagus | ESCC | nuclear chromosome segregation | 187/8552 | 281/18723 | 1.00e-12 | 4.36e-11 | 187 |
| GO:00002802 | Esophagus | ESCC | nuclear division | 270/8552 | 439/18723 | 1.17e-11 | 4.24e-10 | 270 |
| GO:00070761 | Esophagus | ESCC | mitotic chromosome condensation | 15/8552 | 17/18723 | 3.48e-04 | 2.03e-03 | 15 |
| GO:01400145 | Oral cavity | OSCC | mitotic nuclear division | 191/7305 | 287/18723 | 1.99e-21 | 3.70e-19 | 191 |
| GO:00000702 | Oral cavity | OSCC | mitotic sister chromatid segregation | 118/7305 | 168/18723 | 1.89e-16 | 1.48e-14 | 118 |
| GO:00008193 | Oral cavity | OSCC | sister chromatid segregation | 135/7305 | 202/18723 | 8.88e-16 | 6.52e-14 | 135 |
| GO:00070592 | Oral cavity | OSCC | chromosome segregation | 206/7305 | 346/18723 | 5.82e-15 | 3.76e-13 | 206 |
| GO:00482852 | Oral cavity | OSCC | organelle fission | 265/7305 | 488/18723 | 3.22e-12 | 1.27e-10 | 265 |
| GO:00002801 | Oral cavity | OSCC | nuclear division | 237/7305 | 439/18723 | 9.62e-11 | 2.90e-09 | 237 |
| GO:00988132 | Oral cavity | OSCC | nuclear chromosome segregation | 162/7305 | 281/18723 | 1.56e-10 | 4.56e-09 | 162 |
| GO:0007076 | Oral cavity | OSCC | mitotic chromosome condensation | 13/7305 | 17/18723 | 1.92e-03 | 8.94e-03 | 13 |
| GO:01400144 | Prostate | BPH | mitotic nuclear division | 67/3107 | 287/18723 | 1.87e-03 | 1.07e-02 | 67 |
| GO:014001412 | Prostate | Tumor | mitotic nuclear division | 66/3246 | 287/18723 | 8.19e-03 | 3.60e-02 | 66 |
| GO:01400148 | Thyroid | PTC | mitotic nuclear division | 135/5968 | 287/18723 | 4.90e-08 | 1.04e-06 | 135 |
| GO:00000705 | Thyroid | PTC | mitotic sister chromatid segregation | 79/5968 | 168/18723 | 2.78e-05 | 2.71e-04 | 79 |
| Page: 1 2 |
| Pathway ID | Tissue | Disease Stage | Description | Gene Ratio | Bg Ratio | pvalue | p.adjust | qvalue | Count |
| Page: 1 |
Top |
Cell-cell communication analysis |
| Identification of potential cell-cell interactions between two cell types and their ligand-receptor pairs for different disease states |
| Ligand | Receptor | LRpair | Pathway | Tissue | Disease Stage |
| Page: 1 |
Top |
Single-cell gene regulatory network inference analysis |
| Find out the significant the regulons (TFs) and the target genes of each regulon across cell types for different disease states |
| TF | Cell Type | Tissue | Disease Stage | Target Gene | RSS | Regulon Activity |
| ∗The dot plots of a searched regulon are shown for all cell subpopulations in each disease state of each tissue based on the regulon specific score inferred using pySCENIC and by calculating the average expression. |
| Page: 1 |
Top |
Somatic mutation of malignant transformation related genes |
| Annotation of somatic variants for genes involved in malignant transformation |
| Hugo Symbol | Variant Class | Variant Classification | dbSNP RS | HGVSc | HGVSp | HGVSp Short | SWISSPROT | BIOTYPE | SIFT | PolyPhen | Tumor Sample Barcode | Tissue | Histology | Sex | Age | Stage | Therapy Types | Drugs | Outcome |
| NCAPD3 | insertion | In_Frame_Ins | novel | c.305_306insACAAGAAACAAA | p.Lys102_Lys103insGlnGluThrLys | p.K102_K103insQETK | P42695 | protein_coding | TCGA-EL-A3ZM-01 | Thyroid | thyroid carcinoma | Male | <65 | I/II | Unknown | Unknown | SD | ||
| NCAPD3 | insertion | In_Frame_Ins | novel | c.2572_2573insCCCATGTTTTTC | p.Phe858delinsSerHisValPheLeu | p.F858delinsSHVFL | P42695 | protein_coding | TCGA-FY-A4B0-01 | Thyroid | thyroid carcinoma | Male | >=65 | I/II | Hormone Therapy | synthroid | SD |
| Page: 1 2 3 4 5 6 7 8 9 10 11 12 13 14 15 16 17 18 |
Top |
Related drugs of malignant transformation related genes |
| Identification of chemicals and drugs interact with genes involved in malignant transfromation |
| (DGIdb 4.0) |
| Entrez ID | Symbol | Category | Interaction Types | Drug Claim Name | Drug Name | PMIDs |
| Page: 1 |

Copyright 2023-Present -The University of Texas Health Science Center at Houston |