
|
|||||
|
 | |
| |
| |
| |
| |
| |
|
Gene: DENND4C |
Gene summary for DENND4C |
| Gene information | Species | Human | Gene symbol | DENND4C | Gene ID | 55667 |
| Gene name | DENN domain containing 4C | |
| Gene Alias | C9orf55 | |
| Cytomap | 9p22.1 | |
| Gene Type | protein-coding | GO ID | GO:0006810 | UniProtAcc | Q5VZ89 |
Top |
Malignant transformation analysis |
| Identification of the aberrant gene expression in precancerous and cancerous lesions by comparing the gene expression of stem-like cells in diseased tissues with normal stem cells |
| Entrez ID | Symbol | Replicates | Species | Organ | Tissue | Adj P-value | Log2FC | Malignancy |
| 55667 | DENND4C | CCI_1 | Human | Cervix | CC | 9.71e-04 | 5.81e-01 | 0.528 |
| 55667 | DENND4C | CCI_2 | Human | Cervix | CC | 1.50e-08 | 1.13e+00 | 0.5249 |
| 55667 | DENND4C | CCI_3 | Human | Cervix | CC | 1.44e-08 | 7.96e-01 | 0.516 |
| 55667 | DENND4C | HTA11_347_2000001011 | Human | Colorectum | AD | 8.10e-11 | 5.74e-01 | -0.1954 |
| 55667 | DENND4C | HTA11_99999965104_69814 | Human | Colorectum | MSS | 1.14e-02 | 5.73e-01 | 0.281 |
| 55667 | DENND4C | HTA11_99999974143_84620 | Human | Colorectum | MSS | 1.47e-03 | -3.49e-01 | 0.3005 |
| 55667 | DENND4C | A002-C-010 | Human | Colorectum | FAP | 3.23e-02 | 4.66e-02 | 0.242 |
| 55667 | DENND4C | A001-C-207 | Human | Colorectum | FAP | 4.08e-03 | -1.46e-01 | 0.1278 |
| 55667 | DENND4C | A015-C-203 | Human | Colorectum | FAP | 1.33e-34 | -3.50e-01 | -0.1294 |
| 55667 | DENND4C | A015-C-204 | Human | Colorectum | FAP | 5.88e-07 | -3.27e-01 | -0.0228 |
| 55667 | DENND4C | A014-C-040 | Human | Colorectum | FAP | 3.24e-03 | -2.28e-01 | -0.1184 |
| 55667 | DENND4C | A002-C-201 | Human | Colorectum | FAP | 1.70e-13 | -2.98e-01 | 0.0324 |
| 55667 | DENND4C | A002-C-203 | Human | Colorectum | FAP | 1.29e-03 | -9.22e-02 | 0.2786 |
| 55667 | DENND4C | A001-C-119 | Human | Colorectum | FAP | 6.02e-06 | -2.52e-01 | -0.1557 |
| 55667 | DENND4C | A001-C-108 | Human | Colorectum | FAP | 4.40e-18 | -1.63e-01 | -0.0272 |
| 55667 | DENND4C | A002-C-205 | Human | Colorectum | FAP | 1.43e-23 | -4.11e-01 | -0.1236 |
| 55667 | DENND4C | A001-C-104 | Human | Colorectum | FAP | 3.70e-02 | -1.14e-01 | 0.0184 |
| 55667 | DENND4C | A015-C-005 | Human | Colorectum | FAP | 5.02e-03 | -2.85e-01 | -0.0336 |
| 55667 | DENND4C | A015-C-006 | Human | Colorectum | FAP | 3.11e-19 | -5.17e-01 | -0.0994 |
| 55667 | DENND4C | A015-C-106 | Human | Colorectum | FAP | 4.96e-12 | -1.61e-01 | -0.0511 |
| Page: 1 2 3 4 5 6 7 8 |
| Tissue | Expression Dynamics | Abbreviation |
| Cervix |  | CC: Cervix cancer |
| HSIL_HPV: HPV-infected high-grade squamous intraepithelial lesions | ||
| N_HPV: HPV-infected normal cervix | ||
| Colorectum (GSE201348) |  | FAP: Familial adenomatous polyposis |
| CRC: Colorectal cancer | ||
| Colorectum (HTA11) |  | AD: Adenomas |
| SER: Sessile serrated lesions | ||
| MSI-H: Microsatellite-high colorectal cancer | ||
| MSS: Microsatellite stable colorectal cancer | ||
| Esophagus |  | ESCC: Esophageal squamous cell carcinoma |
| HGIN: High-grade intraepithelial neoplasias | ||
| LGIN: Low-grade intraepithelial neoplasias | ||
| Liver | 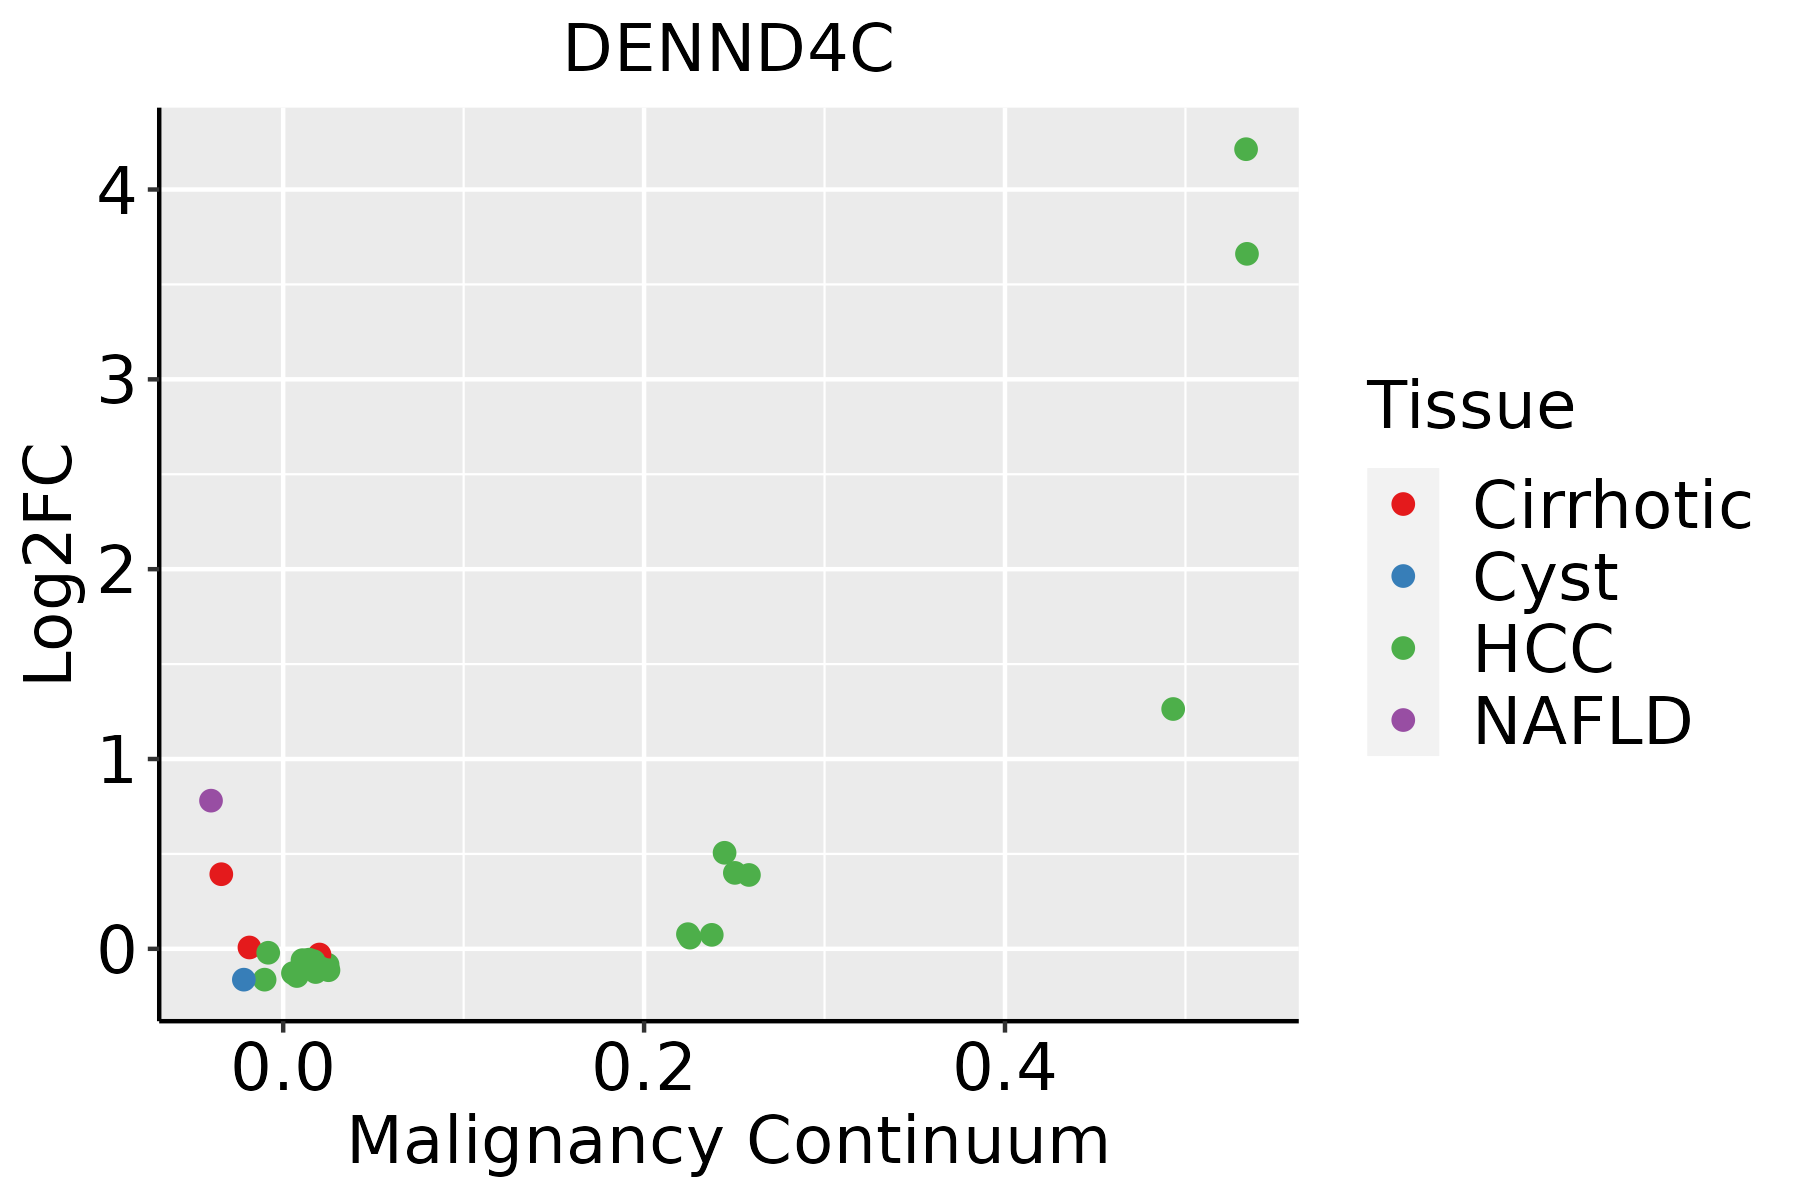 | HCC: Hepatocellular carcinoma |
| NAFLD: Non-alcoholic fatty liver disease | ||
| Lung | 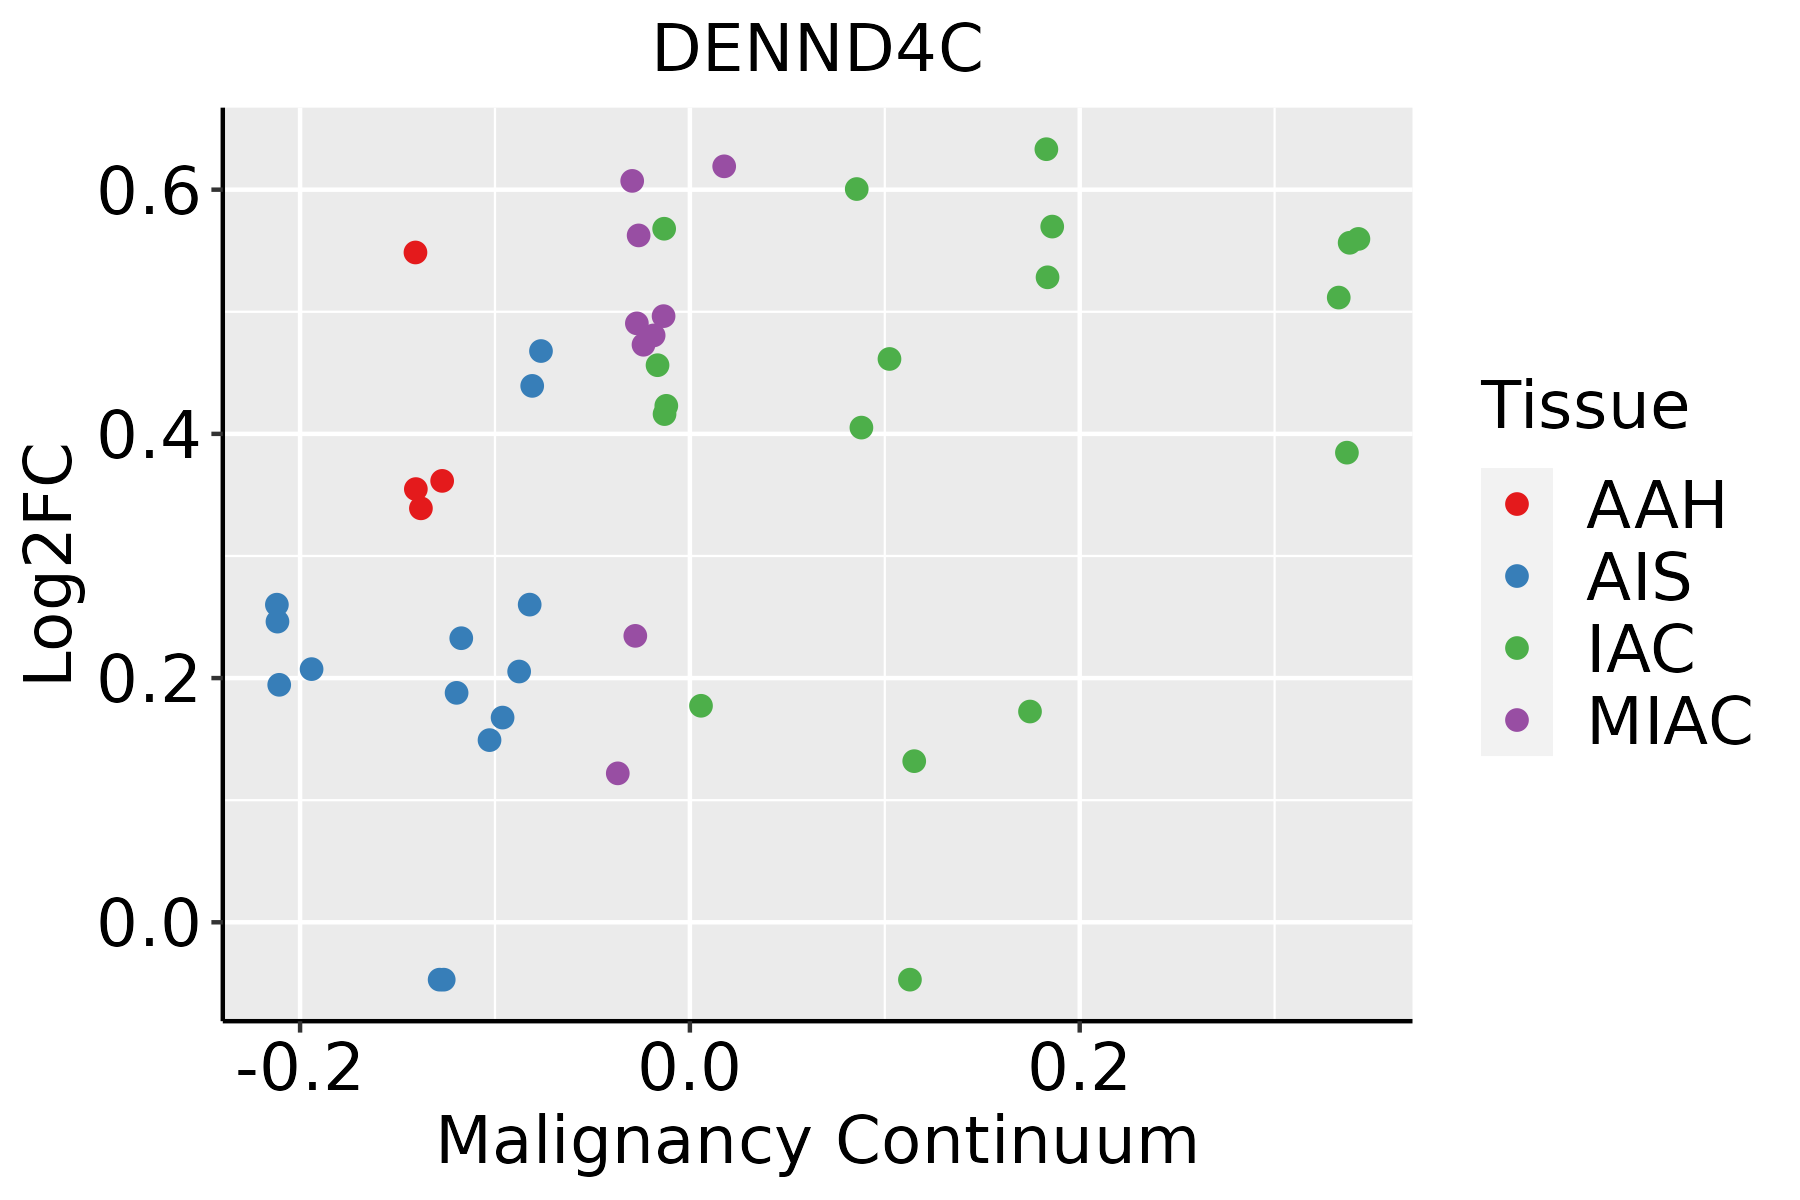 | AAH: Atypical adenomatous hyperplasia |
| AIS: Adenocarcinoma in situ | ||
| IAC: Invasive lung adenocarcinoma | ||
| MIA: Minimally invasive adenocarcinoma | ||
| Prostate | 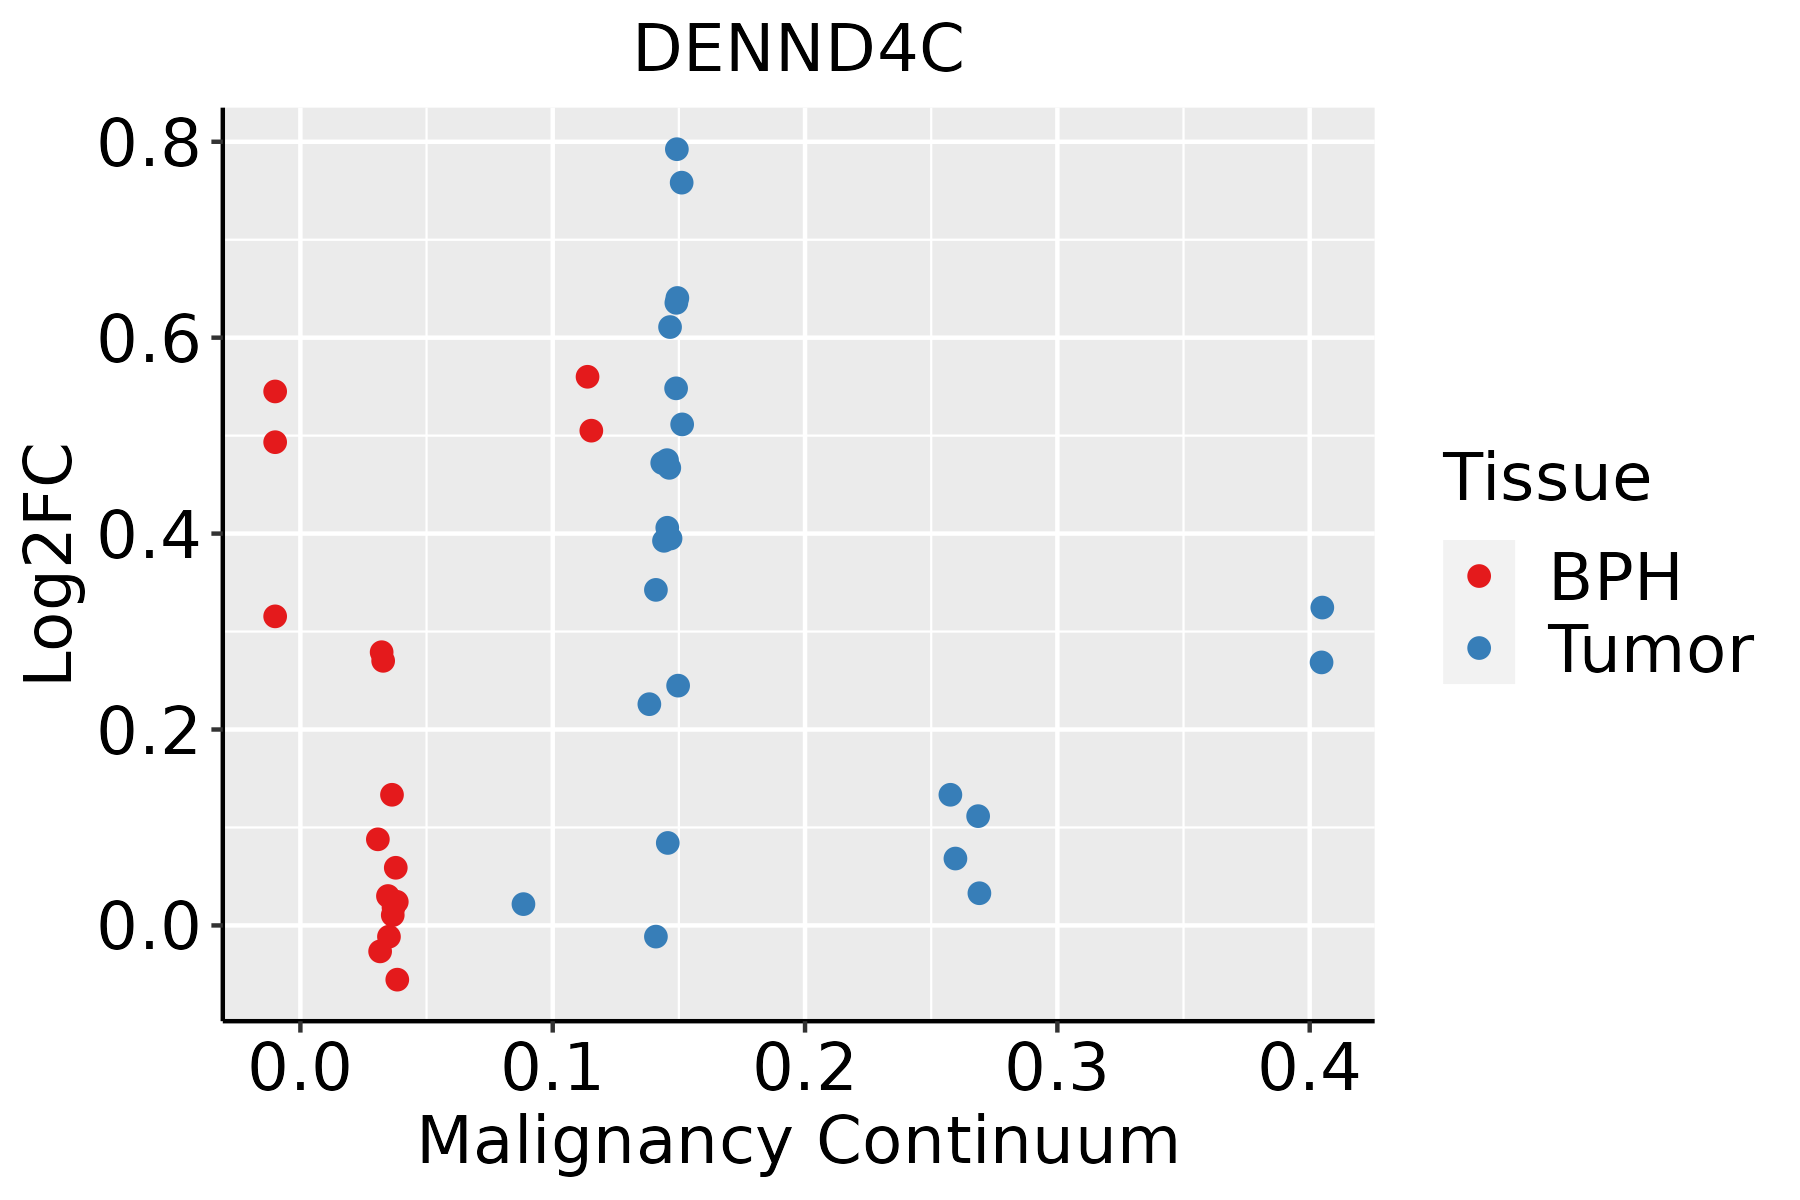 | BPH: Benign Prostatic Hyperplasia |
| Skin |  | AK: Actinic keratosis |
| cSCC: Cutaneous squamous cell carcinoma | ||
| SCCIS:squamous cell carcinoma in situ | ||
| Thyroid |  | ATC: Anaplastic thyroid cancer |
| HT: Hashimoto's thyroiditis | ||
| PTC: Papillary thyroid cancer |
| ∗log2FC in expression of this searched gene in stem-like cells from each diseased tissue sample relative to stem-like cells in normal samples in each tissue plotted against the malignancy continuum. Samples are colored based on if they are from different disease stage. |
Top |
Malignant transformation related pathway analysis |
| Find out the enriched GO biological processes and KEGG pathways involved in transition from healthy to precancer to cancer |
| Tissue | Disease Stage | Enriched GO biological Processes |
| Colorectum | AD |  |
| Colorectum | SER |  |
| Colorectum | MSS |  |
| Colorectum | MSI-H |  |
| Colorectum | FAP |  |
| ∗Top 15 enriched GO BP terms are showed in the bar plot of each disease state in each tissue. Each row represents a significant GO biological process which is colored according to the -log10(p.adjust). |
| Page: 1 2 3 4 5 6 7 8 9 |
| GO ID | Tissue | Disease Stage | Description | Gene Ratio | Bg Ratio | pvalue | p.adjust | Count |
| GO:007265910 | Cervix | CC | protein localization to plasma membrane | 73/2311 | 284/18723 | 4.95e-10 | 6.73e-08 | 73 |
| GO:00510566 | Cervix | CC | regulation of small GTPase mediated signal transduction | 75/2311 | 302/18723 | 1.54e-09 | 1.74e-07 | 75 |
| GO:00072656 | Cervix | CC | Ras protein signal transduction | 79/2311 | 337/18723 | 9.49e-09 | 7.77e-07 | 79 |
| GO:19907788 | Cervix | CC | protein localization to cell periphery | 78/2311 | 333/18723 | 1.22e-08 | 9.73e-07 | 78 |
| GO:19016538 | Cervix | CC | cellular response to peptide | 72/2311 | 359/18723 | 1.89e-05 | 3.48e-04 | 72 |
| GO:00465785 | Cervix | CC | regulation of Ras protein signal transduction | 44/2311 | 189/18723 | 2.05e-05 | 3.73e-04 | 44 |
| GO:00434349 | Cervix | CC | response to peptide hormone | 77/2311 | 414/18723 | 1.40e-04 | 1.70e-03 | 77 |
| GO:00713757 | Cervix | CC | cellular response to peptide hormone stimulus | 57/2311 | 290/18723 | 2.32e-04 | 2.59e-03 | 57 |
| GO:00328698 | Cervix | CC | cellular response to insulin stimulus | 42/2311 | 203/18723 | 4.95e-04 | 4.83e-03 | 42 |
| GO:00328688 | Cervix | CC | response to insulin | 50/2311 | 264/18723 | 1.28e-03 | 1.02e-02 | 50 |
| GO:0072659 | Colorectum | AD | protein localization to plasma membrane | 122/3918 | 284/18723 | 2.86e-17 | 1.49e-14 | 122 |
| GO:1990778 | Colorectum | AD | protein localization to cell periphery | 129/3918 | 333/18723 | 5.51e-14 | 1.15e-11 | 129 |
| GO:0032868 | Colorectum | AD | response to insulin | 91/3918 | 264/18723 | 2.02e-07 | 8.48e-06 | 91 |
| GO:1901653 | Colorectum | AD | cellular response to peptide | 114/3918 | 359/18723 | 8.32e-07 | 2.88e-05 | 114 |
| GO:0032869 | Colorectum | AD | cellular response to insulin stimulus | 72/3918 | 203/18723 | 1.10e-06 | 3.68e-05 | 72 |
| GO:0071375 | Colorectum | AD | cellular response to peptide hormone stimulus | 95/3918 | 290/18723 | 1.50e-06 | 4.66e-05 | 95 |
| GO:0043434 | Colorectum | AD | response to peptide hormone | 126/3918 | 414/18723 | 2.70e-06 | 7.86e-05 | 126 |
| GO:0007265 | Colorectum | AD | Ras protein signal transduction | 104/3918 | 337/18723 | 1.01e-05 | 2.35e-04 | 104 |
| GO:0051056 | Colorectum | AD | regulation of small GTPase mediated signal transduction | 94/3918 | 302/18723 | 1.81e-05 | 3.76e-04 | 94 |
| GO:0046578 | Colorectum | AD | regulation of Ras protein signal transduction | 56/3918 | 189/18723 | 2.85e-03 | 2.14e-02 | 56 |
| Page: 1 2 3 4 5 6 7 8 9 |
| Pathway ID | Tissue | Disease Stage | Description | Gene Ratio | Bg Ratio | pvalue | p.adjust | qvalue | Count |
| Page: 1 |
Top |
Cell-cell communication analysis |
| Identification of potential cell-cell interactions between two cell types and their ligand-receptor pairs for different disease states |
| Ligand | Receptor | LRpair | Pathway | Tissue | Disease Stage |
| Page: 1 |
Top |
Single-cell gene regulatory network inference analysis |
| Find out the significant the regulons (TFs) and the target genes of each regulon across cell types for different disease states |
| TF | Cell Type | Tissue | Disease Stage | Target Gene | RSS | Regulon Activity |
| ∗The dot plots of a searched regulon are shown for all cell subpopulations in each disease state of each tissue based on the regulon specific score inferred using pySCENIC and by calculating the average expression. |
| Page: 1 |
Top |
Somatic mutation of malignant transformation related genes |
| Annotation of somatic variants for genes involved in malignant transformation |
| Hugo Symbol | Variant Class | Variant Classification | dbSNP RS | HGVSc | HGVSp | HGVSp Short | SWISSPROT | BIOTYPE | SIFT | PolyPhen | Tumor Sample Barcode | Tissue | Histology | Sex | Age | Stage | Therapy Types | Drugs | Outcome |
| DENND4C | insertion | Frame_Shift_Ins | novel | c.959_960insT | p.Glu323Ter | p.E323* | protein_coding | TCGA-MX-A5UJ-01 | Stomach | stomach adenocarcinoma | Female | >=65 | III/IV | Unknown | Unknown | SD | |||
| DENND4C | SNV | Missense_Mutation | c.5177N>A | p.Arg1726Lys | p.R1726K | protein_coding | tolerated(0.78) | benign(0.015) | TCGA-DJ-A2PS-01 | Thyroid | thyroid carcinoma | Female | <65 | I/II | Unknown | Unknown | SD | ||
| DENND4C | SNV | Missense_Mutation | novel | c.4988N>T | p.Gly1663Val | p.G1663V | protein_coding | tolerated(0.21) | benign(0.005) | TCGA-EM-A2CN-01 | Thyroid | thyroid carcinoma | Male | <65 | I/II | Unknown | Unknown | SD | |
| DENND4C | insertion | Frame_Shift_Ins | novel | c.1732_1733insAAAACAGAAAATGGTATTAT | p.Arg578LysfsTer35 | p.R578Kfs*35 | protein_coding | TCGA-BJ-A45E-01 | Thyroid | thyroid carcinoma | Female | <65 | I/II | Unknown | Unknown | SD | |||
| DENND4C | insertion | Frame_Shift_Ins | novel | c.1767_1768insGTTTTTTGGTG | p.Asn590ValfsTer4 | p.N590Vfs*4 | protein_coding | TCGA-DJ-A3VL-01 | Thyroid | thyroid carcinoma | Male | <65 | I/II | Unknown | Unknown | PD | |||
| DENND4C | insertion | Frame_Shift_Ins | novel | c.1732_1733insAAAACAGAAAATGGTATTAT | p.Arg578LysfsTer35 | p.R578Kfs*35 | protein_coding | TCGA-ET-A40S-01 | Thyroid | thyroid carcinoma | Male | <65 | I/II | Unknown | Unknown | SD |
| Page: 1 2 3 4 5 6 7 8 9 10 11 12 13 14 15 16 17 |
Top |
Related drugs of malignant transformation related genes |
| Identification of chemicals and drugs interact with genes involved in malignant transfromation |
| (DGIdb 4.0) |
| Entrez ID | Symbol | Category | Interaction Types | Drug Claim Name | Drug Name | PMIDs |
| Page: 1 |

Copyright 2023-Present -The University of Texas Health Science Center at Houston |