
|
|||||
|
 | |
| |
| |
| |
| |
| |
|
Gene: ABCB11 |
Gene summary for ABCB11 |
| Gene information | Species | Human | Gene symbol | ABCB11 | Gene ID | 8647 |
| Gene name | ATP binding cassette subfamily B member 11 | |
| Gene Alias | ABC16 | |
| Cytomap | 2q31.1 | |
| Gene Type | protein-coding | GO ID | GO:0006082 | UniProtAcc | O95342 |
Top |
Malignant transformation analysis |
| Identification of the aberrant gene expression in precancerous and cancerous lesions by comparing the gene expression of stem-like cells in diseased tissues with normal stem cells |
| Entrez ID | Symbol | Replicates | Species | Organ | Tissue | Adj P-value | Log2FC | Malignancy |
| 8647 | ABCB11 | NAFLD1 | Human | Liver | NAFLD | 9.52e-20 | 1.57e+00 | -0.04 |
| 8647 | ABCB11 | S41 | Human | Liver | Cirrhotic | 4.37e-11 | 9.61e-01 | -0.0343 |
| 8647 | ABCB11 | S43 | Human | Liver | Cirrhotic | 4.65e-03 | -2.57e-02 | -0.0187 |
| 8647 | ABCB11 | HCC1_Meng | Human | Liver | HCC | 2.24e-05 | -1.70e-01 | 0.0246 |
| 8647 | ABCB11 | HCC2_Meng | Human | Liver | HCC | 1.02e-04 | -1.70e-01 | 0.0107 |
| 8647 | ABCB11 | cirrhotic1 | Human | Liver | Cirrhotic | 2.24e-05 | -1.70e-01 | 0.0202 |
| 8647 | ABCB11 | cirrhotic2 | Human | Liver | Cirrhotic | 4.78e-05 | -1.70e-01 | 0.0201 |
| 8647 | ABCB11 | Pt13.a | Human | Liver | HCC | 3.03e-03 | -1.64e-01 | 0.021 |
| 8647 | ABCB11 | Pt14.d | Human | Liver | HCC | 2.24e-05 | -1.70e-01 | 0.0143 |
| Page: 1 |
| Tissue | Expression Dynamics | Abbreviation |
| Liver | 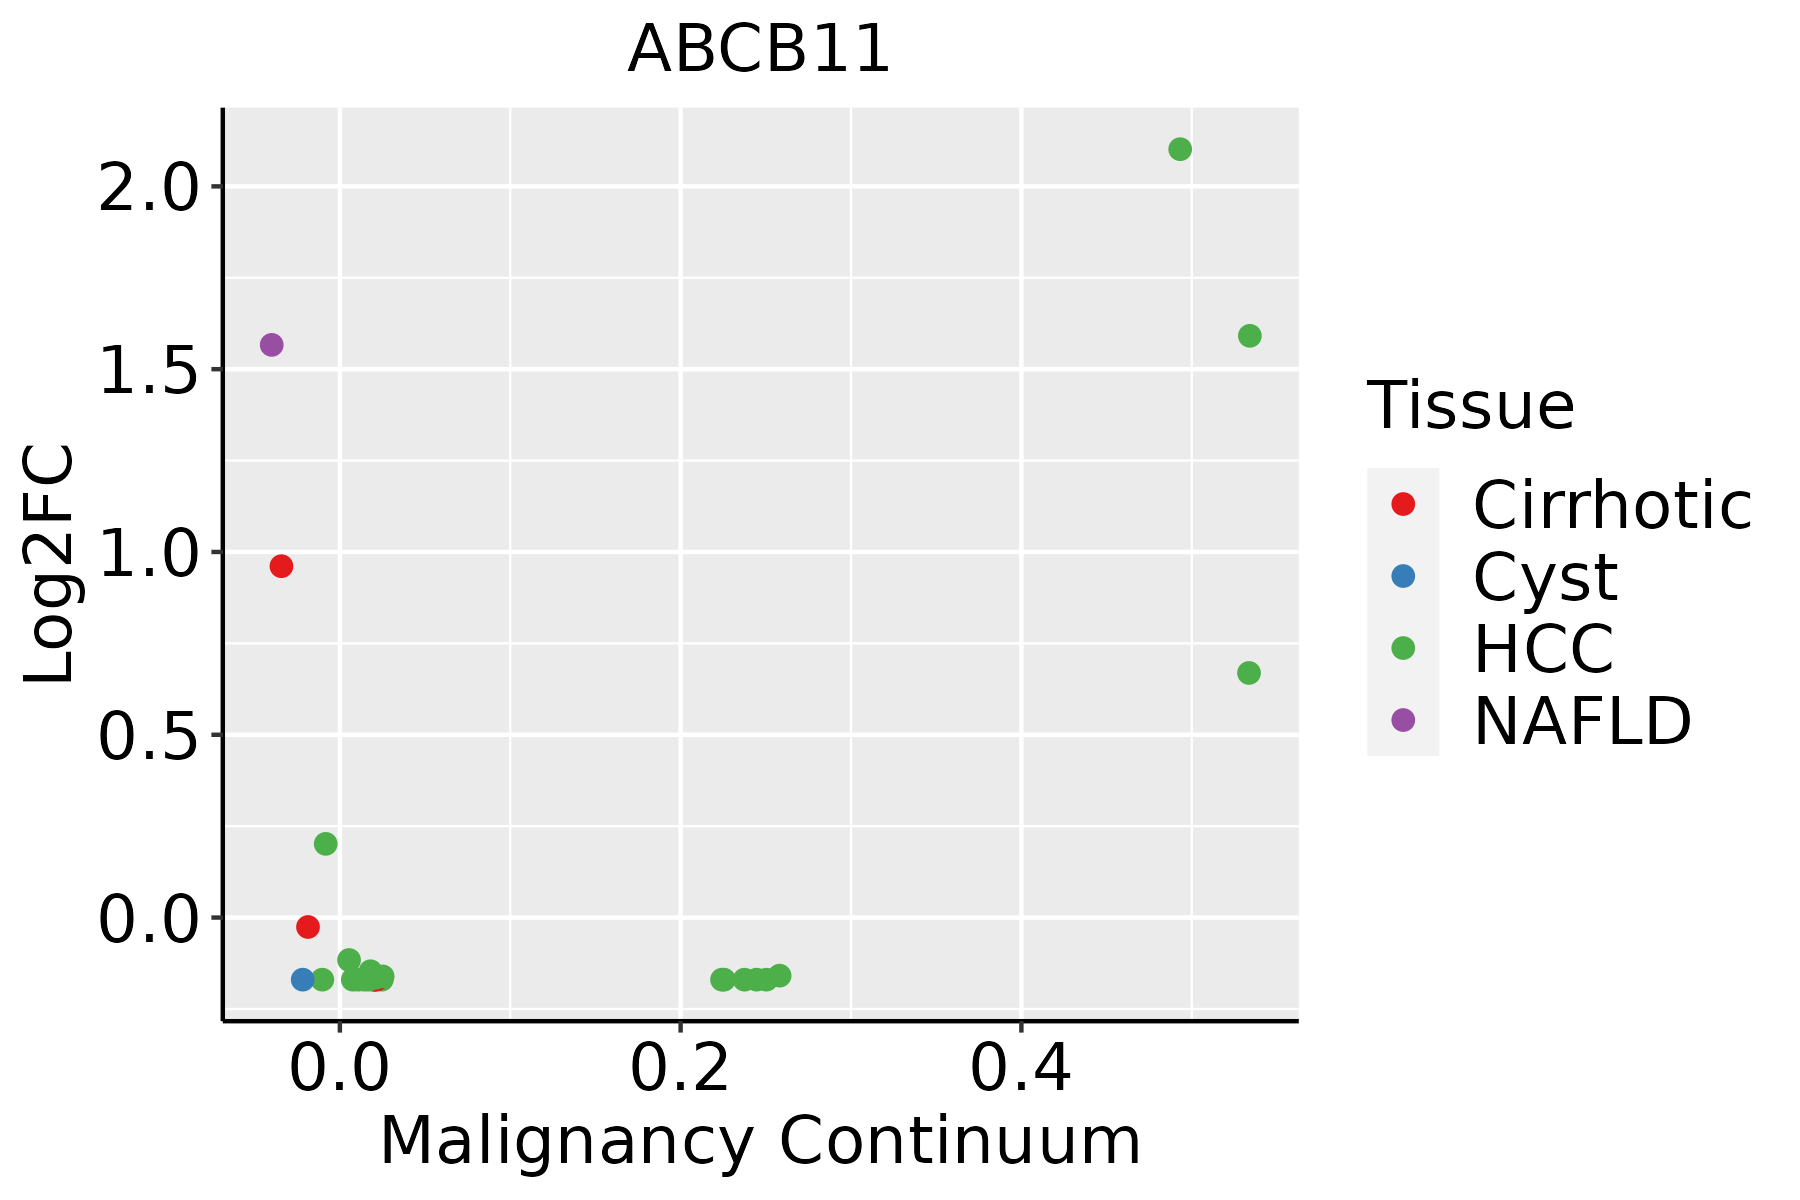 | HCC: Hepatocellular carcinoma |
| NAFLD: Non-alcoholic fatty liver disease |
| ∗log2FC in expression of this searched gene in stem-like cells from each diseased tissue sample relative to stem-like cells in normal samples in each tissue plotted against the malignancy continuum. Samples are colored based on if they are from different disease stage. |
Top |
Malignant transformation related pathway analysis |
| Find out the enriched GO biological processes and KEGG pathways involved in transition from healthy to precancer to cancer |
| Tissue | Disease Stage | Enriched GO biological Processes |
| Colorectum | AD |  |
| Colorectum | SER |  |
| Colorectum | MSS |  |
| Colorectum | MSI-H |  |
| Colorectum | FAP |  |
| ∗Top 15 enriched GO BP terms are showed in the bar plot of each disease state in each tissue. Each row represents a significant GO biological process which is colored according to the -log10(p.adjust). |
| Page: 1 2 3 4 5 6 7 8 9 |
| GO ID | Tissue | Disease Stage | Description | Gene Ratio | Bg Ratio | pvalue | p.adjust | Count |
| GO:00463953 | Liver | NAFLD | carboxylic acid catabolic process | 73/1882 | 236/18723 | 4.16e-19 | 1.22e-15 | 73 |
| GO:00160544 | Liver | NAFLD | organic acid catabolic process | 73/1882 | 240/18723 | 1.20e-18 | 2.34e-15 | 73 |
| GO:00442825 | Liver | NAFLD | small molecule catabolic process | 91/1882 | 376/18723 | 8.96e-16 | 1.31e-12 | 91 |
| GO:00066316 | Liver | NAFLD | fatty acid metabolic process | 92/1882 | 390/18723 | 3.38e-15 | 3.29e-12 | 92 |
| GO:00160535 | Liver | NAFLD | organic acid biosynthetic process | 77/1882 | 316/18723 | 1.03e-13 | 6.69e-11 | 77 |
| GO:00463945 | Liver | NAFLD | carboxylic acid biosynthetic process | 75/1882 | 314/18723 | 6.37e-13 | 3.39e-10 | 75 |
| GO:00723295 | Liver | NAFLD | monocarboxylic acid catabolic process | 39/1882 | 122/18723 | 2.40e-11 | 8.77e-09 | 39 |
| GO:00090626 | Liver | NAFLD | fatty acid catabolic process | 34/1882 | 100/18723 | 6.81e-11 | 1.99e-08 | 34 |
| GO:00082023 | Liver | NAFLD | steroid metabolic process | 69/1882 | 319/18723 | 5.90e-10 | 1.28e-07 | 69 |
| GO:00193956 | Liver | NAFLD | fatty acid oxidation | 33/1882 | 103/18723 | 7.58e-10 | 1.53e-07 | 33 |
| GO:00442425 | Liver | NAFLD | cellular lipid catabolic process | 52/1882 | 214/18723 | 1.15e-09 | 2.17e-07 | 52 |
| GO:00550883 | Liver | NAFLD | lipid homeostasis | 44/1882 | 167/18723 | 1.48e-09 | 2.54e-07 | 44 |
| GO:00094107 | Liver | NAFLD | response to xenobiotic stimulus | 88/1882 | 462/18723 | 2.53e-09 | 4.11e-07 | 88 |
| GO:00344405 | Liver | NAFLD | lipid oxidation | 33/1882 | 108/18723 | 2.96e-09 | 4.56e-07 | 33 |
| GO:00302585 | Liver | NAFLD | lipid modification | 49/1882 | 212/18723 | 1.97e-08 | 2.17e-06 | 49 |
| GO:0008206 | Liver | NAFLD | bile acid metabolic process | 19/1882 | 49/18723 | 9.82e-08 | 7.76e-06 | 19 |
| GO:00160426 | Liver | NAFLD | lipid catabolic process | 63/1882 | 320/18723 | 1.35e-07 | 1.02e-05 | 63 |
| GO:00108765 | Liver | NAFLD | lipid localization | 79/1882 | 448/18723 | 4.75e-07 | 2.92e-05 | 79 |
| GO:00723303 | Liver | NAFLD | monocarboxylic acid biosynthetic process | 46/1882 | 214/18723 | 5.06e-07 | 3.07e-05 | 46 |
| GO:00066356 | Liver | NAFLD | fatty acid beta-oxidation | 23/1882 | 74/18723 | 5.09e-07 | 3.07e-05 | 23 |
| Page: 1 2 3 4 5 6 |
| Pathway ID | Tissue | Disease Stage | Description | Gene Ratio | Bg Ratio | pvalue | p.adjust | qvalue | Count |
| hsa049796 | Liver | NAFLD | Cholesterol metabolism | 20/1043 | 51/8465 | 9.73e-07 | 4.56e-05 | 3.67e-05 | 20 |
| hsa02010 | Liver | NAFLD | ABC transporters | 16/1043 | 45/8465 | 4.97e-05 | 1.16e-03 | 9.37e-04 | 16 |
| hsa049762 | Liver | NAFLD | Bile secretion | 20/1043 | 89/8465 | 5.08e-03 | 4.43e-02 | 3.57e-02 | 20 |
| hsa0497911 | Liver | NAFLD | Cholesterol metabolism | 20/1043 | 51/8465 | 9.73e-07 | 4.56e-05 | 3.67e-05 | 20 |
| hsa020101 | Liver | NAFLD | ABC transporters | 16/1043 | 45/8465 | 4.97e-05 | 1.16e-03 | 9.37e-04 | 16 |
| hsa0497611 | Liver | NAFLD | Bile secretion | 20/1043 | 89/8465 | 5.08e-03 | 4.43e-02 | 3.57e-02 | 20 |
| hsa049794 | Liver | HCC | Cholesterol metabolism | 41/4020 | 51/8465 | 1.33e-06 | 1.35e-05 | 7.49e-06 | 41 |
| hsa01522 | Liver | HCC | Endocrine resistance | 58/4020 | 98/8465 | 1.28e-02 | 3.19e-02 | 1.78e-02 | 58 |
| hsa020102 | Liver | HCC | ABC transporters | 29/4020 | 45/8465 | 1.62e-02 | 3.88e-02 | 2.16e-02 | 29 |
| hsa049795 | Liver | HCC | Cholesterol metabolism | 41/4020 | 51/8465 | 1.33e-06 | 1.35e-05 | 7.49e-06 | 41 |
| hsa015221 | Liver | HCC | Endocrine resistance | 58/4020 | 98/8465 | 1.28e-02 | 3.19e-02 | 1.78e-02 | 58 |
| hsa020103 | Liver | HCC | ABC transporters | 29/4020 | 45/8465 | 1.62e-02 | 3.88e-02 | 2.16e-02 | 29 |
| Page: 1 |
Top |
Cell-cell communication analysis |
| Identification of potential cell-cell interactions between two cell types and their ligand-receptor pairs for different disease states |
| Ligand | Receptor | LRpair | Pathway | Tissue | Disease Stage |
| Page: 1 |
Top |
Single-cell gene regulatory network inference analysis |
| Find out the significant the regulons (TFs) and the target genes of each regulon across cell types for different disease states |
| TF | Cell Type | Tissue | Disease Stage | Target Gene | RSS | Regulon Activity |
| ∗The dot plots of a searched regulon are shown for all cell subpopulations in each disease state of each tissue based on the regulon specific score inferred using pySCENIC and by calculating the average expression. |
| Page: 1 |
Top |
Somatic mutation of malignant transformation related genes |
| Annotation of somatic variants for genes involved in malignant transformation |
| Hugo Symbol | Variant Class | Variant Classification | dbSNP RS | HGVSc | HGVSp | HGVSp Short | SWISSPROT | BIOTYPE | SIFT | PolyPhen | Tumor Sample Barcode | Tissue | Histology | Sex | Age | Stage | Therapy Types | Drugs | Outcome |
| ABCB11 | SNV | Missense_Mutation | rs868669576 | c.2984N>T | p.Ala995Val | p.A995V | O95342 | protein_coding | tolerated(0.1) | possibly_damaging(0.833) | TCGA-FY-A3TY-01 | Thyroid | thyroid carcinoma | Female | <65 | III/IV | Unknown | Unknown | SD |
| ABCB11 | SNV | Missense_Mutation | c.3755N>G | p.Glu1252Gly | p.E1252G | O95342 | protein_coding | deleterious(0) | probably_damaging(0.999) | TCGA-IM-A3U3-01 | Thyroid | thyroid carcinoma | Female | <65 | I/II | Unknown | Unknown | SD |
| Page: 1 2 3 4 5 6 7 8 9 10 11 12 13 14 15 16 17 |
Top |
Related drugs of malignant transformation related genes |
| Identification of chemicals and drugs interact with genes involved in malignant transfromation |
| (DGIdb 4.0) |
| Entrez ID | Symbol | Category | Interaction Types | Drug Claim Name | Drug Name | PMIDs |
| 8647 | ABCB11 | TRANSPORTER, DRUGGABLE GENOME, ABC TRANSPORTER, CELL SURFACE | CHENODIOL | CHENODIOL | 19102680 | |
| 8647 | ABCB11 | TRANSPORTER, DRUGGABLE GENOME, ABC TRANSPORTER, CELL SURFACE | lapatinib | LAPATINIB | 23556451 | |
| 8647 | ABCB11 | TRANSPORTER, DRUGGABLE GENOME, ABC TRANSPORTER, CELL SURFACE | CHOLIC ACID | CHOLIC ACID | 22464344 | |
| 8647 | ABCB11 | TRANSPORTER, DRUGGABLE GENOME, ABC TRANSPORTER, CELL SURFACE | CYCLOSPORINE | CYCLOSPORINE | 23129211 | |
| 8647 | ABCB11 | TRANSPORTER, DRUGGABLE GENOME, ABC TRANSPORTER, CELL SURFACE | pravastatin | PRAVASTATIN | ||
| 8647 | ABCB11 | TRANSPORTER, DRUGGABLE GENOME, ABC TRANSPORTER, CELL SURFACE | rosuvastatin | ROSUVASTATIN | ||
| 8647 | ABCB11 | TRANSPORTER, DRUGGABLE GENOME, ABC TRANSPORTER, CELL SURFACE | HYDROXYPROGESTERONE CAPROATE | HYDROXYPROGESTERONE CAPROATE | 23129211 | |
| 8647 | ABCB11 | TRANSPORTER, DRUGGABLE GENOME, ABC TRANSPORTER, CELL SURFACE | 178101266 | |||
| 8647 | ABCB11 | TRANSPORTER, DRUGGABLE GENOME, ABC TRANSPORTER, CELL SURFACE | GS-9256 | GS-9256 | 22244938 | |
| 8647 | ABCB11 | TRANSPORTER, DRUGGABLE GENOME, ABC TRANSPORTER, CELL SURFACE | hmg coa reductase inhibitors |
| Page: 1 |

Copyright 2023-Present -The University of Texas Health Science Center at Houston |