
|
|||||
|
 | |
| |
| |
| |
| |
| |
|
Gene: PLEKHA5 |
Gene summary for PLEKHA5 |
| Gene information | Species | Human | Gene symbol | PLEKHA5 | Gene ID | 54477 |
| Gene name | pleckstrin homology domain containing A5 | |
| Gene Alias | PEPP-2 | |
| Cytomap | 12p12.3 | |
| Gene Type | protein-coding | GO ID | GO:0007275 | UniProtAcc | A0A024RAY7 |
Top |
Malignant transformation analysis |
| Identification of the aberrant gene expression in precancerous and cancerous lesions by comparing the gene expression of stem-like cells in diseased tissues with normal stem cells |
| Entrez ID | Symbol | Replicates | Species | Organ | Tissue | Adj P-value | Log2FC | Malignancy |
| 54477 | PLEKHA5 | CA_HPV_1 | Human | Cervix | CC | 6.88e-06 | -1.87e-01 | 0.0264 |
| 54477 | PLEKHA5 | CCI_1 | Human | Cervix | CC | 4.65e-06 | 1.09e+00 | 0.528 |
| 54477 | PLEKHA5 | CCI_2 | Human | Cervix | CC | 1.67e-08 | 1.44e+00 | 0.5249 |
| 54477 | PLEKHA5 | CCI_3 | Human | Cervix | CC | 3.56e-25 | 1.70e+00 | 0.516 |
| 54477 | PLEKHA5 | HTA11_3410_2000001011 | Human | Colorectum | AD | 7.86e-13 | -4.53e-01 | 0.0155 |
| 54477 | PLEKHA5 | HTA11_1938_2000001011 | Human | Colorectum | AD | 1.15e-03 | 4.74e-01 | -0.0811 |
| 54477 | PLEKHA5 | HTA11_347_2000001011 | Human | Colorectum | AD | 1.23e-11 | 6.34e-01 | -0.1954 |
| 54477 | PLEKHA5 | HTA11_3361_2000001011 | Human | Colorectum | AD | 1.27e-02 | -4.26e-01 | -0.1207 |
| 54477 | PLEKHA5 | HTA11_5216_2000001011 | Human | Colorectum | SER | 1.49e-02 | -6.51e-01 | -0.1462 |
| 54477 | PLEKHA5 | HTA11_9341_2000001011 | Human | Colorectum | SER | 1.99e-02 | -5.09e-01 | -0.00410000000000005 |
| 54477 | PLEKHA5 | HTA11_99999970781_79442 | Human | Colorectum | MSS | 1.10e-17 | -5.28e-01 | 0.294 |
| 54477 | PLEKHA5 | HTA11_99999965062_69753 | Human | Colorectum | MSI-H | 5.64e-11 | 7.82e-01 | 0.3487 |
| 54477 | PLEKHA5 | HTA11_99999973899_84307 | Human | Colorectum | MSS | 2.71e-05 | -6.57e-01 | 0.2585 |
| 54477 | PLEKHA5 | HTA11_99999974143_84620 | Human | Colorectum | MSS | 2.67e-09 | -4.66e-01 | 0.3005 |
| 54477 | PLEKHA5 | A015-C-203 | Human | Colorectum | FAP | 1.39e-30 | -5.77e-01 | -0.1294 |
| 54477 | PLEKHA5 | A015-C-204 | Human | Colorectum | FAP | 1.14e-05 | -3.48e-01 | -0.0228 |
| 54477 | PLEKHA5 | A014-C-040 | Human | Colorectum | FAP | 8.90e-03 | -3.09e-01 | -0.1184 |
| 54477 | PLEKHA5 | A002-C-201 | Human | Colorectum | FAP | 4.96e-12 | -3.73e-01 | 0.0324 |
| 54477 | PLEKHA5 | A001-C-119 | Human | Colorectum | FAP | 1.23e-05 | -2.43e-01 | -0.1557 |
| 54477 | PLEKHA5 | A001-C-108 | Human | Colorectum | FAP | 3.73e-09 | -1.76e-01 | -0.0272 |
| Page: 1 2 3 4 5 6 7 8 9 10 11 12 13 |
| Tissue | Expression Dynamics | Abbreviation |
| Cervix |  | CC: Cervix cancer |
| HSIL_HPV: HPV-infected high-grade squamous intraepithelial lesions | ||
| N_HPV: HPV-infected normal cervix | ||
| Colorectum (GSE201348) |  | FAP: Familial adenomatous polyposis |
| CRC: Colorectal cancer | ||
| Colorectum (HTA11) |  | AD: Adenomas |
| SER: Sessile serrated lesions | ||
| MSI-H: Microsatellite-high colorectal cancer | ||
| MSS: Microsatellite stable colorectal cancer | ||
| Endometrium | 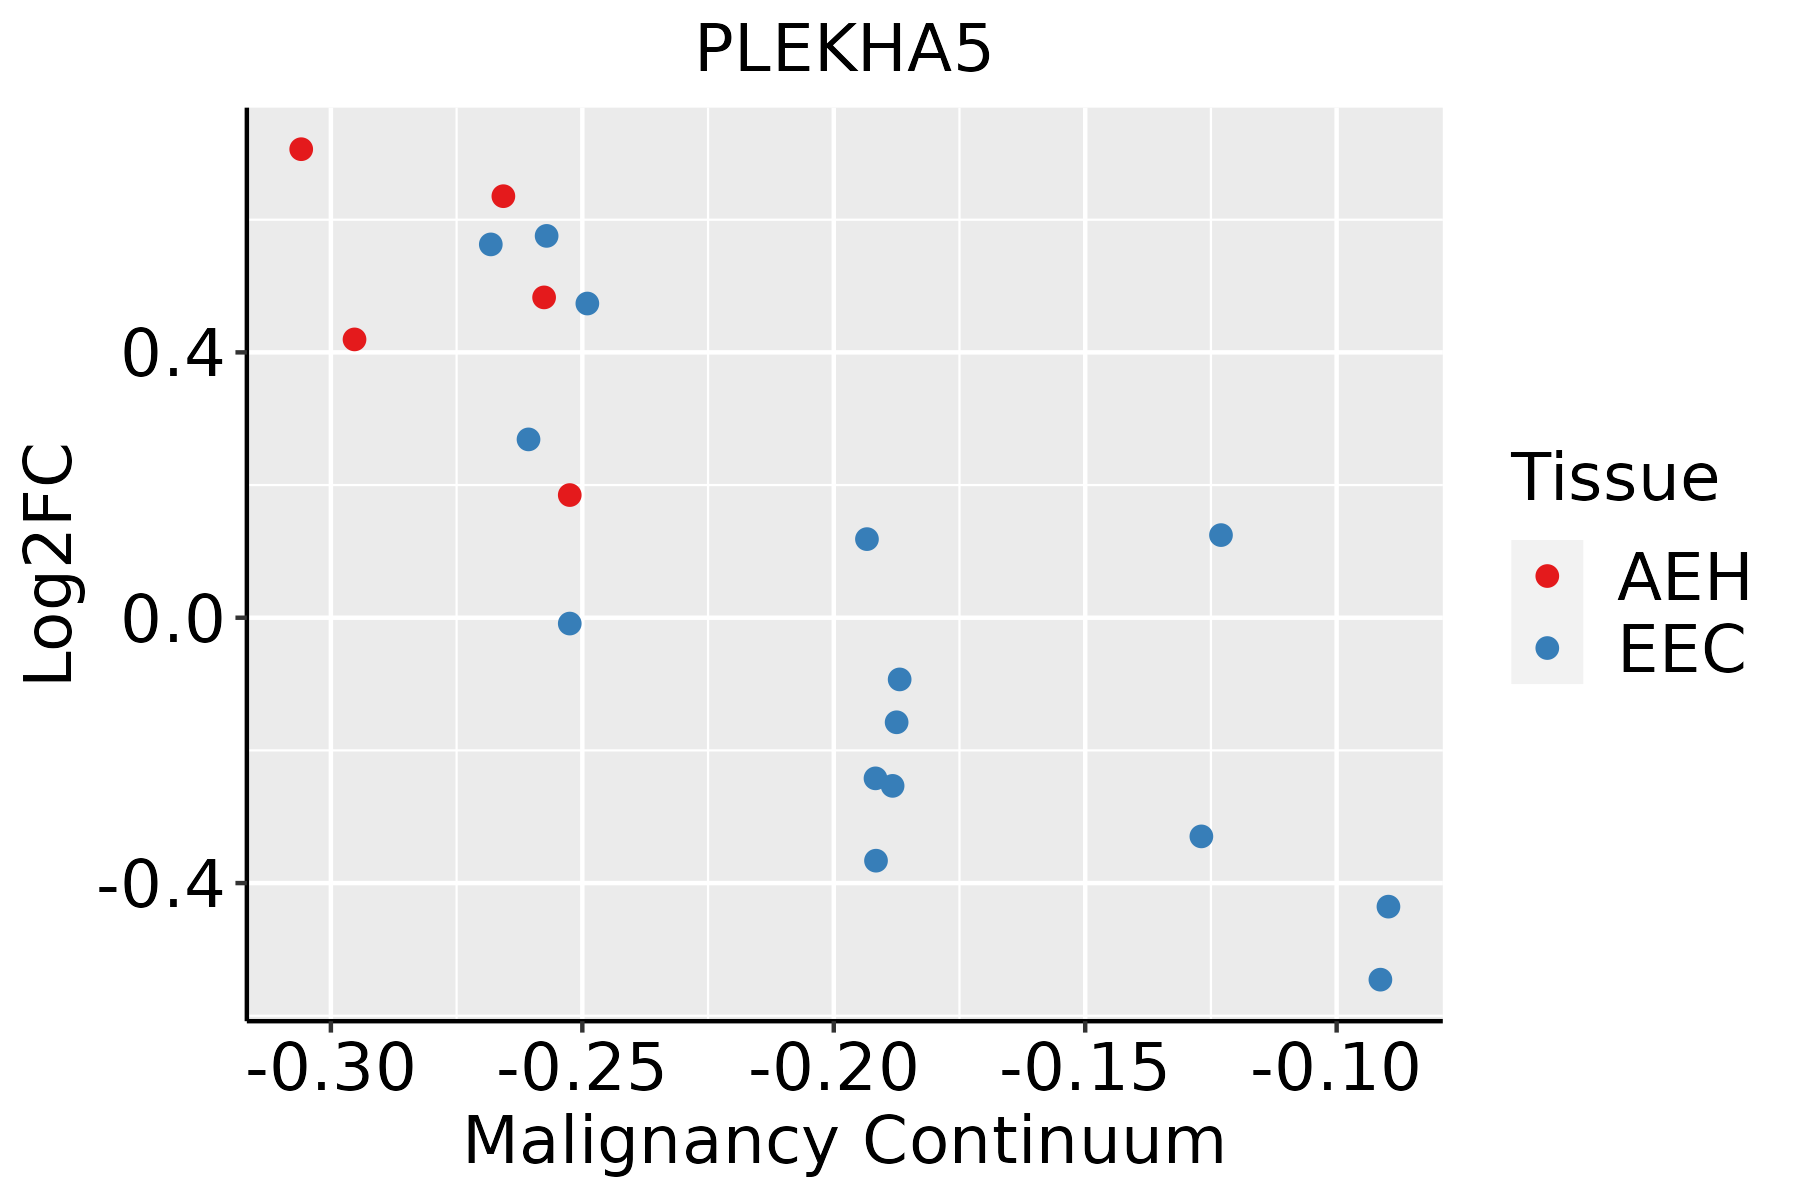 | AEH: Atypical endometrial hyperplasia |
| EEC: Endometrioid Cancer | ||
| Esophagus | 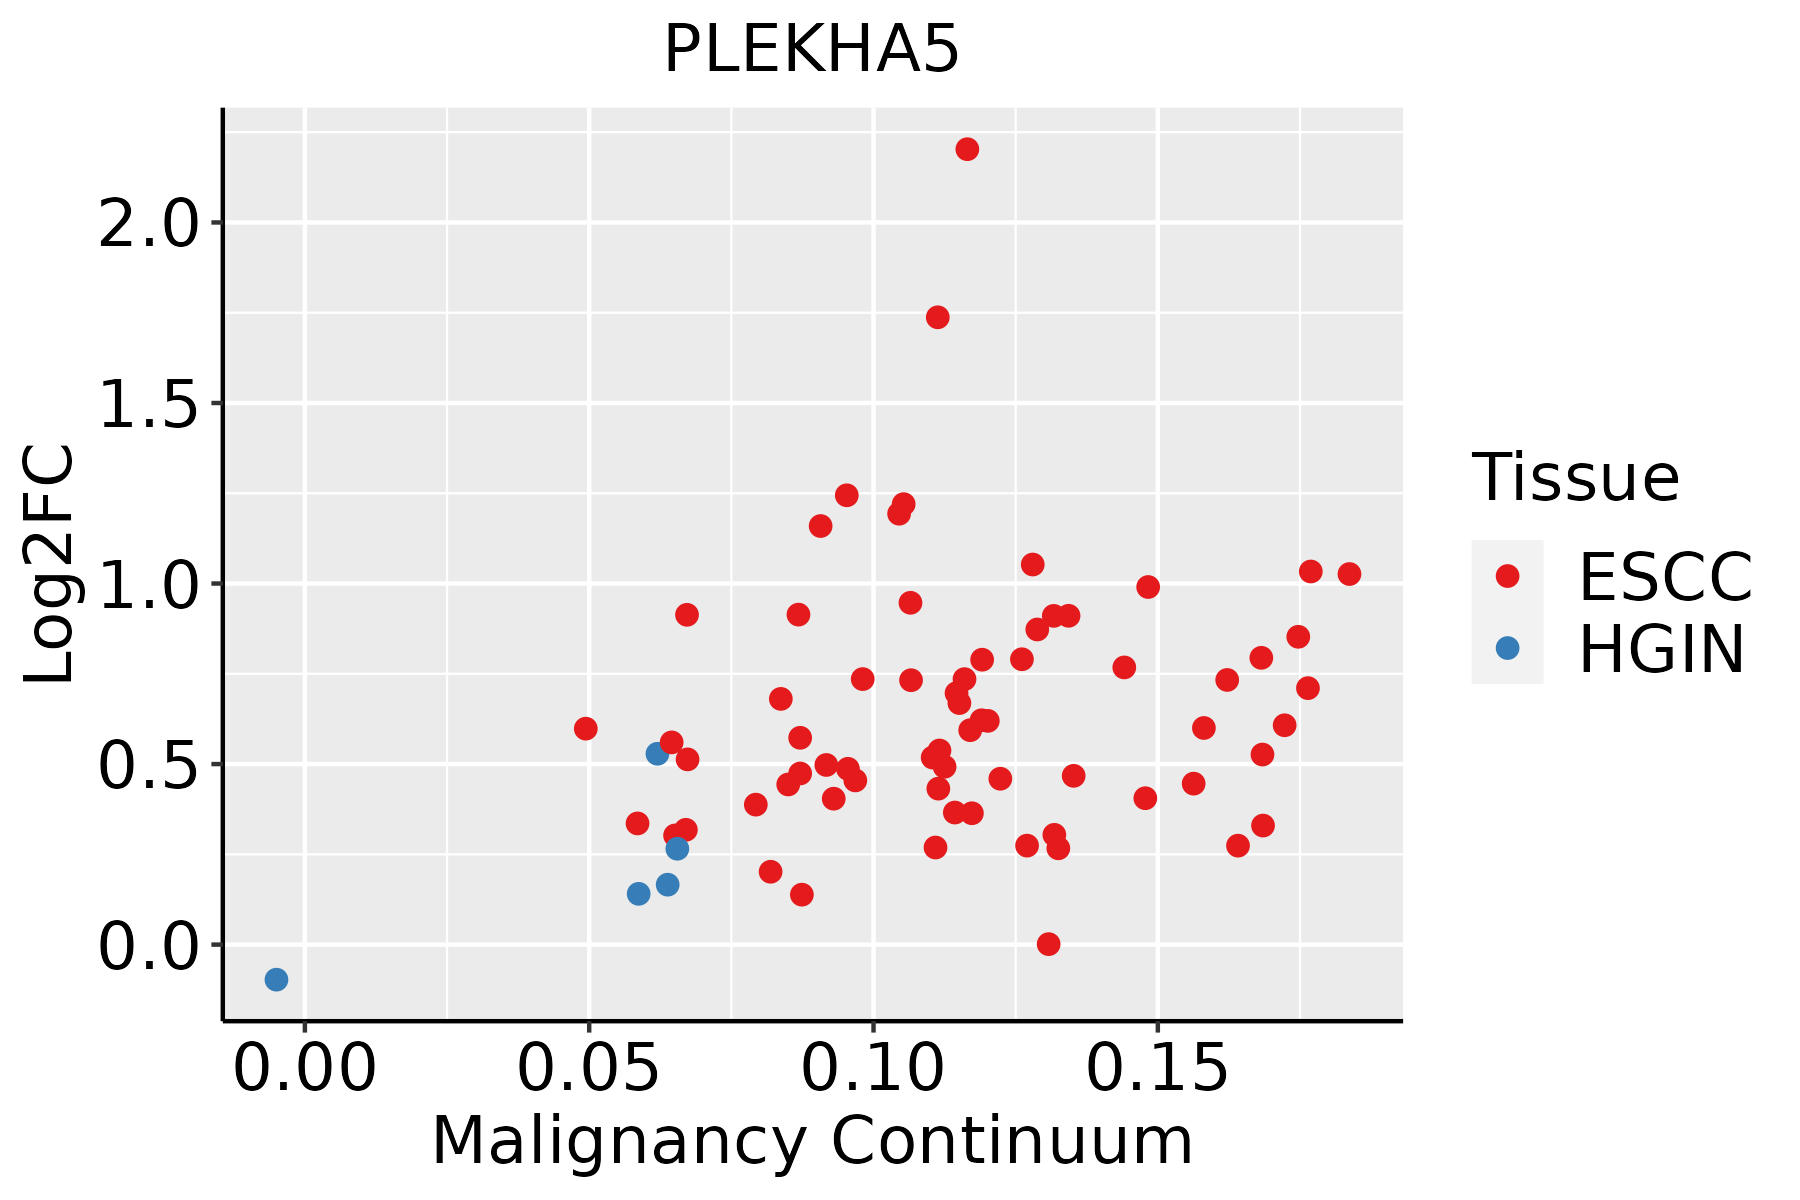 | ESCC: Esophageal squamous cell carcinoma |
| HGIN: High-grade intraepithelial neoplasias | ||
| LGIN: Low-grade intraepithelial neoplasias | ||
| GC |  | CAG: Chronic atrophic gastritis |
| CAG with IM: Chronic atrophic gastritis with intestinal metaplasia | ||
| CSG: Chronic superficial gastritis | ||
| GC: Gastric cancer | ||
| SIM: Severe intestinal metaplasia | ||
| WIM: Wild intestinal metaplasia | ||
| Liver | 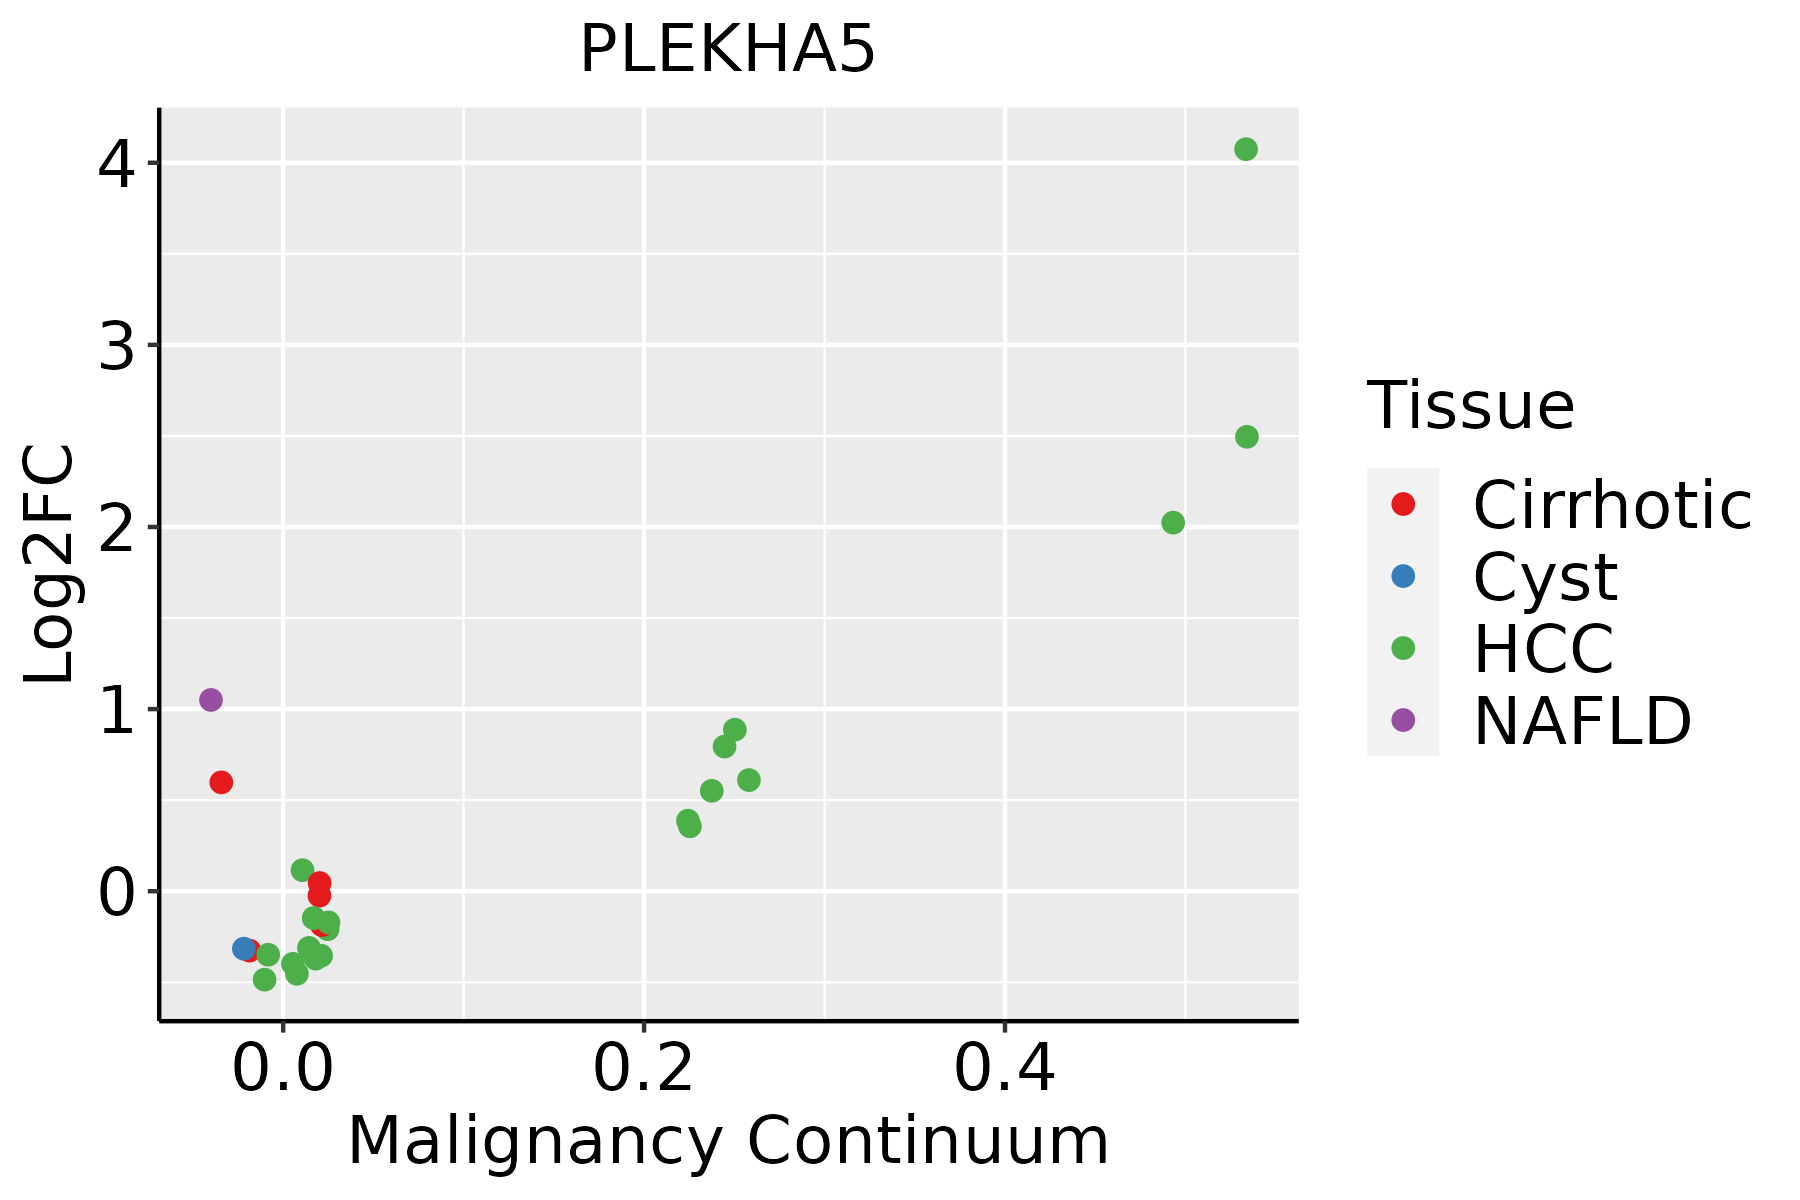 | HCC: Hepatocellular carcinoma |
| NAFLD: Non-alcoholic fatty liver disease | ||
| Lung | 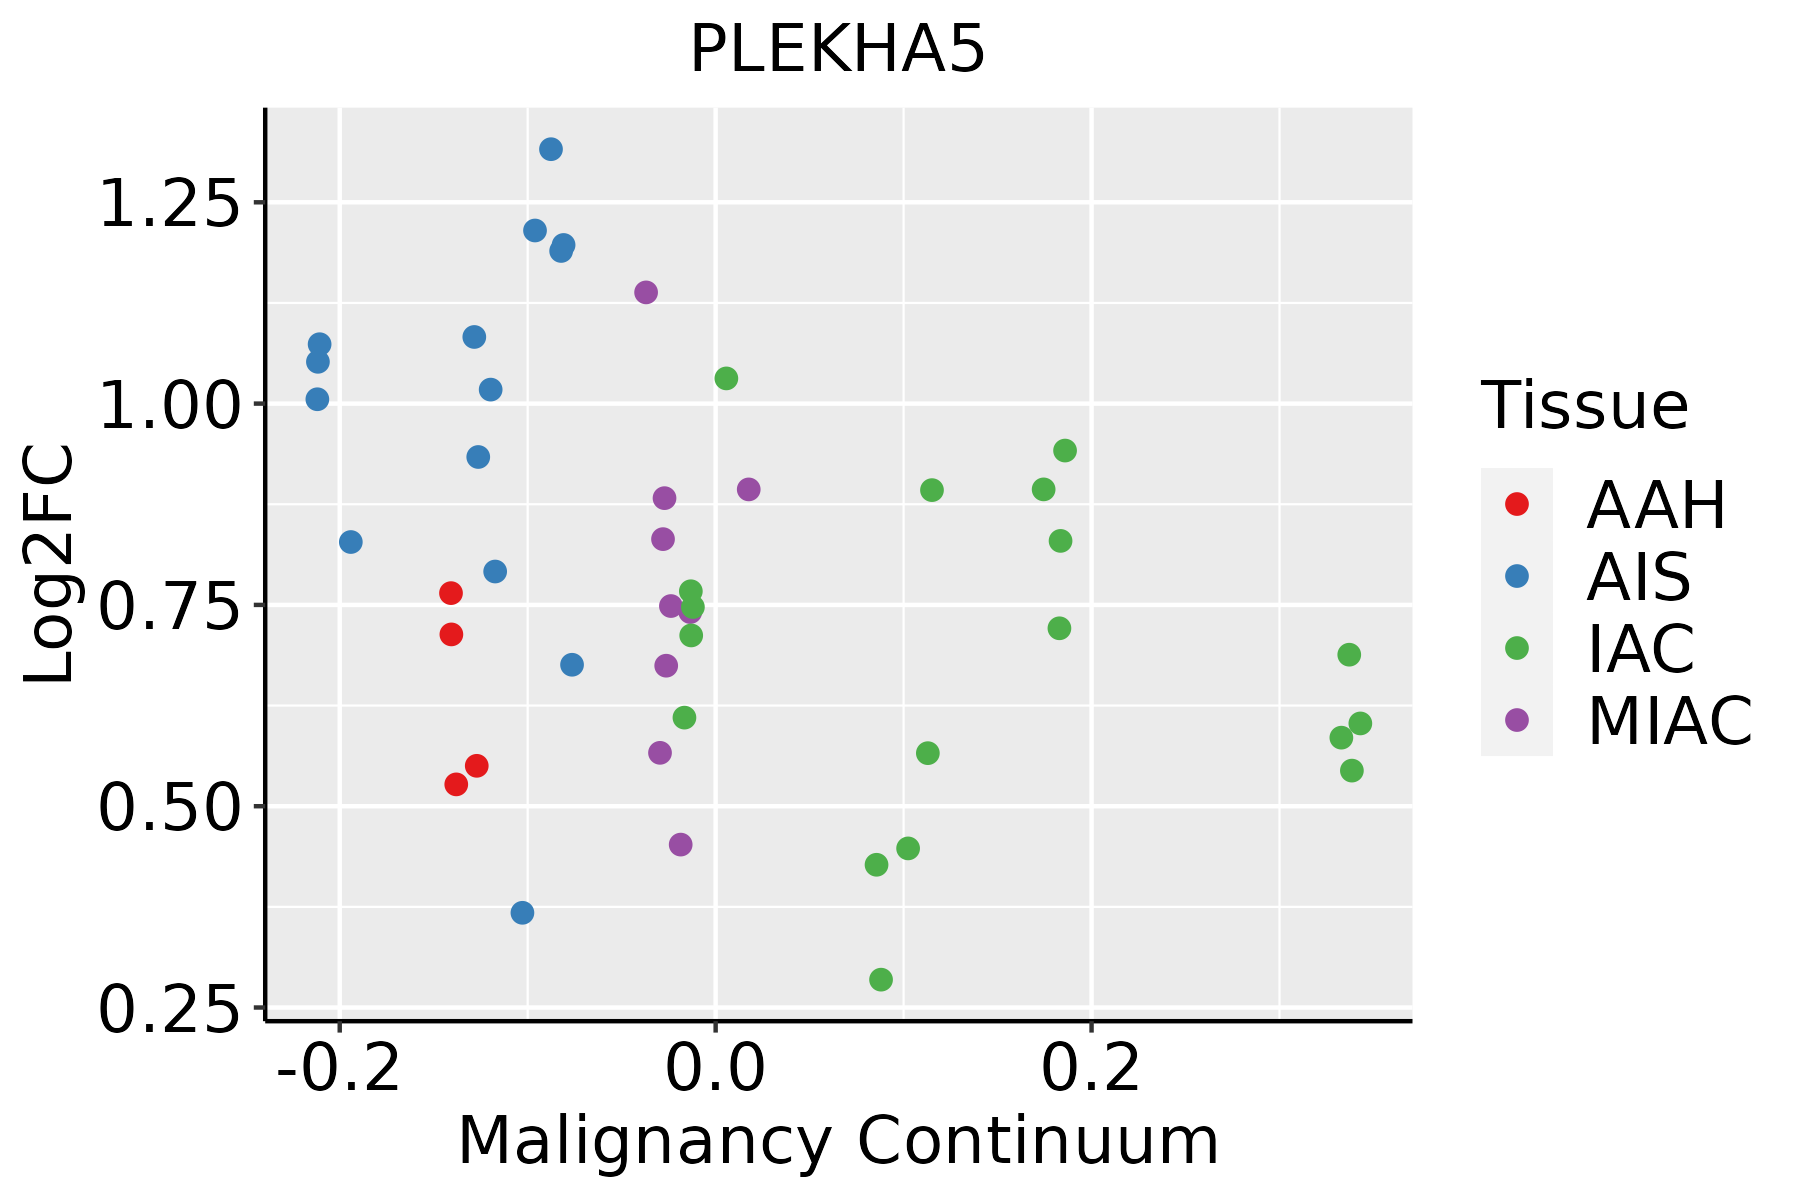 | AAH: Atypical adenomatous hyperplasia |
| AIS: Adenocarcinoma in situ | ||
| IAC: Invasive lung adenocarcinoma | ||
| MIA: Minimally invasive adenocarcinoma | ||
| Oral Cavity |  | EOLP: Erosive Oral lichen planus |
| LP: leukoplakia | ||
| NEOLP: Non-erosive oral lichen planus | ||
| OSCC: Oral squamous cell carcinoma | ||
| Prostate |  | BPH: Benign Prostatic Hyperplasia |
| Thyroid |  | ATC: Anaplastic thyroid cancer |
| HT: Hashimoto's thyroiditis | ||
| PTC: Papillary thyroid cancer |
| ∗log2FC in expression of this searched gene in stem-like cells from each diseased tissue sample relative to stem-like cells in normal samples in each tissue plotted against the malignancy continuum. Samples are colored based on if they are from different disease stage. |
Top |
Malignant transformation related pathway analysis |
| Find out the enriched GO biological processes and KEGG pathways involved in transition from healthy to precancer to cancer |
| Tissue | Disease Stage | Enriched GO biological Processes |
| Colorectum | AD |  |
| Colorectum | SER |  |
| Colorectum | MSS |  |
| Colorectum | MSI-H |  |
| Colorectum | FAP |  |
| ∗Top 15 enriched GO BP terms are showed in the bar plot of each disease state in each tissue. Each row represents a significant GO biological process which is colored according to the -log10(p.adjust). |
| Page: 1 2 3 4 5 6 7 8 9 |
| GO ID | Tissue | Disease Stage | Description | Gene Ratio | Bg Ratio | pvalue | p.adjust | Count |
| GO:00614588 | Cervix | CC | reproductive system development | 87/2311 | 427/18723 | 1.37e-06 | 4.55e-05 | 87 |
| GO:0061458 | Colorectum | AD | reproductive system development | 116/3918 | 427/18723 | 1.11e-03 | 1.01e-02 | 116 |
| GO:00614581 | Colorectum | SER | reproductive system development | 87/2897 | 427/18723 | 3.69e-03 | 3.07e-02 | 87 |
| GO:00614582 | Colorectum | MSS | reproductive system development | 115/3467 | 427/18723 | 9.86e-06 | 2.39e-04 | 115 |
| GO:00614583 | Colorectum | FAP | reproductive system development | 85/2622 | 427/18723 | 4.30e-04 | 5.13e-03 | 85 |
| GO:00614584 | Colorectum | CRC | reproductive system development | 73/2078 | 427/18723 | 1.13e-04 | 2.22e-03 | 73 |
| GO:00614589 | Endometrium | AEH | reproductive system development | 88/2100 | 427/18723 | 9.50e-09 | 6.41e-07 | 88 |
| GO:006145815 | Endometrium | EEC | reproductive system development | 91/2168 | 427/18723 | 4.54e-09 | 3.13e-07 | 91 |
| GO:006145819 | Esophagus | HGIN | reproductive system development | 78/2587 | 427/18723 | 5.53e-03 | 4.52e-02 | 78 |
| GO:0061458110 | Esophagus | ESCC | reproductive system development | 247/8552 | 427/18723 | 2.24e-07 | 3.42e-06 | 247 |
| GO:00614585 | Liver | Cirrhotic | reproductive system development | 132/4634 | 427/18723 | 2.07e-03 | 1.28e-02 | 132 |
| GO:006145811 | Liver | HCC | reproductive system development | 205/7958 | 427/18723 | 1.16e-02 | 4.27e-02 | 205 |
| GO:00614586 | Lung | IAC | reproductive system development | 79/2061 | 427/18723 | 2.39e-06 | 1.06e-04 | 79 |
| GO:006145812 | Lung | AIS | reproductive system development | 70/1849 | 427/18723 | 1.52e-05 | 5.50e-04 | 70 |
| GO:006145821 | Lung | AAH | reproductive system development | 26/613 | 427/18723 | 1.90e-03 | 4.35e-02 | 26 |
| GO:006145817 | Oral cavity | OSCC | reproductive system development | 217/7305 | 427/18723 | 3.75e-07 | 5.63e-06 | 217 |
| GO:006145824 | Oral cavity | EOLP | reproductive system development | 81/2218 | 427/18723 | 1.09e-05 | 1.93e-04 | 81 |
| GO:006145831 | Oral cavity | NEOLP | reproductive system development | 91/2005 | 427/18723 | 8.18e-11 | 9.00e-09 | 91 |
| GO:006145810 | Prostate | BPH | reproductive system development | 126/3107 | 427/18723 | 1.35e-11 | 9.95e-10 | 126 |
| GO:006145816 | Prostate | Tumor | reproductive system development | 133/3246 | 427/18723 | 1.24e-12 | 1.15e-10 | 133 |
| Page: 1 2 |
| Pathway ID | Tissue | Disease Stage | Description | Gene Ratio | Bg Ratio | pvalue | p.adjust | qvalue | Count |
| Page: 1 |
Top |
Cell-cell communication analysis |
| Identification of potential cell-cell interactions between two cell types and their ligand-receptor pairs for different disease states |
| Ligand | Receptor | LRpair | Pathway | Tissue | Disease Stage |
| Page: 1 |
Top |
Single-cell gene regulatory network inference analysis |
| Find out the significant the regulons (TFs) and the target genes of each regulon across cell types for different disease states |
| TF | Cell Type | Tissue | Disease Stage | Target Gene | RSS | Regulon Activity |
| ∗The dot plots of a searched regulon are shown for all cell subpopulations in each disease state of each tissue based on the regulon specific score inferred using pySCENIC and by calculating the average expression. |
| Page: 1 |
Top |
Somatic mutation of malignant transformation related genes |
| Annotation of somatic variants for genes involved in malignant transformation |
| Hugo Symbol | Variant Class | Variant Classification | dbSNP RS | HGVSc | HGVSp | HGVSp Short | SWISSPROT | BIOTYPE | SIFT | PolyPhen | Tumor Sample Barcode | Tissue | Histology | Sex | Age | Stage | Therapy Types | Drugs | Outcome |
| PLEKHA5 | insertion | Nonsense_Mutation | novel | c.1620_1621insTGGTAATGTTTGGTAA | p.Asp541TrpfsTer2 | p.D541Wfs*2 | Q9HAU0 | protein_coding | TCGA-FY-A4B0-01 | Thyroid | thyroid carcinoma | Male | >=65 | I/II | Hormone Therapy | synthroid | SD |
| Page: 1 2 3 4 5 6 7 8 9 10 11 12 13 14 15 16 |
Top |
Related drugs of malignant transformation related genes |
| Identification of chemicals and drugs interact with genes involved in malignant transfromation |
| (DGIdb 4.0) |
| Entrez ID | Symbol | Category | Interaction Types | Drug Claim Name | Drug Name | PMIDs |
| Page: 1 |

Copyright 2023-Present -The University of Texas Health Science Center at Houston |