
|
|||||
|
 | |
| |
| |
| |
| |
| |
|
Gene: PLA2R1 |
Gene summary for PLA2R1 |
| Gene information | Species | Human | Gene symbol | PLA2R1 | Gene ID | 22925 |
| Gene name | phospholipase A2 receptor 1 | |
| Gene Alias | CLEC13C | |
| Cytomap | 2q24.2 | |
| Gene Type | protein-coding | GO ID | GO:0001816 | UniProtAcc | Q13018 |
Top |
Malignant transformation analysis |
| Identification of the aberrant gene expression in precancerous and cancerous lesions by comparing the gene expression of stem-like cells in diseased tissues with normal stem cells |
| Entrez ID | Symbol | Replicates | Species | Organ | Tissue | Adj P-value | Log2FC | Malignancy |
| 22925 | PLA2R1 | LZE4T | Human | Esophagus | ESCC | 1.11e-23 | 8.71e-01 | 0.0811 |
| 22925 | PLA2R1 | LZE22T | Human | Esophagus | ESCC | 1.59e-02 | 1.93e-01 | 0.068 |
| 22925 | PLA2R1 | P1T-E | Human | Esophagus | ESCC | 2.47e-02 | 1.26e-01 | 0.0875 |
| 22925 | PLA2R1 | P2T-E | Human | Esophagus | ESCC | 1.21e-02 | 2.71e-02 | 0.1177 |
| 22925 | PLA2R1 | P4T-E | Human | Esophagus | ESCC | 1.60e-10 | 2.57e-01 | 0.1323 |
| 22925 | PLA2R1 | P5T-E | Human | Esophagus | ESCC | 3.73e-03 | 5.18e-02 | 0.1327 |
| 22925 | PLA2R1 | P8T-E | Human | Esophagus | ESCC | 3.49e-06 | 1.36e-01 | 0.0889 |
| 22925 | PLA2R1 | P9T-E | Human | Esophagus | ESCC | 2.75e-04 | 7.71e-02 | 0.1131 |
| 22925 | PLA2R1 | P10T-E | Human | Esophagus | ESCC | 3.67e-05 | 1.63e-01 | 0.116 |
| 22925 | PLA2R1 | P11T-E | Human | Esophagus | ESCC | 9.31e-11 | 6.58e-01 | 0.1426 |
| 22925 | PLA2R1 | P12T-E | Human | Esophagus | ESCC | 2.69e-28 | 6.38e-01 | 0.1122 |
| 22925 | PLA2R1 | P15T-E | Human | Esophagus | ESCC | 9.43e-17 | 4.90e-01 | 0.1149 |
| 22925 | PLA2R1 | P16T-E | Human | Esophagus | ESCC | 6.09e-06 | 9.47e-02 | 0.1153 |
| 22925 | PLA2R1 | P17T-E | Human | Esophagus | ESCC | 4.68e-02 | 2.11e-01 | 0.1278 |
| 22925 | PLA2R1 | P20T-E | Human | Esophagus | ESCC | 6.95e-19 | 2.61e-01 | 0.1124 |
| 22925 | PLA2R1 | P21T-E | Human | Esophagus | ESCC | 1.36e-13 | 2.07e-01 | 0.1617 |
| 22925 | PLA2R1 | P22T-E | Human | Esophagus | ESCC | 2.62e-11 | 1.43e-01 | 0.1236 |
| 22925 | PLA2R1 | P23T-E | Human | Esophagus | ESCC | 2.67e-05 | 2.91e-01 | 0.108 |
| 22925 | PLA2R1 | P24T-E | Human | Esophagus | ESCC | 2.11e-11 | 4.41e-02 | 0.1287 |
| 22925 | PLA2R1 | P26T-E | Human | Esophagus | ESCC | 6.41e-25 | 4.89e-01 | 0.1276 |
| Page: 1 2 3 4 |
| Tissue | Expression Dynamics | Abbreviation |
| Esophagus | 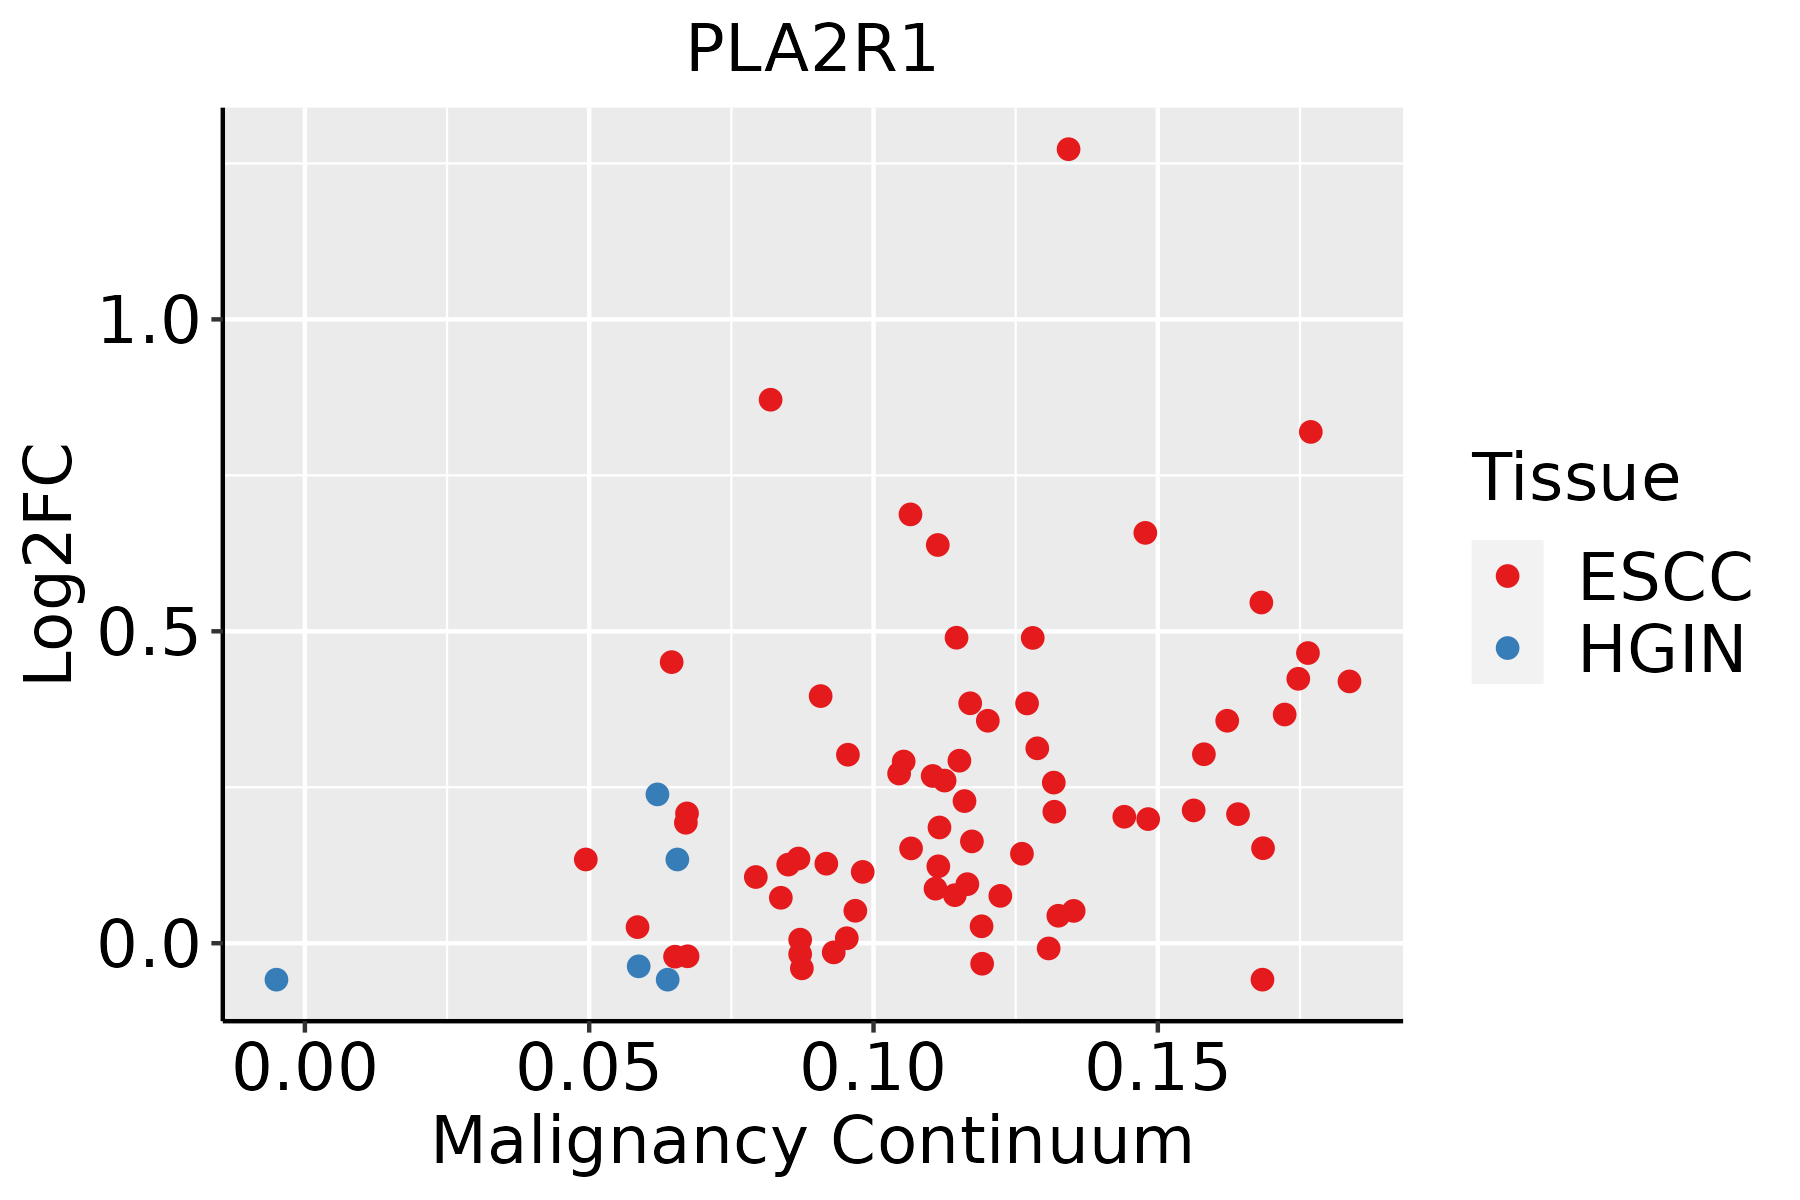 | ESCC: Esophageal squamous cell carcinoma |
| HGIN: High-grade intraepithelial neoplasias | ||
| LGIN: Low-grade intraepithelial neoplasias | ||
| Thyroid | 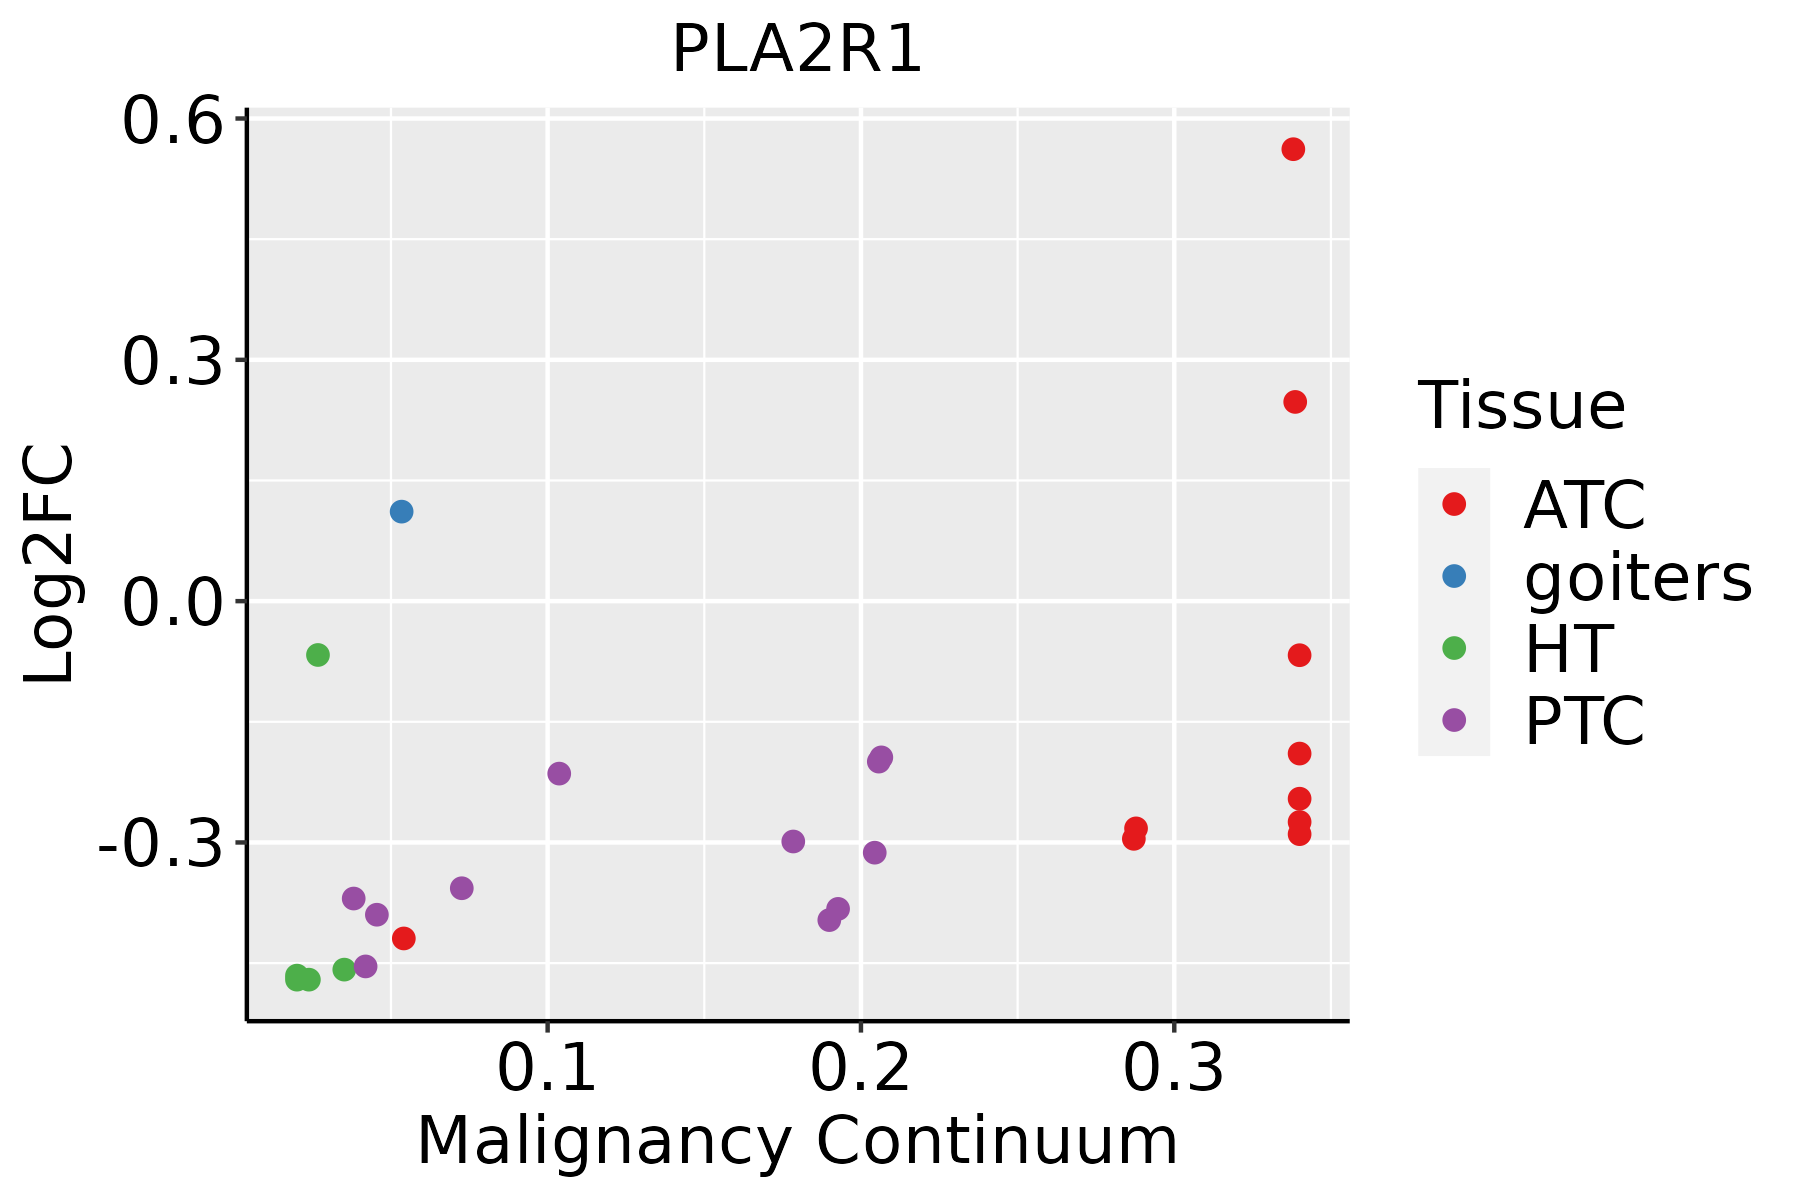 | ATC: Anaplastic thyroid cancer |
| HT: Hashimoto's thyroiditis | ||
| PTC: Papillary thyroid cancer |
| ∗log2FC in expression of this searched gene in stem-like cells from each diseased tissue sample relative to stem-like cells in normal samples in each tissue plotted against the malignancy continuum. Samples are colored based on if they are from different disease stage. |
Top |
Malignant transformation related pathway analysis |
| Find out the enriched GO biological processes and KEGG pathways involved in transition from healthy to precancer to cancer |
| Tissue | Disease Stage | Enriched GO biological Processes |
| Colorectum | AD |  |
| Colorectum | SER |  |
| Colorectum | MSS |  |
| Colorectum | MSI-H |  |
| Colorectum | FAP |  |
| ∗Top 15 enriched GO BP terms are showed in the bar plot of each disease state in each tissue. Each row represents a significant GO biological process which is colored according to the -log10(p.adjust). |
| Page: 1 2 3 4 5 6 7 8 9 |
| GO ID | Tissue | Disease Stage | Description | Gene Ratio | Bg Ratio | pvalue | p.adjust | Count |
| GO:0006979111 | Esophagus | ESCC | response to oxidative stress | 303/8552 | 446/18723 | 7.15e-22 | 1.30e-19 | 303 |
| GO:0062197111 | Esophagus | ESCC | cellular response to chemical stress | 234/8552 | 337/18723 | 5.37e-19 | 5.97e-17 | 234 |
| GO:0034599111 | Esophagus | ESCC | cellular response to oxidative stress | 197/8552 | 288/18723 | 3.76e-15 | 2.15e-13 | 197 |
| GO:0072331111 | Esophagus | ESCC | signal transduction by p53 class mediator | 121/8552 | 163/18723 | 9.61e-14 | 4.69e-12 | 121 |
| GO:2001020110 | Esophagus | ESCC | regulation of response to DNA damage stimulus | 145/8552 | 219/18723 | 5.97e-10 | 1.50e-08 | 145 |
| GO:004277014 | Esophagus | ESCC | signal transduction in response to DNA damage | 117/8552 | 172/18723 | 2.38e-09 | 5.32e-08 | 117 |
| GO:1901796111 | Esophagus | ESCC | regulation of signal transduction by p53 class mediator | 70/8552 | 93/18723 | 5.69e-09 | 1.18e-07 | 70 |
| GO:000756820 | Esophagus | ESCC | aging | 201/8552 | 339/18723 | 2.64e-07 | 3.94e-06 | 201 |
| GO:0030330110 | Esophagus | ESCC | DNA damage response, signal transduction by p53 class mediator | 53/8552 | 72/18723 | 1.34e-06 | 1.63e-05 | 53 |
| GO:20010228 | Esophagus | ESCC | positive regulation of response to DNA damage stimulus | 69/8552 | 105/18723 | 2.66e-05 | 2.22e-04 | 69 |
| GO:000689818 | Esophagus | ESCC | receptor-mediated endocytosis | 142/8552 | 244/18723 | 5.22e-05 | 4.05e-04 | 142 |
| GO:0051346110 | Esophagus | ESCC | negative regulation of hydrolase activity | 208/8552 | 379/18723 | 1.76e-04 | 1.14e-03 | 208 |
| GO:007259318 | Esophagus | ESCC | reactive oxygen species metabolic process | 137/8552 | 239/18723 | 1.82e-04 | 1.16e-03 | 137 |
| GO:00075699 | Esophagus | ESCC | cell aging | 81/8552 | 132/18723 | 2.00e-04 | 1.27e-03 | 81 |
| GO:000181916 | Esophagus | ESCC | positive regulation of cytokine production | 244/8552 | 467/18723 | 2.29e-03 | 1.01e-02 | 244 |
| GO:1901798111 | Esophagus | ESCC | positive regulation of signal transduction by p53 class mediator | 18/8552 | 25/18723 | 7.04e-03 | 2.56e-02 | 18 |
| GO:004351615 | Esophagus | ESCC | regulation of DNA damage response, signal transduction by p53 class mediator | 23/8552 | 34/18723 | 8.06e-03 | 2.86e-02 | 23 |
| GO:00903984 | Esophagus | ESCC | cellular senescence | 54/8552 | 93/18723 | 1.08e-02 | 3.67e-02 | 54 |
| GO:19040197 | Esophagus | ESCC | epithelial cell apoptotic process | 68/8552 | 121/18723 | 1.27e-02 | 4.21e-02 | 68 |
| GO:000697930 | Thyroid | HT | response to oxidative stress | 81/1272 | 446/18723 | 2.53e-16 | 1.17e-13 | 81 |
| Page: 1 2 3 4 |
| Pathway ID | Tissue | Disease Stage | Description | Gene Ratio | Bg Ratio | pvalue | p.adjust | qvalue | Count |
| hsa0414530 | Esophagus | ESCC | Phagosome | 100/4205 | 152/8465 | 3.81e-05 | 1.72e-04 | 8.82e-05 | 100 |
| hsa051527 | Esophagus | ESCC | Tuberculosis | 111/4205 | 180/8465 | 7.14e-04 | 2.32e-03 | 1.19e-03 | 111 |
| hsa04145114 | Esophagus | ESCC | Phagosome | 100/4205 | 152/8465 | 3.81e-05 | 1.72e-04 | 8.82e-05 | 100 |
| hsa0515212 | Esophagus | ESCC | Tuberculosis | 111/4205 | 180/8465 | 7.14e-04 | 2.32e-03 | 1.19e-03 | 111 |
| Page: 1 |
Top |
Cell-cell communication analysis |
| Identification of potential cell-cell interactions between two cell types and their ligand-receptor pairs for different disease states |
| Ligand | Receptor | LRpair | Pathway | Tissue | Disease Stage |
| Page: 1 |
Top |
Single-cell gene regulatory network inference analysis |
| Find out the significant the regulons (TFs) and the target genes of each regulon across cell types for different disease states |
| TF | Cell Type | Tissue | Disease Stage | Target Gene | RSS | Regulon Activity |
| ∗The dot plots of a searched regulon are shown for all cell subpopulations in each disease state of each tissue based on the regulon specific score inferred using pySCENIC and by calculating the average expression. |
| Page: 1 |
Top |
Somatic mutation of malignant transformation related genes |
| Annotation of somatic variants for genes involved in malignant transformation |
| Hugo Symbol | Variant Class | Variant Classification | dbSNP RS | HGVSc | HGVSp | HGVSp Short | SWISSPROT | BIOTYPE | SIFT | PolyPhen | Tumor Sample Barcode | Tissue | Histology | Sex | Age | Stage | Therapy Types | Drugs | Outcome |
| PLA2R1 | SNV | Missense_Mutation | c.1568G>T | p.Gly523Val | p.G523V | Q13018 | protein_coding | deleterious(0) | probably_damaging(0.929) | TCGA-IM-A3EB-01 | Thyroid | thyroid carcinoma | Female | <65 | I/II | Unknown | Unknown | SD | |
| PLA2R1 | insertion | Frame_Shift_Ins | novel | c.1899_1900insATTAAAATAG | p.Cys634IlefsTer8 | p.C634Ifs*8 | Q13018 | protein_coding | TCGA-FY-A4B0-01 | Thyroid | thyroid carcinoma | Male | >=65 | I/II | Hormone Therapy | synthroid | SD |
| Page: 1 2 3 4 5 6 7 8 9 10 11 12 13 14 15 16 |
Top |
Related drugs of malignant transformation related genes |
| Identification of chemicals and drugs interact with genes involved in malignant transfromation |
| (DGIdb 4.0) |
| Entrez ID | Symbol | Category | Interaction Types | Drug Claim Name | Drug Name | PMIDs |
| Page: 1 |

Copyright 2023-Present -The University of Texas Health Science Center at Houston |