
|
|||||
|
 | |
| |
| |
| |
| |
| |
|
Gene: NKTR |
Gene summary for NKTR |
| Gene information | Species | Human | Gene symbol | NKTR | Gene ID | 4820 |
| Gene name | natural killer cell triggering receptor | |
| Gene Alias | p104 | |
| Cytomap | 3p22.1 | |
| Gene Type | protein-coding | GO ID | GO:0000413 | UniProtAcc | A0A024R2N6 |
Top |
Malignant transformation analysis |
| Identification of the aberrant gene expression in precancerous and cancerous lesions by comparing the gene expression of stem-like cells in diseased tissues with normal stem cells |
| Entrez ID | Symbol | Replicates | Species | Organ | Tissue | Adj P-value | Log2FC | Malignancy |
| 4820 | NKTR | GSM4909281 | Human | Breast | IDC | 7.16e-09 | 3.92e-01 | 0.21 |
| 4820 | NKTR | GSM4909292 | Human | Breast | IDC | 4.81e-03 | 6.62e-01 | 0.1236 |
| 4820 | NKTR | GSM4909294 | Human | Breast | IDC | 3.90e-02 | -2.55e-01 | 0.2022 |
| 4820 | NKTR | GSM4909296 | Human | Breast | IDC | 1.26e-12 | -3.20e-01 | 0.1524 |
| 4820 | NKTR | GSM4909297 | Human | Breast | IDC | 3.83e-08 | -2.38e-01 | 0.1517 |
| 4820 | NKTR | GSM4909309 | Human | Breast | IDC | 3.74e-02 | -1.56e-01 | 0.0483 |
| 4820 | NKTR | GSM4909311 | Human | Breast | IDC | 1.03e-23 | -3.11e-01 | 0.1534 |
| 4820 | NKTR | GSM4909312 | Human | Breast | IDC | 6.48e-08 | -1.82e-01 | 0.1552 |
| 4820 | NKTR | GSM4909319 | Human | Breast | IDC | 1.12e-23 | -3.94e-01 | 0.1563 |
| 4820 | NKTR | GSM4909320 | Human | Breast | IDC | 3.22e-08 | -3.43e-01 | 0.1575 |
| 4820 | NKTR | GSM4909321 | Human | Breast | IDC | 9.68e-13 | -2.70e-01 | 0.1559 |
| 4820 | NKTR | M1 | Human | Breast | IDC | 2.23e-06 | 5.13e-01 | 0.1577 |
| 4820 | NKTR | NCCBC14 | Human | Breast | DCIS | 3.20e-09 | -2.07e-01 | 0.2021 |
| 4820 | NKTR | NCCBC5 | Human | Breast | DCIS | 6.36e-12 | -3.21e-01 | 0.2046 |
| 4820 | NKTR | P1 | Human | Breast | IDC | 1.99e-21 | 2.88e-01 | 0.1527 |
| 4820 | NKTR | P2 | Human | Breast | IDC | 1.35e-02 | -2.82e-01 | 0.21 |
| 4820 | NKTR | DCIS2 | Human | Breast | DCIS | 4.85e-53 | 4.10e-01 | 0.0085 |
| 4820 | NKTR | HTA11_3410_2000001011 | Human | Colorectum | AD | 5.08e-38 | -9.77e-01 | 0.0155 |
| 4820 | NKTR | HTA11_2487_2000001011 | Human | Colorectum | SER | 1.88e-21 | -9.09e-01 | -0.1808 |
| 4820 | NKTR | HTA11_2951_2000001011 | Human | Colorectum | AD | 2.73e-08 | -1.08e+00 | 0.0216 |
| Page: 1 2 3 4 5 6 7 8 9 10 11 12 13 |
| Tissue | Expression Dynamics | Abbreviation |
| Breast | 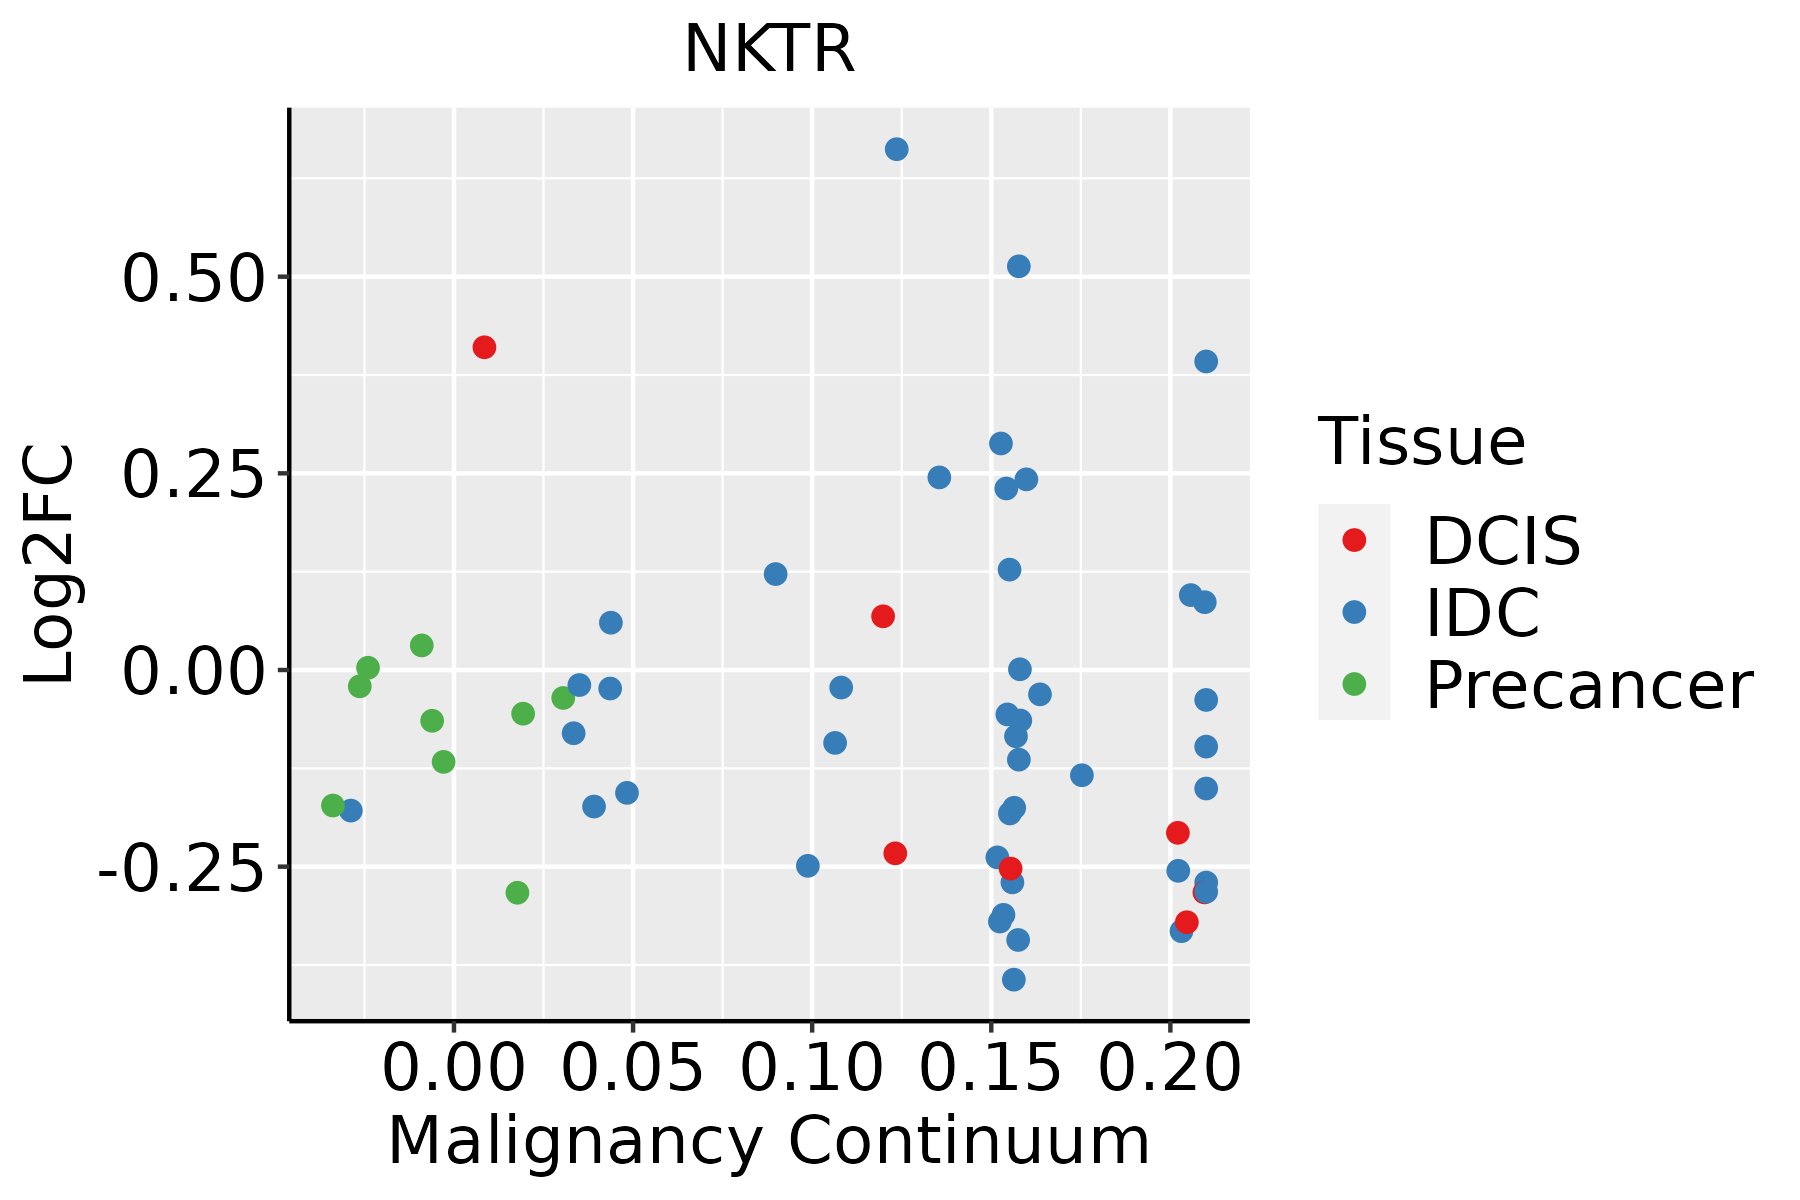 | IDC: Invasive ductal carcinoma |
| DCIS: Ductal carcinoma in situ | ||
| Precancer(BRCA1-mut): Precancerous lesion from BRCA1 mutation carriers | ||
| Colorectum (GSE201348) |  | FAP: Familial adenomatous polyposis |
| CRC: Colorectal cancer | ||
| Colorectum (HTA11) |  | AD: Adenomas |
| SER: Sessile serrated lesions | ||
| MSI-H: Microsatellite-high colorectal cancer | ||
| MSS: Microsatellite stable colorectal cancer | ||
| Endometrium |  | AEH: Atypical endometrial hyperplasia |
| EEC: Endometrioid Cancer | ||
| Esophagus |  | ESCC: Esophageal squamous cell carcinoma |
| HGIN: High-grade intraepithelial neoplasias | ||
| LGIN: Low-grade intraepithelial neoplasias | ||
| Liver | 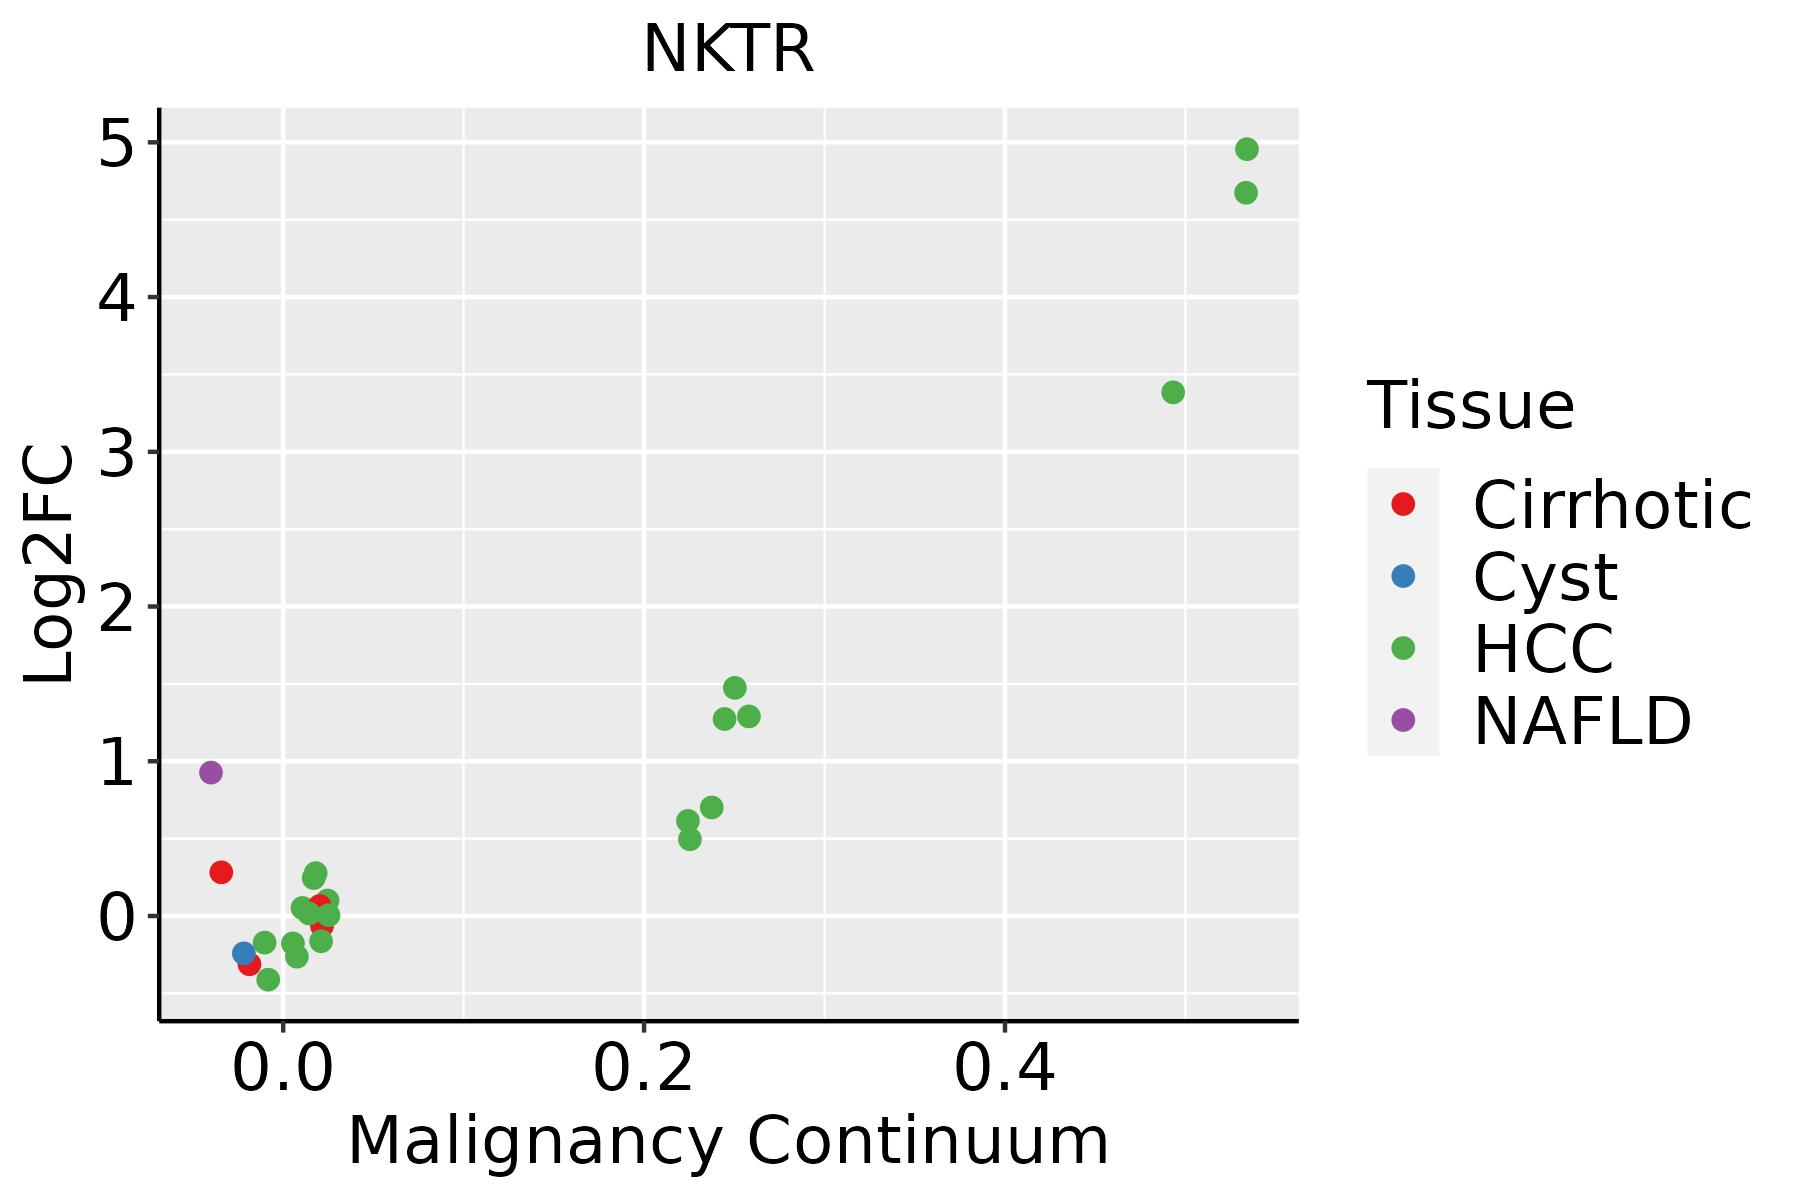 | HCC: Hepatocellular carcinoma |
| NAFLD: Non-alcoholic fatty liver disease | ||
| Lung | 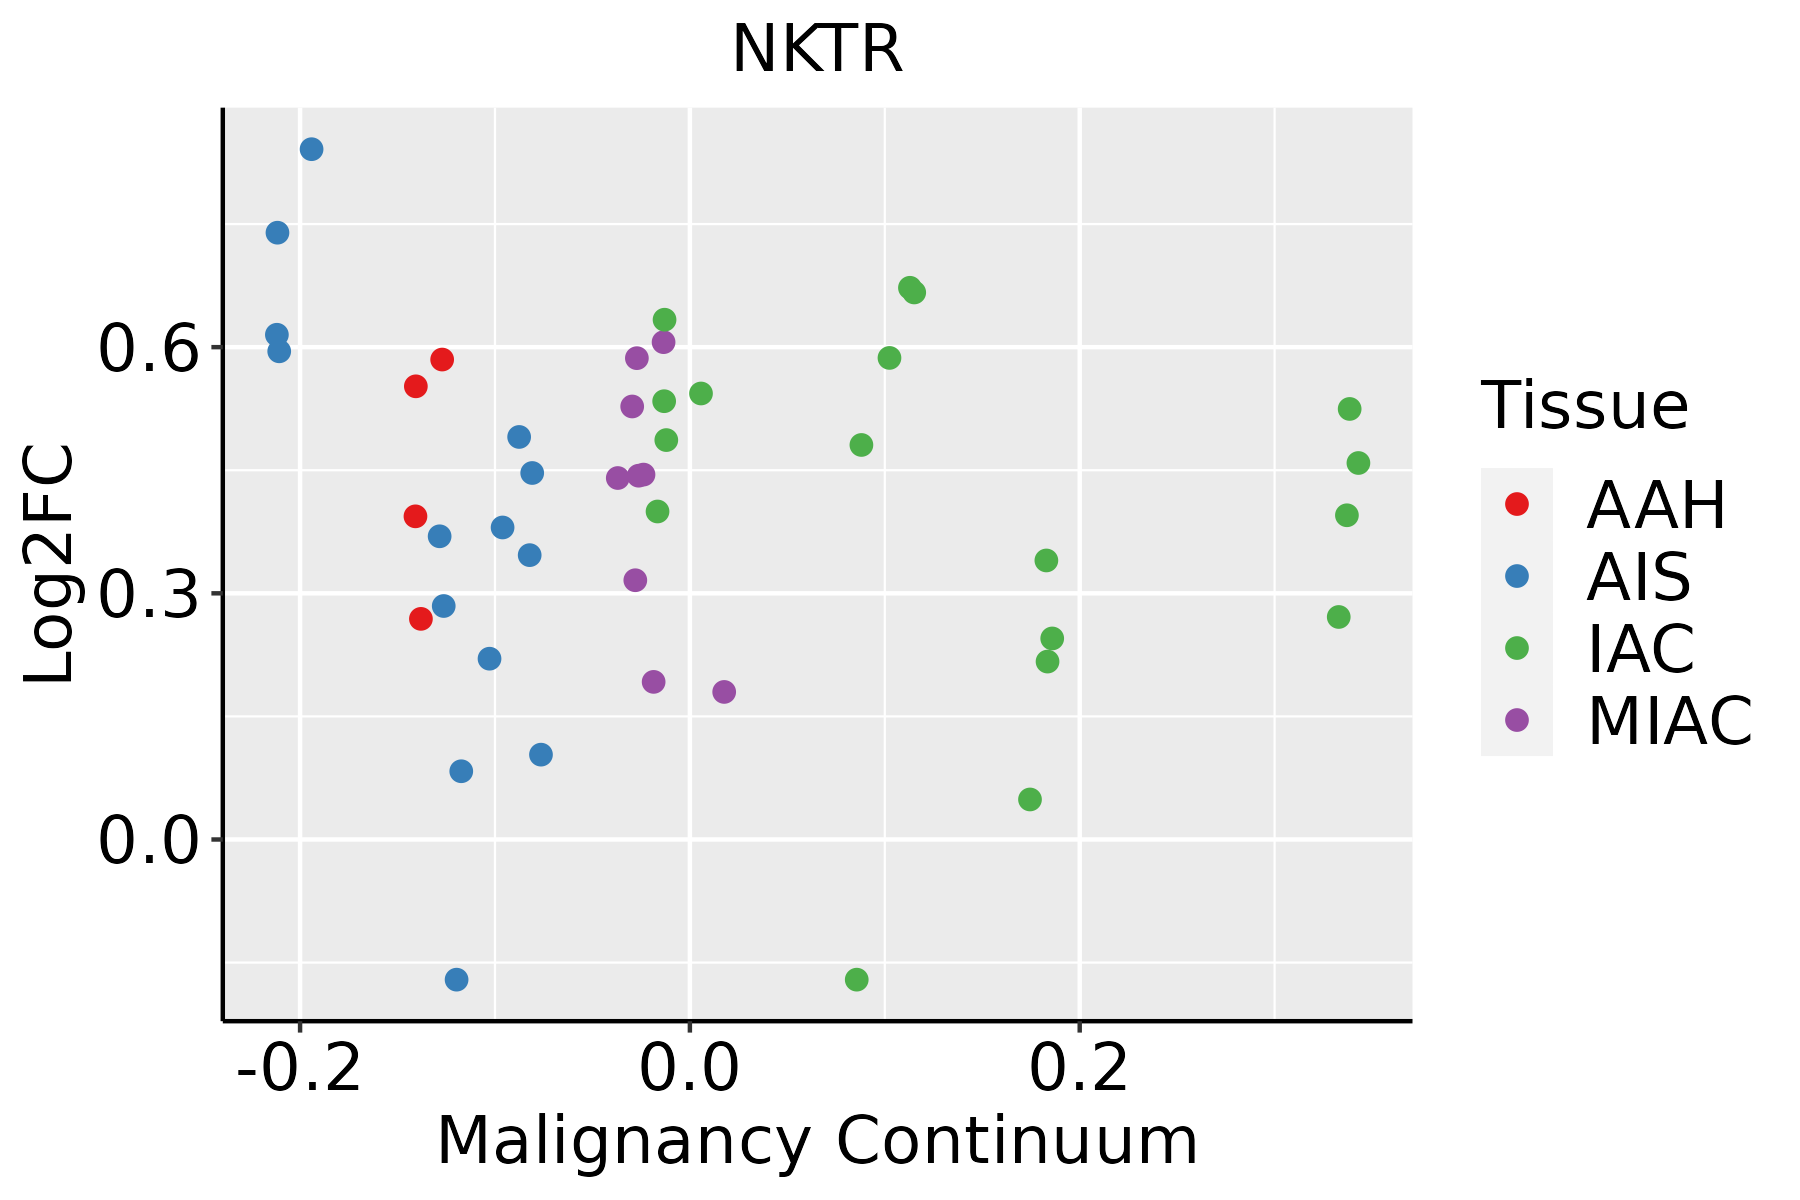 | AAH: Atypical adenomatous hyperplasia |
| AIS: Adenocarcinoma in situ | ||
| IAC: Invasive lung adenocarcinoma | ||
| MIA: Minimally invasive adenocarcinoma | ||
| Oral Cavity | 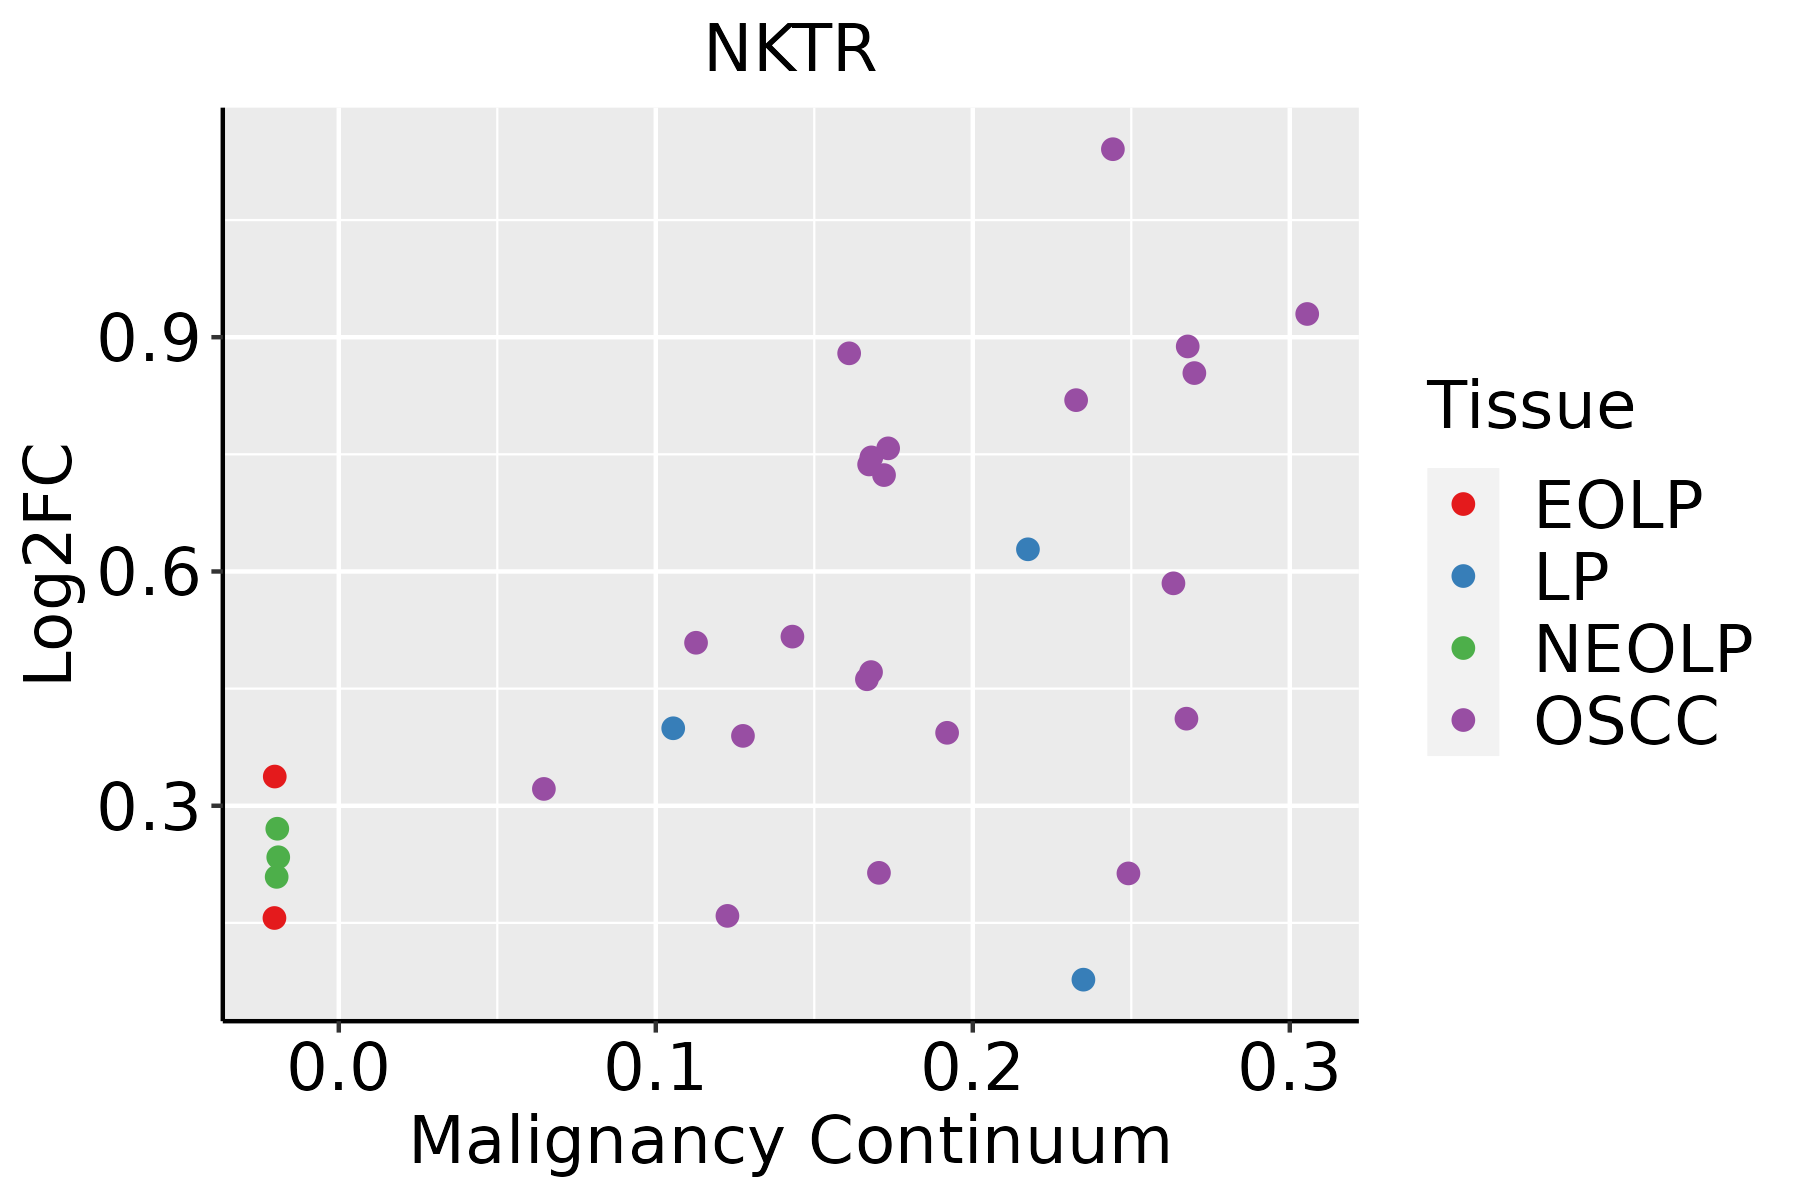 | EOLP: Erosive Oral lichen planus |
| LP: leukoplakia | ||
| NEOLP: Non-erosive oral lichen planus | ||
| OSCC: Oral squamous cell carcinoma | ||
| Prostate |  | BPH: Benign Prostatic Hyperplasia |
| Skin | 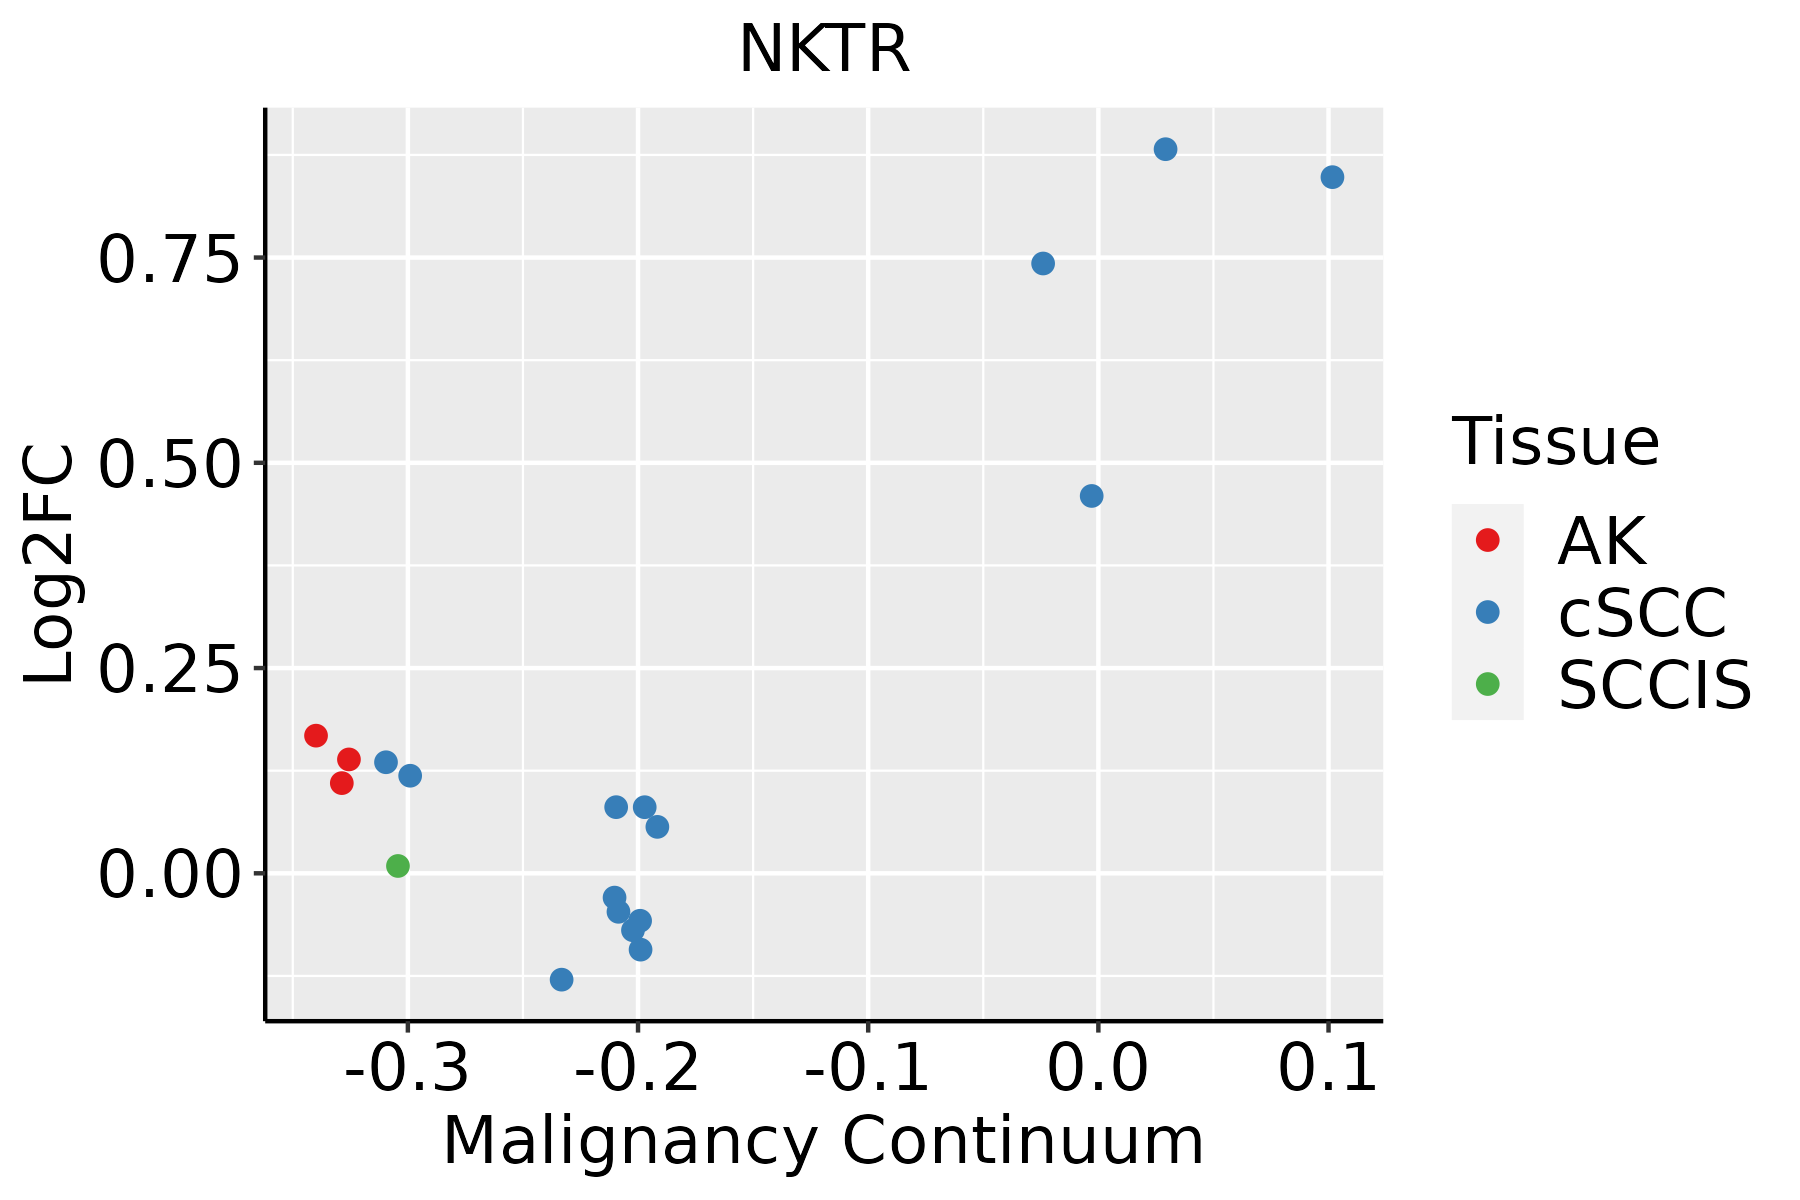 | AK: Actinic keratosis |
| cSCC: Cutaneous squamous cell carcinoma | ||
| SCCIS:squamous cell carcinoma in situ | ||
| Thyroid | 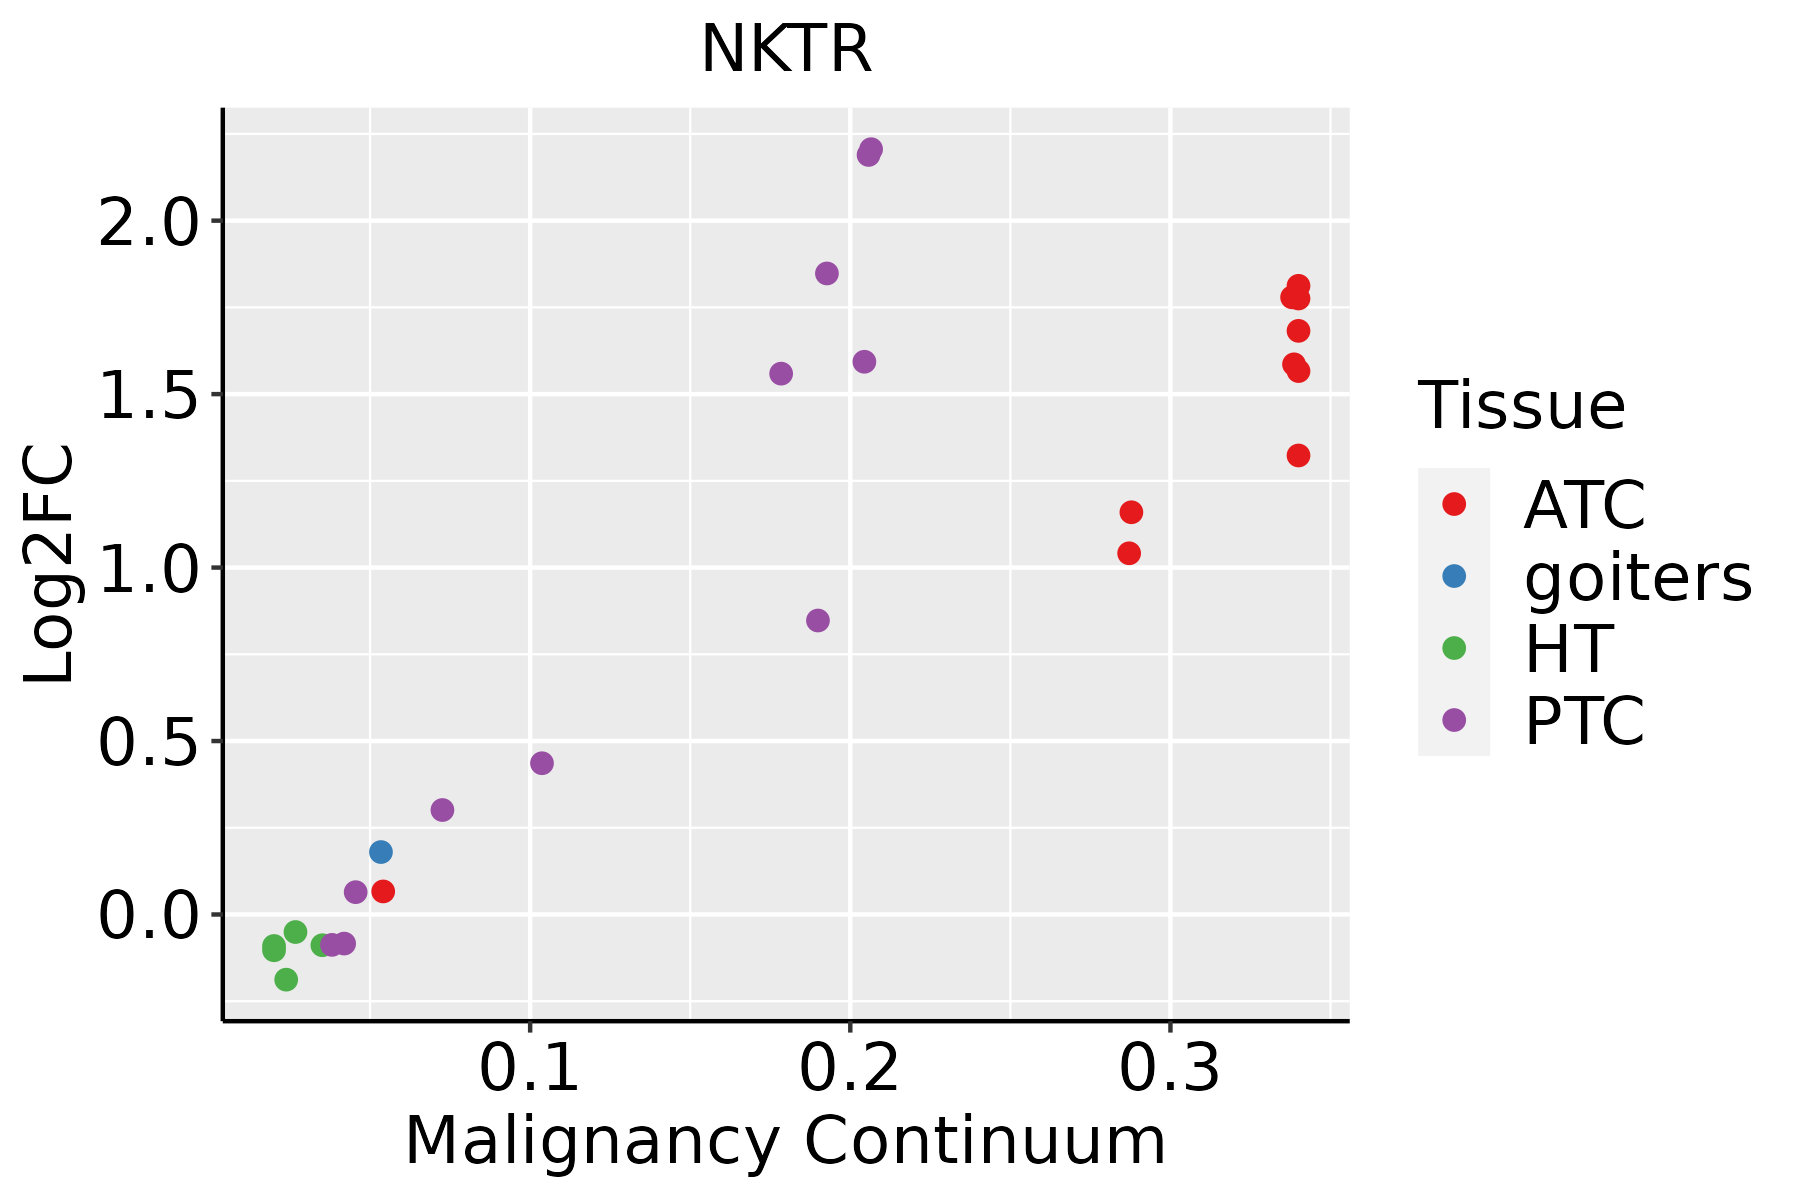 | ATC: Anaplastic thyroid cancer |
| HT: Hashimoto's thyroiditis | ||
| PTC: Papillary thyroid cancer |
| ∗log2FC in expression of this searched gene in stem-like cells from each diseased tissue sample relative to stem-like cells in normal samples in each tissue plotted against the malignancy continuum. Samples are colored based on if they are from different disease stage. |
Top |
Malignant transformation related pathway analysis |
| Find out the enriched GO biological processes and KEGG pathways involved in transition from healthy to precancer to cancer |
| Tissue | Disease Stage | Enriched GO biological Processes |
| Colorectum | AD |  |
| Colorectum | SER |  |
| Colorectum | MSS |  |
| Colorectum | MSI-H |  |
| Colorectum | FAP |  |
| ∗Top 15 enriched GO BP terms are showed in the bar plot of each disease state in each tissue. Each row represents a significant GO biological process which is colored according to the -log10(p.adjust). |
| Page: 1 2 3 4 5 6 7 8 9 |
| GO ID | Tissue | Disease Stage | Description | Gene Ratio | Bg Ratio | pvalue | p.adjust | Count |
| GO:000645713 | Breast | IDC | protein folding | 47/1434 | 212/18723 | 2.31e-11 | 3.86e-09 | 47 |
| GO:001820812 | Breast | IDC | peptidyl-proline modification | 13/1434 | 58/18723 | 3.59e-04 | 5.18e-03 | 13 |
| GO:000645723 | Breast | DCIS | protein folding | 47/1390 | 212/18723 | 7.84e-12 | 1.53e-09 | 47 |
| GO:001820821 | Breast | DCIS | peptidyl-proline modification | 13/1390 | 58/18723 | 2.65e-04 | 4.03e-03 | 13 |
| GO:0006457 | Colorectum | AD | protein folding | 73/3918 | 212/18723 | 3.24e-06 | 9.10e-05 | 73 |
| GO:00064571 | Colorectum | SER | protein folding | 54/2897 | 212/18723 | 1.04e-04 | 2.18e-03 | 54 |
| GO:00064572 | Colorectum | MSS | protein folding | 71/3467 | 212/18723 | 1.25e-07 | 5.91e-06 | 71 |
| GO:00064574 | Colorectum | FAP | protein folding | 44/2622 | 212/18723 | 4.36e-03 | 2.98e-02 | 44 |
| GO:000645715 | Endometrium | EEC | protein folding | 63/2168 | 212/18723 | 6.82e-13 | 1.40e-10 | 63 |
| GO:000041311 | Endometrium | EEC | protein peptidyl-prolyl isomerization | 14/2168 | 42/18723 | 1.69e-04 | 2.10e-03 | 14 |
| GO:001820813 | Endometrium | EEC | peptidyl-proline modification | 17/2168 | 58/18723 | 2.11e-04 | 2.54e-03 | 17 |
| GO:000645720 | Esophagus | HGIN | protein folding | 75/2587 | 212/18723 | 1.61e-15 | 3.86e-13 | 75 |
| GO:00182089 | Esophagus | HGIN | peptidyl-proline modification | 17/2587 | 58/18723 | 1.64e-03 | 1.82e-02 | 17 |
| GO:00004135 | Esophagus | HGIN | protein peptidyl-prolyl isomerization | 13/2587 | 42/18723 | 3.32e-03 | 3.12e-02 | 13 |
| GO:0006457110 | Esophagus | ESCC | protein folding | 163/8552 | 212/18723 | 1.13e-20 | 1.74e-18 | 163 |
| GO:001820816 | Esophagus | ESCC | peptidyl-proline modification | 46/8552 | 58/18723 | 1.59e-07 | 2.51e-06 | 46 |
| GO:000041313 | Esophagus | ESCC | protein peptidyl-prolyl isomerization | 32/8552 | 42/18723 | 5.52e-05 | 4.27e-04 | 32 |
| GO:00064577 | Liver | Cirrhotic | protein folding | 114/4634 | 212/18723 | 9.23e-20 | 2.31e-17 | 114 |
| GO:00182084 | Liver | Cirrhotic | peptidyl-proline modification | 26/4634 | 58/18723 | 6.65e-04 | 5.04e-03 | 26 |
| GO:00004132 | Liver | Cirrhotic | protein peptidyl-prolyl isomerization | 19/4634 | 42/18723 | 3.00e-03 | 1.71e-02 | 19 |
| Page: 1 2 3 |
| Pathway ID | Tissue | Disease Stage | Description | Gene Ratio | Bg Ratio | pvalue | p.adjust | qvalue | Count |
| Page: 1 |
Top |
Cell-cell communication analysis |
| Identification of potential cell-cell interactions between two cell types and their ligand-receptor pairs for different disease states |
| Ligand | Receptor | LRpair | Pathway | Tissue | Disease Stage |
| Page: 1 |
Top |
Single-cell gene regulatory network inference analysis |
| Find out the significant the regulons (TFs) and the target genes of each regulon across cell types for different disease states |
| TF | Cell Type | Tissue | Disease Stage | Target Gene | RSS | Regulon Activity |
| ∗The dot plots of a searched regulon are shown for all cell subpopulations in each disease state of each tissue based on the regulon specific score inferred using pySCENIC and by calculating the average expression. |
| Page: 1 |
Top |
Somatic mutation of malignant transformation related genes |
| Annotation of somatic variants for genes involved in malignant transformation |
| Hugo Symbol | Variant Class | Variant Classification | dbSNP RS | HGVSc | HGVSp | HGVSp Short | SWISSPROT | BIOTYPE | SIFT | PolyPhen | Tumor Sample Barcode | Tissue | Histology | Sex | Age | Stage | Therapy Types | Drugs | Outcome |
| NKTR | insertion | In_Frame_Ins | novel | c.1130_1131insCAATCTCAGATC | p.Pro377_Pro378insAsnLeuArgSer | p.P377_P378insNLRS | P30414 | protein_coding | TCGA-FY-A4B0-01 | Thyroid | thyroid carcinoma | Male | >=65 | I/II | Hormone Therapy | synthroid | SD | ||
| NKTR | insertion | In_Frame_Ins | novel | c.4265_4266insCATGAGGATATA | p.Ser1422_Tyr1423insMetArgIleTyr | p.S1422_Y1423insMRIY | P30414 | protein_coding | TCGA-FY-A4B0-01 | Thyroid | thyroid carcinoma | Male | >=65 | I/II | Hormone Therapy | synthroid | SD |
| Page: 1 2 3 4 5 6 7 8 9 10 11 12 13 14 15 16 |
Top |
Related drugs of malignant transformation related genes |
| Identification of chemicals and drugs interact with genes involved in malignant transfromation |
| (DGIdb 4.0) |
| Entrez ID | Symbol | Category | Interaction Types | Drug Claim Name | Drug Name | PMIDs |
| Page: 1 |

Copyright 2023-Present -The University of Texas Health Science Center at Houston |