
|
|||||
|
 | |
| |
| |
| |
| |
| |
|
Gene: TSC2 |
Gene summary for TSC2 |
| Gene information | Species | Human | Gene symbol | TSC2 | Gene ID | 7249 |
| Gene name | TSC complex subunit 2 | |
| Gene Alias | LAM | |
| Cytomap | 16p13.3 | |
| Gene Type | protein-coding | GO ID | GO:0000422 | UniProtAcc | P49815 |
Top |
Malignant transformation analysis |
| Identification of the aberrant gene expression in precancerous and cancerous lesions by comparing the gene expression of stem-like cells in diseased tissues with normal stem cells |
| Entrez ID | Symbol | Replicates | Species | Organ | Tissue | Adj P-value | Log2FC | Malignancy |
| 7249 | TSC2 | HTA11_2487_2000001011 | Human | Colorectum | SER | 3.22e-04 | 3.89e-01 | -0.1808 |
| 7249 | TSC2 | HTA11_2951_2000001011 | Human | Colorectum | AD | 2.15e-02 | 5.45e-01 | 0.0216 |
| 7249 | TSC2 | HTA11_1938_2000001011 | Human | Colorectum | AD | 2.78e-08 | 5.31e-01 | -0.0811 |
| 7249 | TSC2 | HTA11_78_2000001011 | Human | Colorectum | AD | 4.27e-02 | 2.95e-01 | -0.1088 |
| 7249 | TSC2 | HTA11_347_2000001011 | Human | Colorectum | AD | 1.47e-14 | 4.67e-01 | -0.1954 |
| 7249 | TSC2 | HTA11_3361_2000001011 | Human | Colorectum | AD | 6.02e-07 | 4.47e-01 | -0.1207 |
| 7249 | TSC2 | HTA11_83_2000001011 | Human | Colorectum | SER | 7.62e-04 | 4.44e-01 | -0.1526 |
| 7249 | TSC2 | HTA11_696_2000001011 | Human | Colorectum | AD | 3.16e-16 | 5.84e-01 | -0.1464 |
| 7249 | TSC2 | HTA11_866_2000001011 | Human | Colorectum | AD | 6.11e-08 | 4.20e-01 | -0.1001 |
| 7249 | TSC2 | HTA11_1391_2000001011 | Human | Colorectum | AD | 2.94e-04 | 3.36e-01 | -0.059 |
| 7249 | TSC2 | HTA11_546_2000001011 | Human | Colorectum | AD | 8.29e-05 | 4.50e-01 | -0.0842 |
| 7249 | TSC2 | HTA11_866_3004761011 | Human | Colorectum | AD | 1.09e-08 | 4.20e-01 | 0.096 |
| 7249 | TSC2 | HTA11_10711_2000001011 | Human | Colorectum | AD | 6.30e-08 | 5.13e-01 | 0.0338 |
| 7249 | TSC2 | HTA11_7696_3000711011 | Human | Colorectum | AD | 1.92e-12 | 4.93e-01 | 0.0674 |
| 7249 | TSC2 | HTA11_6818_2000001011 | Human | Colorectum | AD | 2.53e-02 | 4.43e-01 | 0.0112 |
| 7249 | TSC2 | HTA11_6818_2000001021 | Human | Colorectum | AD | 3.06e-02 | 3.43e-01 | 0.0588 |
| 7249 | TSC2 | HTA11_99999965062_69753 | Human | Colorectum | MSI-H | 2.84e-03 | 9.05e-01 | 0.3487 |
| 7249 | TSC2 | HTA11_99999965104_69814 | Human | Colorectum | MSS | 1.15e-04 | 3.48e-01 | 0.281 |
| 7249 | TSC2 | HTA11_99999971662_82457 | Human | Colorectum | MSS | 2.86e-06 | 4.01e-01 | 0.3859 |
| 7249 | TSC2 | A015-C-104 | Human | Colorectum | FAP | 3.31e-03 | 1.12e-01 | -0.1899 |
| Page: 1 2 3 4 5 6 7 |
| Tissue | Expression Dynamics | Abbreviation |
| Colorectum (GSE201348) |  | FAP: Familial adenomatous polyposis |
| CRC: Colorectal cancer | ||
| Colorectum (HTA11) |  | AD: Adenomas |
| SER: Sessile serrated lesions | ||
| MSI-H: Microsatellite-high colorectal cancer | ||
| MSS: Microsatellite stable colorectal cancer | ||
| Esophagus | 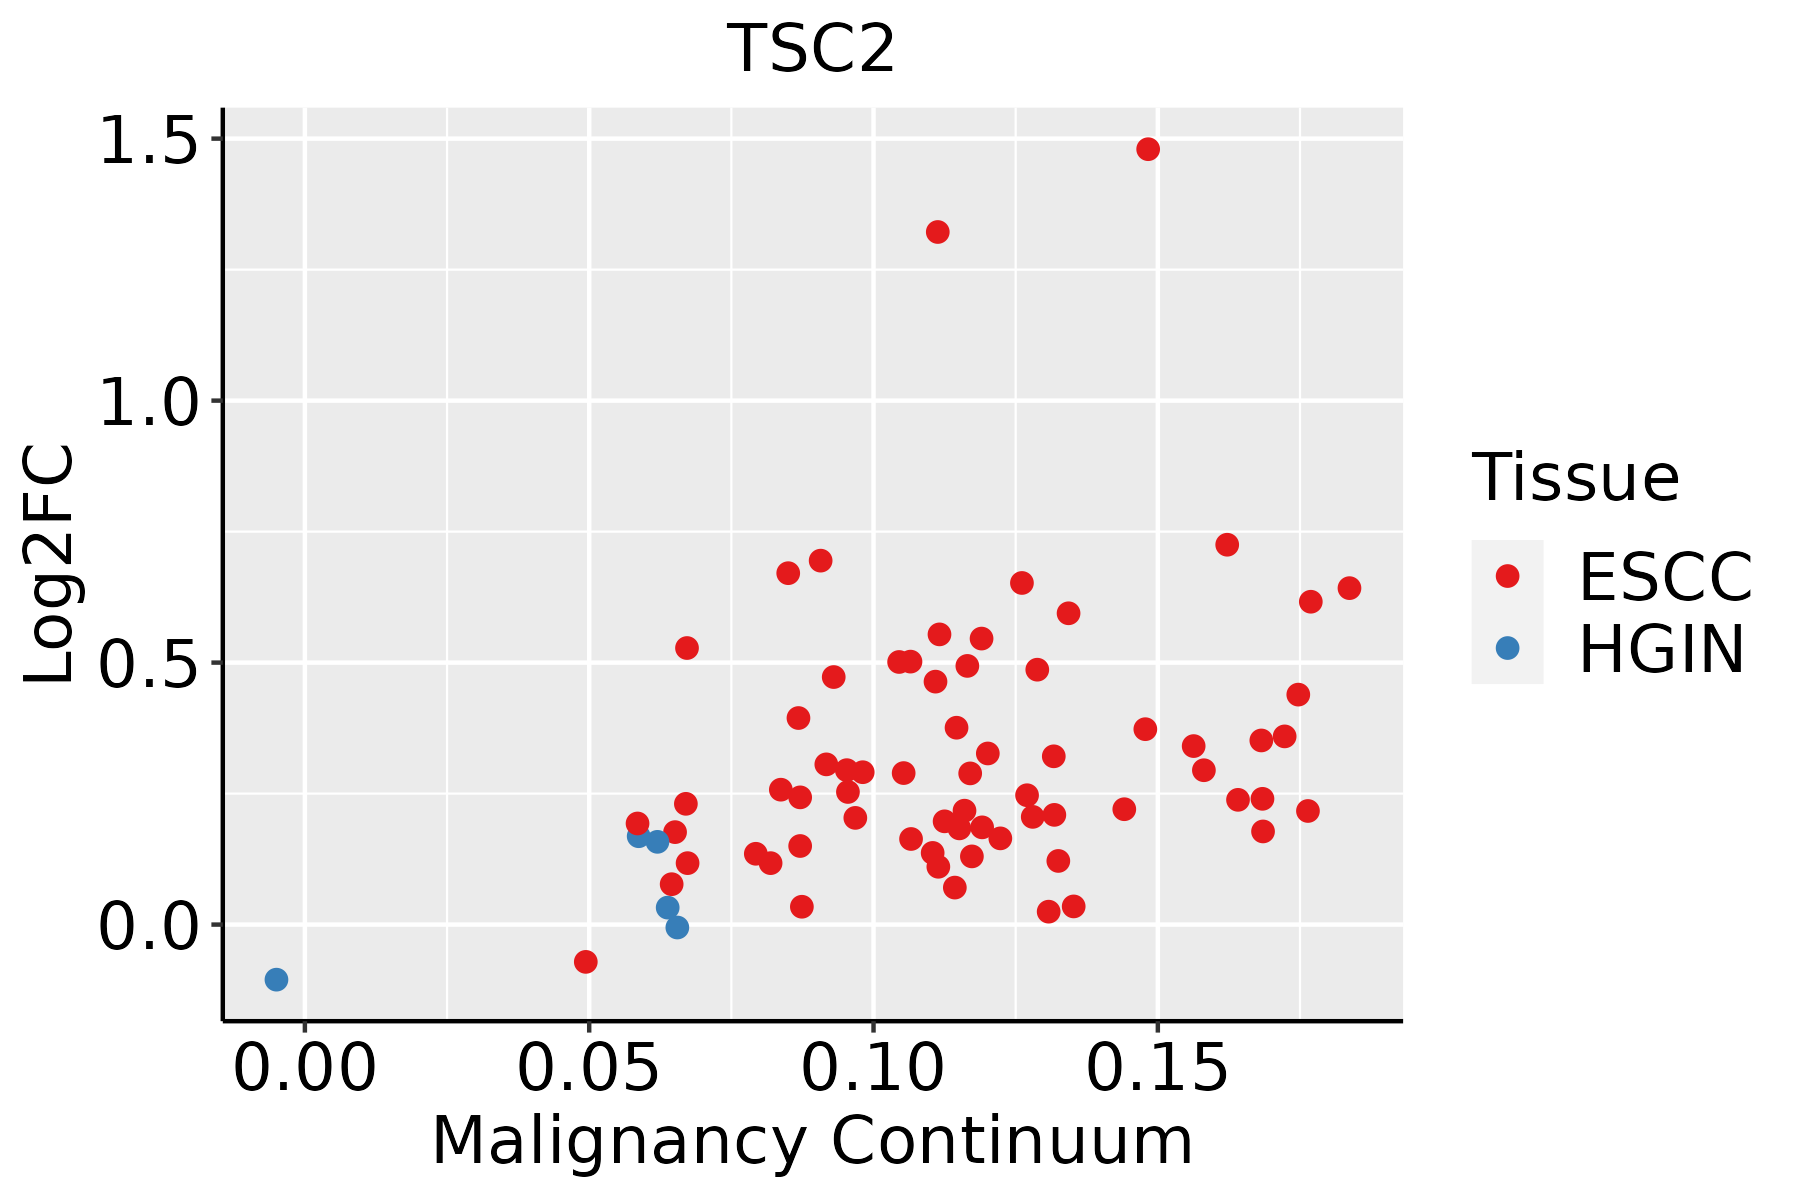 | ESCC: Esophageal squamous cell carcinoma |
| HGIN: High-grade intraepithelial neoplasias | ||
| LGIN: Low-grade intraepithelial neoplasias | ||
| Liver |  | HCC: Hepatocellular carcinoma |
| NAFLD: Non-alcoholic fatty liver disease | ||
| Oral Cavity | 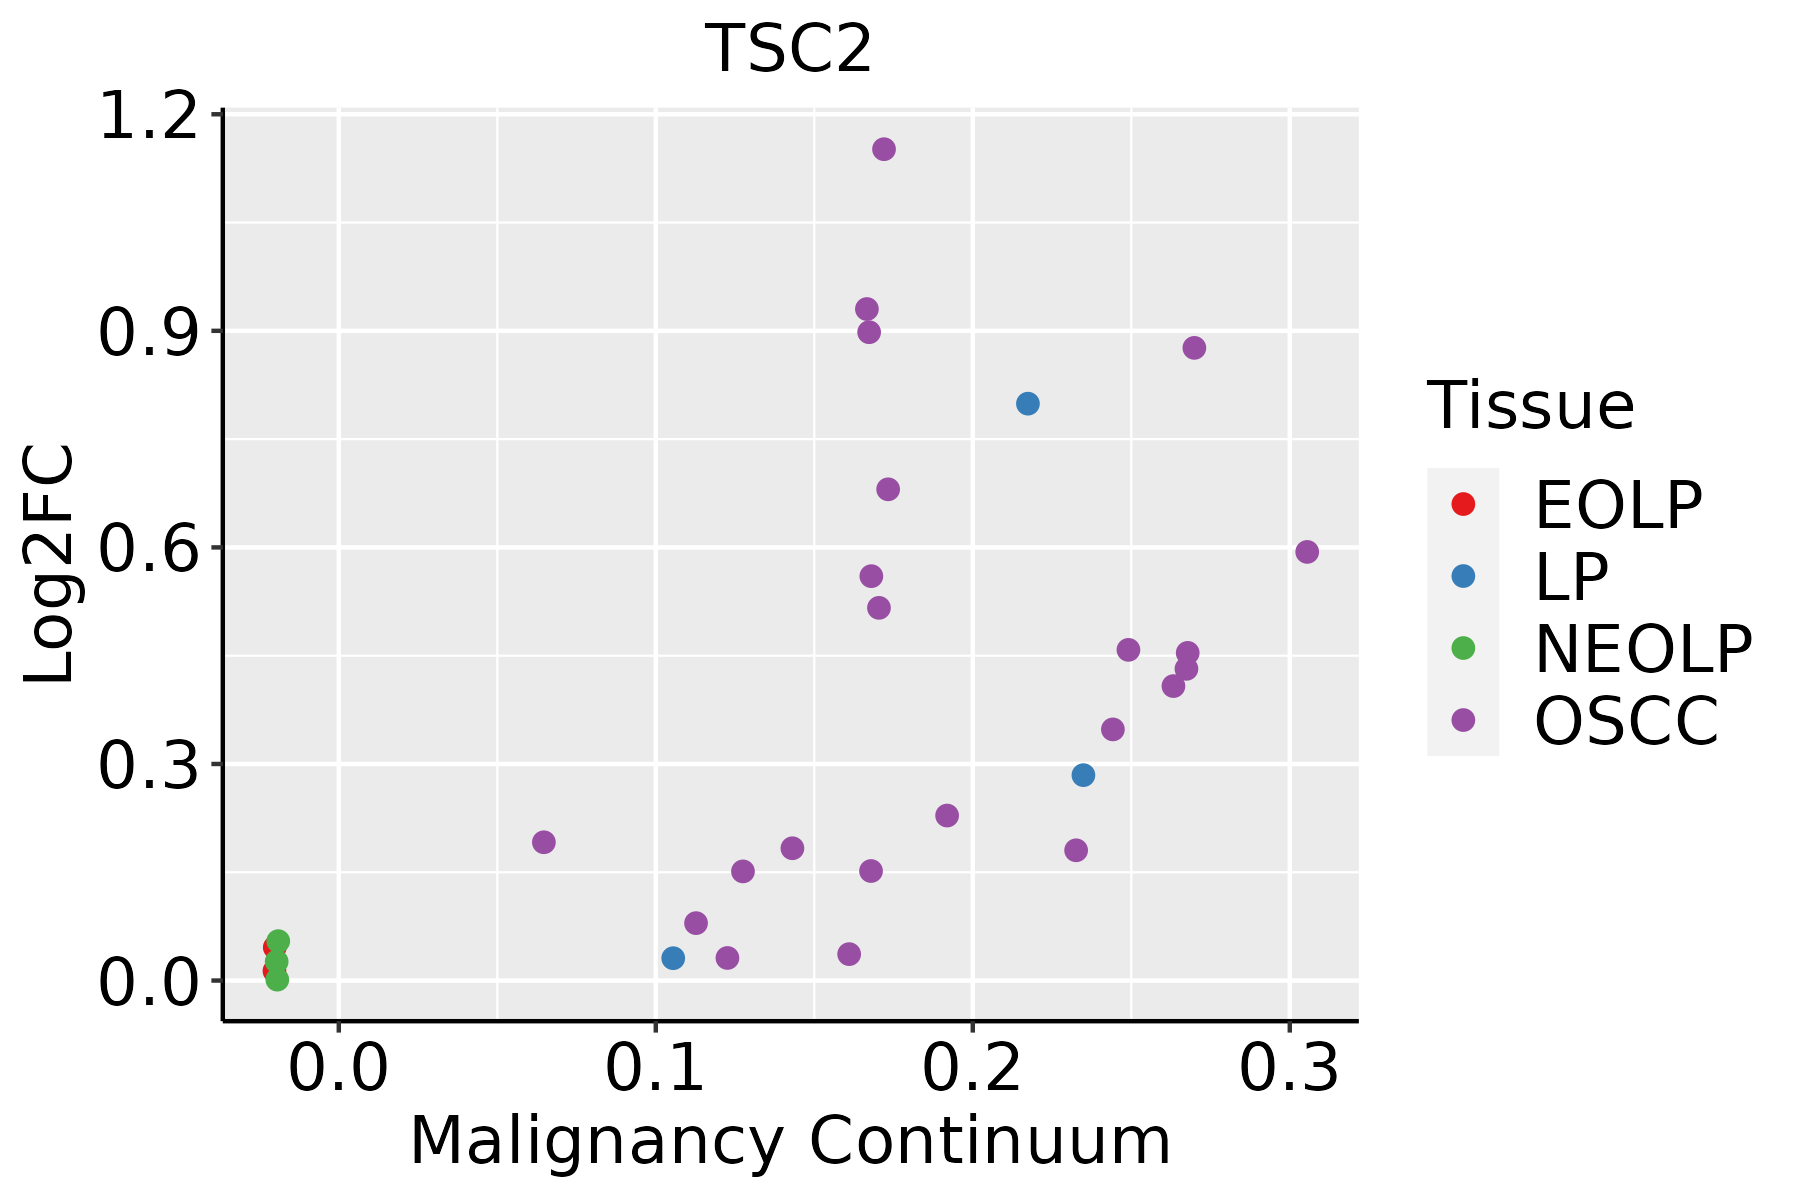 | EOLP: Erosive Oral lichen planus |
| LP: leukoplakia | ||
| NEOLP: Non-erosive oral lichen planus | ||
| OSCC: Oral squamous cell carcinoma | ||
| Thyroid |  | ATC: Anaplastic thyroid cancer |
| HT: Hashimoto's thyroiditis | ||
| PTC: Papillary thyroid cancer |
| ∗log2FC in expression of this searched gene in stem-like cells from each diseased tissue sample relative to stem-like cells in normal samples in each tissue plotted against the malignancy continuum. Samples are colored based on if they are from different disease stage. |
Top |
Malignant transformation related pathway analysis |
| Find out the enriched GO biological processes and KEGG pathways involved in transition from healthy to precancer to cancer |
| Tissue | Disease Stage | Enriched GO biological Processes |
| Colorectum | AD |  |
| Colorectum | SER |  |
| Colorectum | MSS |  |
| Colorectum | MSI-H |  |
| Colorectum | FAP |  |
| ∗Top 15 enriched GO BP terms are showed in the bar plot of each disease state in each tissue. Each row represents a significant GO biological process which is colored according to the -log10(p.adjust). |
| Page: 1 2 3 4 5 6 7 8 9 |
| GO ID | Tissue | Disease Stage | Description | Gene Ratio | Bg Ratio | pvalue | p.adjust | Count |
| GO:000268311 | Breast | IDC | negative regulation of immune system process | 55/1434 | 434/18723 | 1.53e-04 | 2.67e-03 | 55 |
| GO:004887214 | Breast | IDC | homeostasis of number of cells | 36/1434 | 272/18723 | 9.10e-04 | 1.04e-02 | 36 |
| GO:0070229 | Breast | IDC | negative regulation of lymphocyte apoptotic process | 7/1434 | 30/18723 | 6.48e-03 | 4.56e-02 | 7 |
| GO:000268321 | Breast | DCIS | negative regulation of immune system process | 57/1390 | 434/18723 | 1.81e-05 | 4.35e-04 | 57 |
| GO:004887224 | Breast | DCIS | homeostasis of number of cells | 36/1390 | 272/18723 | 5.17e-04 | 6.73e-03 | 36 |
| GO:0009896 | Colorectum | AD | positive regulation of catabolic process | 180/3918 | 492/18723 | 4.33e-16 | 1.94e-13 | 180 |
| GO:0031331 | Colorectum | AD | positive regulation of cellular catabolic process | 156/3918 | 427/18723 | 4.68e-14 | 1.05e-11 | 156 |
| GO:0009895 | Colorectum | AD | negative regulation of catabolic process | 124/3918 | 320/18723 | 1.66e-13 | 3.35e-11 | 124 |
| GO:0031330 | Colorectum | AD | negative regulation of cellular catabolic process | 104/3918 | 262/18723 | 2.66e-12 | 3.96e-10 | 104 |
| GO:0072594 | Colorectum | AD | establishment of protein localization to organelle | 148/3918 | 422/18723 | 7.95e-12 | 1.04e-09 | 148 |
| GO:0022411 | Colorectum | AD | cellular component disassembly | 147/3918 | 443/18723 | 8.53e-10 | 6.76e-08 | 147 |
| GO:0010506 | Colorectum | AD | regulation of autophagy | 111/3918 | 317/18723 | 3.57e-09 | 2.35e-07 | 111 |
| GO:0016236 | Colorectum | AD | macroautophagy | 103/3918 | 291/18723 | 6.76e-09 | 4.15e-07 | 103 |
| GO:0006913 | Colorectum | AD | nucleocytoplasmic transport | 102/3918 | 301/18723 | 1.00e-07 | 4.85e-06 | 102 |
| GO:0051169 | Colorectum | AD | nuclear transport | 102/3918 | 301/18723 | 1.00e-07 | 4.85e-06 | 102 |
| GO:0010639 | Colorectum | AD | negative regulation of organelle organization | 114/3918 | 348/18723 | 1.41e-07 | 6.49e-06 | 114 |
| GO:0032868 | Colorectum | AD | response to insulin | 91/3918 | 264/18723 | 2.02e-07 | 8.48e-06 | 91 |
| GO:0010821 | Colorectum | AD | regulation of mitochondrion organization | 57/3918 | 144/18723 | 2.43e-07 | 9.92e-06 | 57 |
| GO:1901653 | Colorectum | AD | cellular response to peptide | 114/3918 | 359/18723 | 8.32e-07 | 2.88e-05 | 114 |
| GO:0032869 | Colorectum | AD | cellular response to insulin stimulus | 72/3918 | 203/18723 | 1.10e-06 | 3.68e-05 | 72 |
| Page: 1 2 3 4 5 6 7 8 9 10 11 12 13 14 15 16 17 18 19 20 21 22 23 24 25 26 27 28 29 30 31 32 33 34 35 |
| Pathway ID | Tissue | Disease Stage | Description | Gene Ratio | Bg Ratio | pvalue | p.adjust | qvalue | Count |
| hsa04714 | Colorectum | AD | Thermogenesis | 120/2092 | 232/8465 | 2.76e-19 | 1.16e-17 | 7.37e-18 | 120 |
| hsa04919 | Colorectum | AD | Thyroid hormone signaling pathway | 51/2092 | 121/8465 | 1.71e-05 | 1.73e-04 | 1.10e-04 | 51 |
| hsa04152 | Colorectum | AD | AMPK signaling pathway | 47/2092 | 121/8465 | 3.74e-04 | 2.82e-03 | 1.80e-03 | 47 |
| hsa05163 | Colorectum | AD | Human cytomegalovirus infection | 75/2092 | 225/8465 | 2.00e-03 | 1.10e-02 | 7.01e-03 | 75 |
| hsa04140 | Colorectum | AD | Autophagy - animal | 49/2092 | 141/8465 | 4.58e-03 | 2.20e-02 | 1.40e-02 | 49 |
| hsa04218 | Colorectum | AD | Cellular senescence | 53/2092 | 156/8465 | 5.55e-03 | 2.48e-02 | 1.58e-02 | 53 |
| hsa04211 | Colorectum | AD | Longevity regulating pathway | 33/2092 | 89/8465 | 6.15e-03 | 2.68e-02 | 1.71e-02 | 33 |
| hsa047141 | Colorectum | AD | Thermogenesis | 120/2092 | 232/8465 | 2.76e-19 | 1.16e-17 | 7.37e-18 | 120 |
| hsa049191 | Colorectum | AD | Thyroid hormone signaling pathway | 51/2092 | 121/8465 | 1.71e-05 | 1.73e-04 | 1.10e-04 | 51 |
| hsa041521 | Colorectum | AD | AMPK signaling pathway | 47/2092 | 121/8465 | 3.74e-04 | 2.82e-03 | 1.80e-03 | 47 |
| hsa051631 | Colorectum | AD | Human cytomegalovirus infection | 75/2092 | 225/8465 | 2.00e-03 | 1.10e-02 | 7.01e-03 | 75 |
| hsa041401 | Colorectum | AD | Autophagy - animal | 49/2092 | 141/8465 | 4.58e-03 | 2.20e-02 | 1.40e-02 | 49 |
| hsa042181 | Colorectum | AD | Cellular senescence | 53/2092 | 156/8465 | 5.55e-03 | 2.48e-02 | 1.58e-02 | 53 |
| hsa042111 | Colorectum | AD | Longevity regulating pathway | 33/2092 | 89/8465 | 6.15e-03 | 2.68e-02 | 1.71e-02 | 33 |
| hsa047142 | Colorectum | SER | Thermogenesis | 106/1580 | 232/8465 | 1.15e-21 | 6.34e-20 | 4.61e-20 | 106 |
| hsa049192 | Colorectum | SER | Thyroid hormone signaling pathway | 40/1580 | 121/8465 | 1.02e-04 | 1.06e-03 | 7.67e-04 | 40 |
| hsa041402 | Colorectum | SER | Autophagy - animal | 39/1580 | 141/8465 | 5.43e-03 | 3.28e-02 | 2.38e-02 | 39 |
| hsa051632 | Colorectum | SER | Human cytomegalovirus infection | 57/1580 | 225/8465 | 7.40e-03 | 3.84e-02 | 2.79e-02 | 57 |
| hsa047143 | Colorectum | SER | Thermogenesis | 106/1580 | 232/8465 | 1.15e-21 | 6.34e-20 | 4.61e-20 | 106 |
| hsa049193 | Colorectum | SER | Thyroid hormone signaling pathway | 40/1580 | 121/8465 | 1.02e-04 | 1.06e-03 | 7.67e-04 | 40 |
| Page: 1 2 3 4 5 6 7 8 |
Top |
Cell-cell communication analysis |
| Identification of potential cell-cell interactions between two cell types and their ligand-receptor pairs for different disease states |
| Ligand | Receptor | LRpair | Pathway | Tissue | Disease Stage |
| Page: 1 |
Top |
Single-cell gene regulatory network inference analysis |
| Find out the significant the regulons (TFs) and the target genes of each regulon across cell types for different disease states |
| TF | Cell Type | Tissue | Disease Stage | Target Gene | RSS | Regulon Activity |
| ∗The dot plots of a searched regulon are shown for all cell subpopulations in each disease state of each tissue based on the regulon specific score inferred using pySCENIC and by calculating the average expression. |
| Page: 1 |
Top |
Somatic mutation of malignant transformation related genes |
| Annotation of somatic variants for genes involved in malignant transformation |
| Hugo Symbol | Variant Class | Variant Classification | dbSNP RS | HGVSc | HGVSp | HGVSp Short | SWISSPROT | BIOTYPE | SIFT | PolyPhen | Tumor Sample Barcode | Tissue | Histology | Sex | Age | Stage | Therapy Types | Drugs | Outcome |
| TSC2 | SNV | Missense_Mutation | c.4370N>A | p.Arg1457Gln | p.R1457Q | P49815 | protein_coding | deleterious(0) | probably_damaging(0.945) | TCGA-BR-6454-01 | Stomach | stomach adenocarcinoma | Male | <65 | I/II | Unknown | Unknown | SD | |
| TSC2 | SNV | Missense_Mutation | rs142919353 | c.673N>A | p.Val225Met | p.V225M | P49815 | protein_coding | deleterious(0) | probably_damaging(0.998) | TCGA-BR-6458-01 | Stomach | stomach adenocarcinoma | Female | <65 | I/II | Chemotherapy | 5-fluorouracil | PD |
| TSC2 | SNV | Missense_Mutation | c.2431N>C | p.Cys811Arg | p.C811R | P49815 | protein_coding | deleterious(0) | probably_damaging(0.996) | TCGA-BR-8081-01 | Stomach | stomach adenocarcinoma | Female | >=65 | I/II | Unknown | Unknown | SD | |
| TSC2 | SNV | Missense_Mutation | rs397515110 | c.5072T>C | p.Met1691Thr | p.M1691T | P49815 | protein_coding | deleterious(0) | benign(0.165) | TCGA-BR-8487-01 | Stomach | stomach adenocarcinoma | Female | <65 | I/II | Unknown | Unknown | SD |
| TSC2 | SNV | Missense_Mutation | c.504G>A | p.Met168Ile | p.M168I | P49815 | protein_coding | tolerated(0.1) | possibly_damaging(0.844) | TCGA-BR-A4QL-01 | Stomach | stomach adenocarcinoma | Female | >=65 | III/IV | Chemotherapy | xeloda | CR | |
| TSC2 | SNV | Missense_Mutation | rs876660733 | c.2933N>A | p.Arg978His | p.R978H | P49815 | protein_coding | deleterious(0.02) | benign(0.012) | TCGA-CD-A4MG-01 | Stomach | stomach adenocarcinoma | Male | >=65 | I/II | Unknown | Unknown | PD |
| TSC2 | SNV | Missense_Mutation | rs766093661 | c.5234N>A | p.Arg1745His | p.R1745H | P49815 | protein_coding | deleterious(0) | probably_damaging(0.998) | TCGA-F1-A448-01 | Stomach | stomach adenocarcinoma | Male | >=65 | III/IV | Chemotherapy | capecitabine | CR |
| TSC2 | SNV | Missense_Mutation | c.1106T>G | p.Leu369Arg | p.L369R | P49815 | protein_coding | deleterious(0) | probably_damaging(0.998) | TCGA-HU-A4G8-01 | Stomach | stomach adenocarcinoma | Female | >=65 | I/II | Chemotherapy | 5-fluorouracil | SD | |
| TSC2 | SNV | Missense_Mutation | rs182538665 | c.2152N>T | p.Arg718Cys | p.R718C | P49815 | protein_coding | deleterious(0) | probably_damaging(0.997) | TCGA-HU-A4GN-01 | Stomach | stomach adenocarcinoma | Male | <65 | I/II | Chemotherapy | mitomycin | PD |
| TSC2 | SNV | Missense_Mutation | rs397515063 | c.1754N>A | p.Arg585His | p.R585H | P49815 | protein_coding | deleterious(0) | possibly_damaging(0.833) | TCGA-HU-A4GQ-01 | Stomach | stomach adenocarcinoma | Male | >=65 | III/IV | Unknown | Unknown | SD |
| Page: 1 2 3 4 5 6 7 8 9 10 11 12 13 14 15 16 |
Top |
Related drugs of malignant transformation related genes |
| Identification of chemicals and drugs interact with genes involved in malignant transfromation |
| (DGIdb 4.0) |
| Entrez ID | Symbol | Category | Interaction Types | Drug Claim Name | Drug Name | PMIDs |
| 7249 | TSC2 | CLINICALLY ACTIONABLE, KINASE, TUMOR SUPPRESSOR | EVEROLIMUS | EVEROLIMUS | 23158522,25295501 | |
| 7249 | TSC2 | CLINICALLY ACTIONABLE, KINASE, TUMOR SUPPRESSOR | Everolimus | EVEROLIMUS | ||
| 7249 | TSC2 | CLINICALLY ACTIONABLE, KINASE, TUMOR SUPPRESSOR | MTOR INHIBITOR | 26831717 |
| Page: 1 |

Copyright 2023-Present -The University of Texas Health Science Center at Houston |