
|
|||||
|
 | |
| |
| |
| |
| |
| |
|
Gene: ST6GAL2 |
Gene summary for ST6GAL2 |
| Gene information | Species | Human | Gene symbol | ST6GAL2 | Gene ID | 84620 |
| Gene name | ST6 beta-galactoside alpha-2,6-sialyltransferase 2 | |
| Gene Alias | SIAT2 | |
| Cytomap | 2q12.3 | |
| Gene Type | protein-coding | GO ID | GO:0005975 | UniProtAcc | Q96JF0 |
Top |
Malignant transformation analysis |
| Identification of the aberrant gene expression in precancerous and cancerous lesions by comparing the gene expression of stem-like cells in diseased tissues with normal stem cells |
| Entrez ID | Symbol | Replicates | Species | Organ | Tissue | Adj P-value | Log2FC | Malignancy |
| 84620 | ST6GAL2 | HCC1 | Human | Liver | HCC | 8.27e-05 | 3.12e-01 | 0.5336 |
| 84620 | ST6GAL2 | HCC2 | Human | Liver | HCC | 1.30e-15 | 6.74e-01 | 0.5341 |
| 84620 | ST6GAL2 | HCC5 | Human | Liver | HCC | 3.66e-16 | 7.84e-01 | 0.4932 |
| 84620 | ST6GAL2 | male-WTA | Human | Thyroid | PTC | 2.63e-22 | 3.52e-01 | 0.1037 |
| 84620 | ST6GAL2 | PTC01 | Human | Thyroid | PTC | 4.66e-12 | 2.67e-01 | 0.1899 |
| 84620 | ST6GAL2 | PTC04 | Human | Thyroid | PTC | 8.66e-03 | 1.78e-01 | 0.1927 |
| 84620 | ST6GAL2 | PTC05 | Human | Thyroid | PTC | 3.49e-06 | 7.10e-01 | 0.2065 |
| 84620 | ST6GAL2 | PTC06 | Human | Thyroid | PTC | 1.72e-20 | 8.58e-01 | 0.2057 |
| 84620 | ST6GAL2 | PTC07 | Human | Thyroid | PTC | 3.32e-27 | 7.16e-01 | 0.2044 |
| 84620 | ST6GAL2 | ATC13 | Human | Thyroid | ATC | 6.42e-06 | 1.97e-01 | 0.34 |
| 84620 | ST6GAL2 | ATC4 | Human | Thyroid | ATC | 1.35e-02 | -9.01e-02 | 0.34 |
| 84620 | ST6GAL2 | ATC5 | Human | Thyroid | ATC | 2.08e-05 | 2.22e-01 | 0.34 |
| Page: 1 |
| Tissue | Expression Dynamics | Abbreviation |
| Liver | 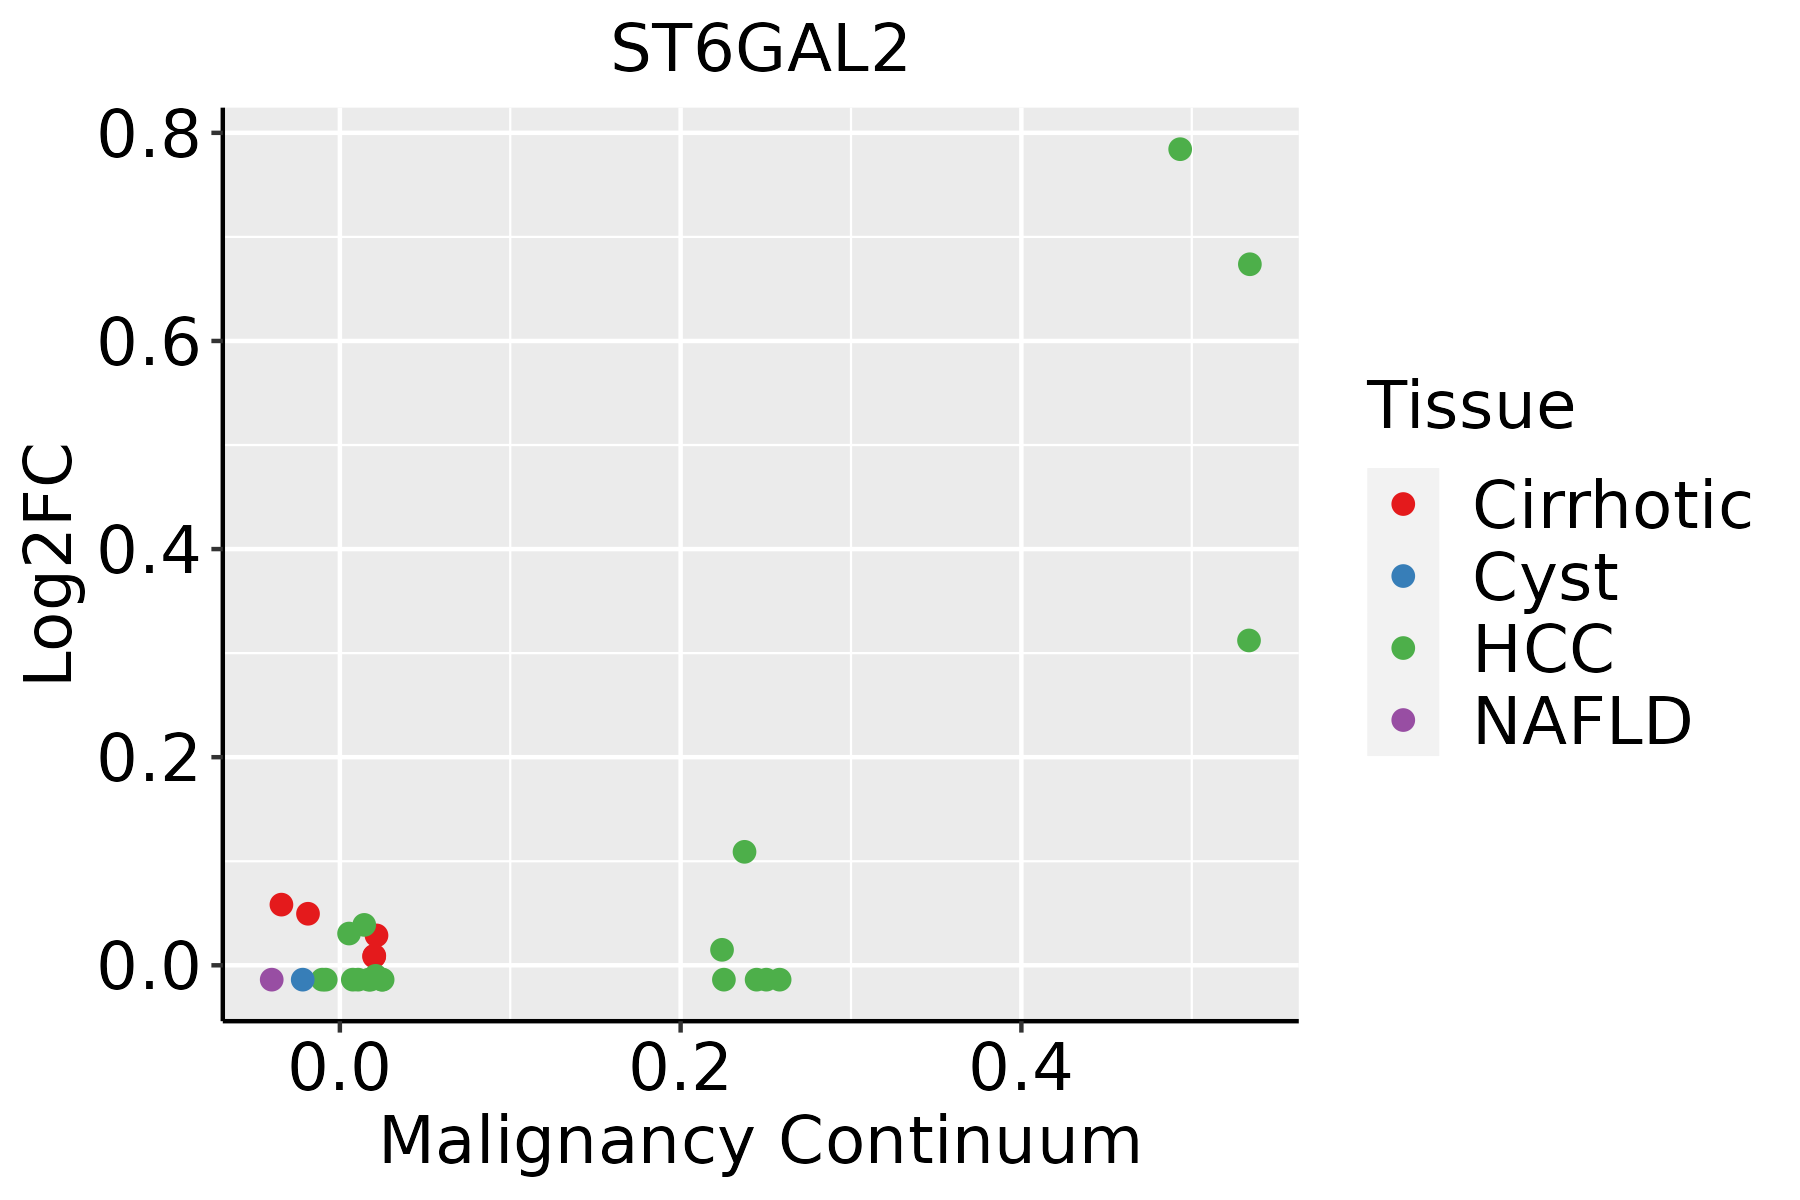 | HCC: Hepatocellular carcinoma |
| NAFLD: Non-alcoholic fatty liver disease | ||
| Thyroid | 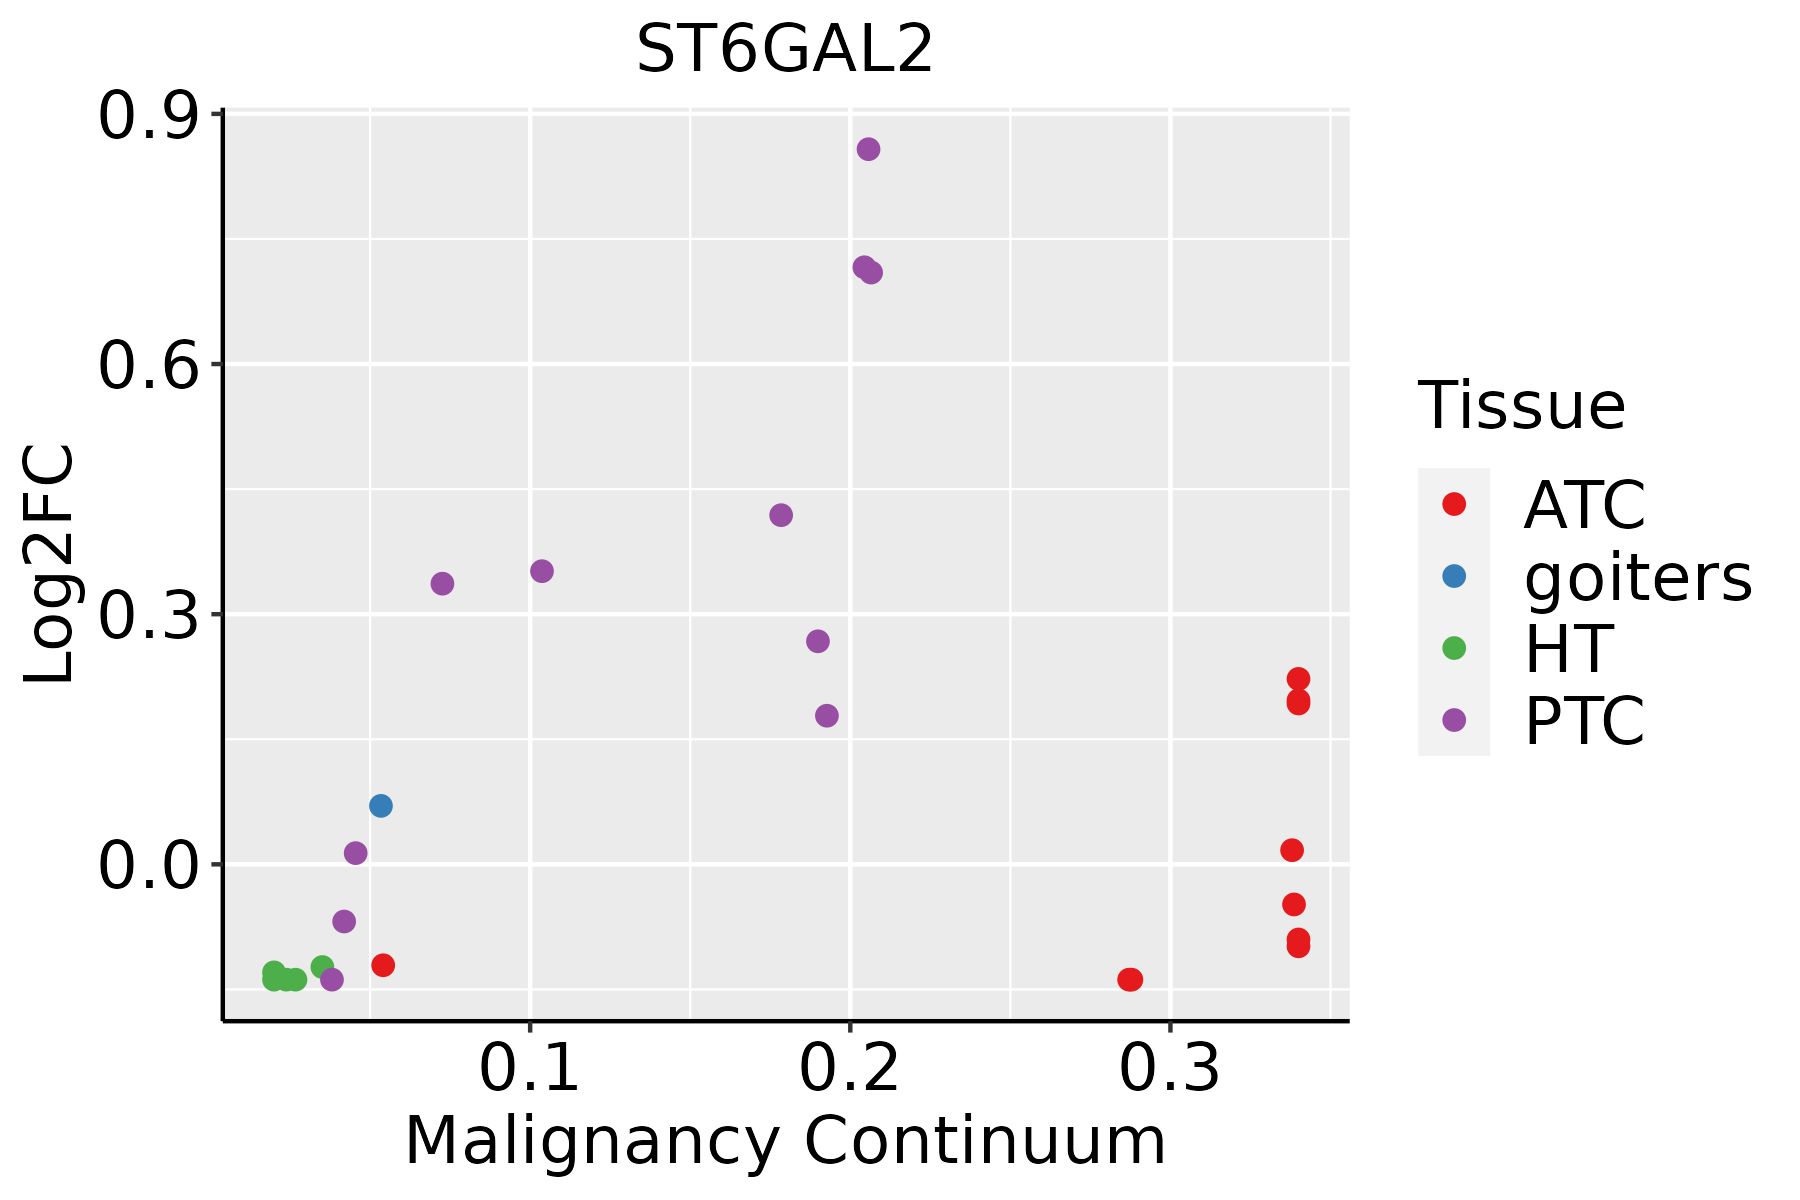 | ATC: Anaplastic thyroid cancer |
| HT: Hashimoto's thyroiditis | ||
| PTC: Papillary thyroid cancer |
| ∗log2FC in expression of this searched gene in stem-like cells from each diseased tissue sample relative to stem-like cells in normal samples in each tissue plotted against the malignancy continuum. Samples are colored based on if they are from different disease stage. |
Top |
Malignant transformation related pathway analysis |
| Find out the enriched GO biological processes and KEGG pathways involved in transition from healthy to precancer to cancer |
| Tissue | Disease Stage | Enriched GO biological Processes |
| Colorectum | AD |  |
| Colorectum | SER |  |
| Colorectum | MSS |  |
| Colorectum | MSI-H |  |
| Colorectum | FAP |  |
| ∗Top 15 enriched GO BP terms are showed in the bar plot of each disease state in each tissue. Each row represents a significant GO biological process which is colored according to the -log10(p.adjust). |
| Page: 1 2 3 4 5 6 7 8 9 |
| GO ID | Tissue | Disease Stage | Description | Gene Ratio | Bg Ratio | pvalue | p.adjust | Count |
| GO:00064862 | Liver | HCC | protein glycosylation | 122/7958 | 226/18723 | 3.11e-04 | 2.21e-03 | 122 |
| GO:00434132 | Liver | HCC | macromolecule glycosylation | 122/7958 | 226/18723 | 3.11e-04 | 2.21e-03 | 122 |
| GO:00700852 | Liver | HCC | glycosylation | 128/7958 | 240/18723 | 4.35e-04 | 2.92e-03 | 128 |
| GO:0009100 | Liver | HCC | glycoprotein metabolic process | 193/7958 | 387/18723 | 1.89e-03 | 9.62e-03 | 193 |
| GO:00064866 | Thyroid | PTC | protein glycosylation | 94/5968 | 226/18723 | 1.25e-03 | 7.13e-03 | 94 |
| GO:00434136 | Thyroid | PTC | macromolecule glycosylation | 94/5968 | 226/18723 | 1.25e-03 | 7.13e-03 | 94 |
| GO:00700855 | Thyroid | PTC | glycosylation | 96/5968 | 240/18723 | 4.57e-03 | 2.15e-02 | 96 |
| GO:00091013 | Thyroid | PTC | glycoprotein biosynthetic process | 123/5968 | 317/18723 | 5.05e-03 | 2.33e-02 | 123 |
| GO:00091003 | Thyroid | PTC | glycoprotein metabolic process | 147/5968 | 387/18723 | 5.87e-03 | 2.64e-02 | 147 |
| GO:000648612 | Thyroid | ATC | protein glycosylation | 94/6293 | 226/18723 | 7.11e-03 | 2.82e-02 | 94 |
| GO:004341312 | Thyroid | ATC | macromolecule glycosylation | 94/6293 | 226/18723 | 7.11e-03 | 2.82e-02 | 94 |
| GO:000910011 | Thyroid | ATC | glycoprotein metabolic process | 153/6293 | 387/18723 | 7.90e-03 | 3.06e-02 | 153 |
| Page: 1 |
| Pathway ID | Tissue | Disease Stage | Description | Gene Ratio | Bg Ratio | pvalue | p.adjust | qvalue | Count |
| Page: 1 |
Top |
Cell-cell communication analysis |
| Identification of potential cell-cell interactions between two cell types and their ligand-receptor pairs for different disease states |
| Ligand | Receptor | LRpair | Pathway | Tissue | Disease Stage |
| Page: 1 |
Top |
Single-cell gene regulatory network inference analysis |
| Find out the significant the regulons (TFs) and the target genes of each regulon across cell types for different disease states |
| TF | Cell Type | Tissue | Disease Stage | Target Gene | RSS | Regulon Activity |
| ∗The dot plots of a searched regulon are shown for all cell subpopulations in each disease state of each tissue based on the regulon specific score inferred using pySCENIC and by calculating the average expression. |
| Page: 1 |
Top |
Somatic mutation of malignant transformation related genes |
| Annotation of somatic variants for genes involved in malignant transformation |
| Hugo Symbol | Variant Class | Variant Classification | dbSNP RS | HGVSc | HGVSp | HGVSp Short | SWISSPROT | BIOTYPE | SIFT | PolyPhen | Tumor Sample Barcode | Tissue | Histology | Sex | Age | Stage | Therapy Types | Drugs | Outcome |
| ST6GAL2 | SNV | Missense_Mutation | rs138857139 | c.88N>G | p.Phe30Val | p.F30V | Q96JF0 | protein_coding | probably_damaging(0.996) | TCGA-HU-A4GH-01 | Stomach | stomach adenocarcinoma | Male | >=65 | I/II | Unknown | Unknown | SD | |
| ST6GAL2 | SNV | Missense_Mutation | rs763586738 | c.796N>A | p.Gly266Ser | p.G266S | Q96JF0 | protein_coding | benign(0.235) | TCGA-HU-A4GN-01 | Stomach | stomach adenocarcinoma | Male | <65 | I/II | Chemotherapy | mitomycin | PD | |
| ST6GAL2 | SNV | Missense_Mutation | novel | c.1583A>G | p.His528Arg | p.H528R | Q96JF0 | protein_coding | benign(0) | TCGA-R5-A7ZE-01 | Stomach | stomach adenocarcinoma | Female | >=65 | III/IV | Unknown | Unknown | PD | |
| ST6GAL2 | SNV | Missense_Mutation | rs200325346 | c.1547N>T | p.Ala516Val | p.A516V | Q96JF0 | protein_coding | benign(0.155) | TCGA-VQ-A8P2-01 | Stomach | stomach adenocarcinoma | Male | >=65 | III/IV | Unspecific | Complete Response | ||
| ST6GAL2 | SNV | Missense_Mutation | novel | c.581N>T | p.Arg194Met | p.R194M | Q96JF0 | protein_coding | benign(0.009) | TCGA-VQ-A8P2-01 | Stomach | stomach adenocarcinoma | Male | >=65 | III/IV | Unspecific | Complete Response | ||
| ST6GAL2 | SNV | Missense_Mutation | novel | c.361N>A | p.Gln121Lys | p.Q121K | Q96JF0 | protein_coding | benign(0.001) | TCGA-VQ-A91X-01 | Stomach | stomach adenocarcinoma | Male | >=65 | III/IV | Unknown | Unknown | SD | |
| ST6GAL2 | insertion | Nonsense_Mutation | novel | c.1065_1066insATGCATTAAATTGATATTGATGGGTACT | p.Phe356MetfsTer3 | p.F356Mfs*3 | Q96JF0 | protein_coding | TCGA-FY-A4B0-01 | Thyroid | thyroid carcinoma | Male | >=65 | I/II | Hormone Therapy | synthroid | SD |
| Page: 1 2 3 4 5 6 7 8 9 10 11 12 13 14 |
Top |
Related drugs of malignant transformation related genes |
| Identification of chemicals and drugs interact with genes involved in malignant transfromation |
| (DGIdb 4.0) |
| Entrez ID | Symbol | Category | Interaction Types | Drug Claim Name | Drug Name | PMIDs |
| Page: 1 |

Copyright 2023-Present -The University of Texas Health Science Center at Houston |