
|
|||||
|
 | |
| |
| |
| |
| |
| |
|
Gene: SLC4A7 |
Gene summary for SLC4A7 |
| Gene information | Species | Human | Gene symbol | SLC4A7 | Gene ID | 9497 |
| Gene name | solute carrier family 4 member 7 | |
| Gene Alias | NBC2 | |
| Cytomap | 3p24.1 | |
| Gene Type | protein-coding | GO ID | GO:0002064 | UniProtAcc | Q9Y6M7 |
Top |
Malignant transformation analysis |
| Identification of the aberrant gene expression in precancerous and cancerous lesions by comparing the gene expression of stem-like cells in diseased tissues with normal stem cells |
| Entrez ID | Symbol | Replicates | Species | Organ | Tissue | Adj P-value | Log2FC | Malignancy |
| 9497 | SLC4A7 | HTA11_3410_2000001011 | Human | Colorectum | AD | 6.31e-06 | -4.42e-01 | 0.0155 |
| 9497 | SLC4A7 | HTA11_3361_2000001011 | Human | Colorectum | AD | 2.44e-02 | -4.94e-01 | -0.1207 |
| 9497 | SLC4A7 | HTA11_696_2000001011 | Human | Colorectum | AD | 9.53e-03 | -3.23e-01 | -0.1464 |
| 9497 | SLC4A7 | HTA11_866_2000001011 | Human | Colorectum | AD | 1.58e-04 | -3.64e-01 | -0.1001 |
| 9497 | SLC4A7 | HTA11_5212_2000001011 | Human | Colorectum | AD | 6.66e-03 | -5.81e-01 | -0.2061 |
| 9497 | SLC4A7 | HTA11_7862_2000001011 | Human | Colorectum | AD | 4.10e-02 | -5.60e-01 | -0.0179 |
| 9497 | SLC4A7 | HTA11_866_3004761011 | Human | Colorectum | AD | 1.66e-04 | -4.45e-01 | 0.096 |
| 9497 | SLC4A7 | HTA11_7696_3000711011 | Human | Colorectum | AD | 5.19e-03 | -3.40e-01 | 0.0674 |
| 9497 | SLC4A7 | HTA11_99999970781_79442 | Human | Colorectum | MSS | 7.14e-05 | -3.27e-01 | 0.294 |
| 9497 | SLC4A7 | HTA11_99999974143_84620 | Human | Colorectum | MSS | 1.55e-05 | -3.10e-01 | 0.3005 |
| 9497 | SLC4A7 | A015-C-203 | Human | Colorectum | FAP | 4.41e-14 | -1.28e-01 | -0.1294 |
| 9497 | SLC4A7 | A002-C-201 | Human | Colorectum | FAP | 5.58e-03 | -1.32e-01 | 0.0324 |
| 9497 | SLC4A7 | A001-C-108 | Human | Colorectum | FAP | 1.58e-05 | -1.16e-03 | -0.0272 |
| 9497 | SLC4A7 | A002-C-205 | Human | Colorectum | FAP | 1.80e-08 | -6.42e-02 | -0.1236 |
| 9497 | SLC4A7 | A015-C-006 | Human | Colorectum | FAP | 1.21e-07 | 1.30e-01 | -0.0994 |
| 9497 | SLC4A7 | A015-C-106 | Human | Colorectum | FAP | 3.09e-03 | -2.08e-01 | -0.0511 |
| 9497 | SLC4A7 | A002-C-114 | Human | Colorectum | FAP | 8.13e-07 | -2.09e-01 | -0.1561 |
| 9497 | SLC4A7 | A015-C-104 | Human | Colorectum | FAP | 1.14e-14 | -5.24e-02 | -0.1899 |
| 9497 | SLC4A7 | A001-C-014 | Human | Colorectum | FAP | 1.97e-05 | -2.92e-02 | 0.0135 |
| 9497 | SLC4A7 | A002-C-016 | Human | Colorectum | FAP | 5.34e-07 | -1.92e-01 | 0.0521 |
| Page: 1 2 3 4 5 6 7 8 |
| Tissue | Expression Dynamics | Abbreviation |
| Colorectum (GSE201348) |  | FAP: Familial adenomatous polyposis |
| CRC: Colorectal cancer | ||
| Colorectum (HTA11) |  | AD: Adenomas |
| SER: Sessile serrated lesions | ||
| MSI-H: Microsatellite-high colorectal cancer | ||
| MSS: Microsatellite stable colorectal cancer | ||
| Endometrium |  | AEH: Atypical endometrial hyperplasia |
| EEC: Endometrioid Cancer | ||
| Esophagus | 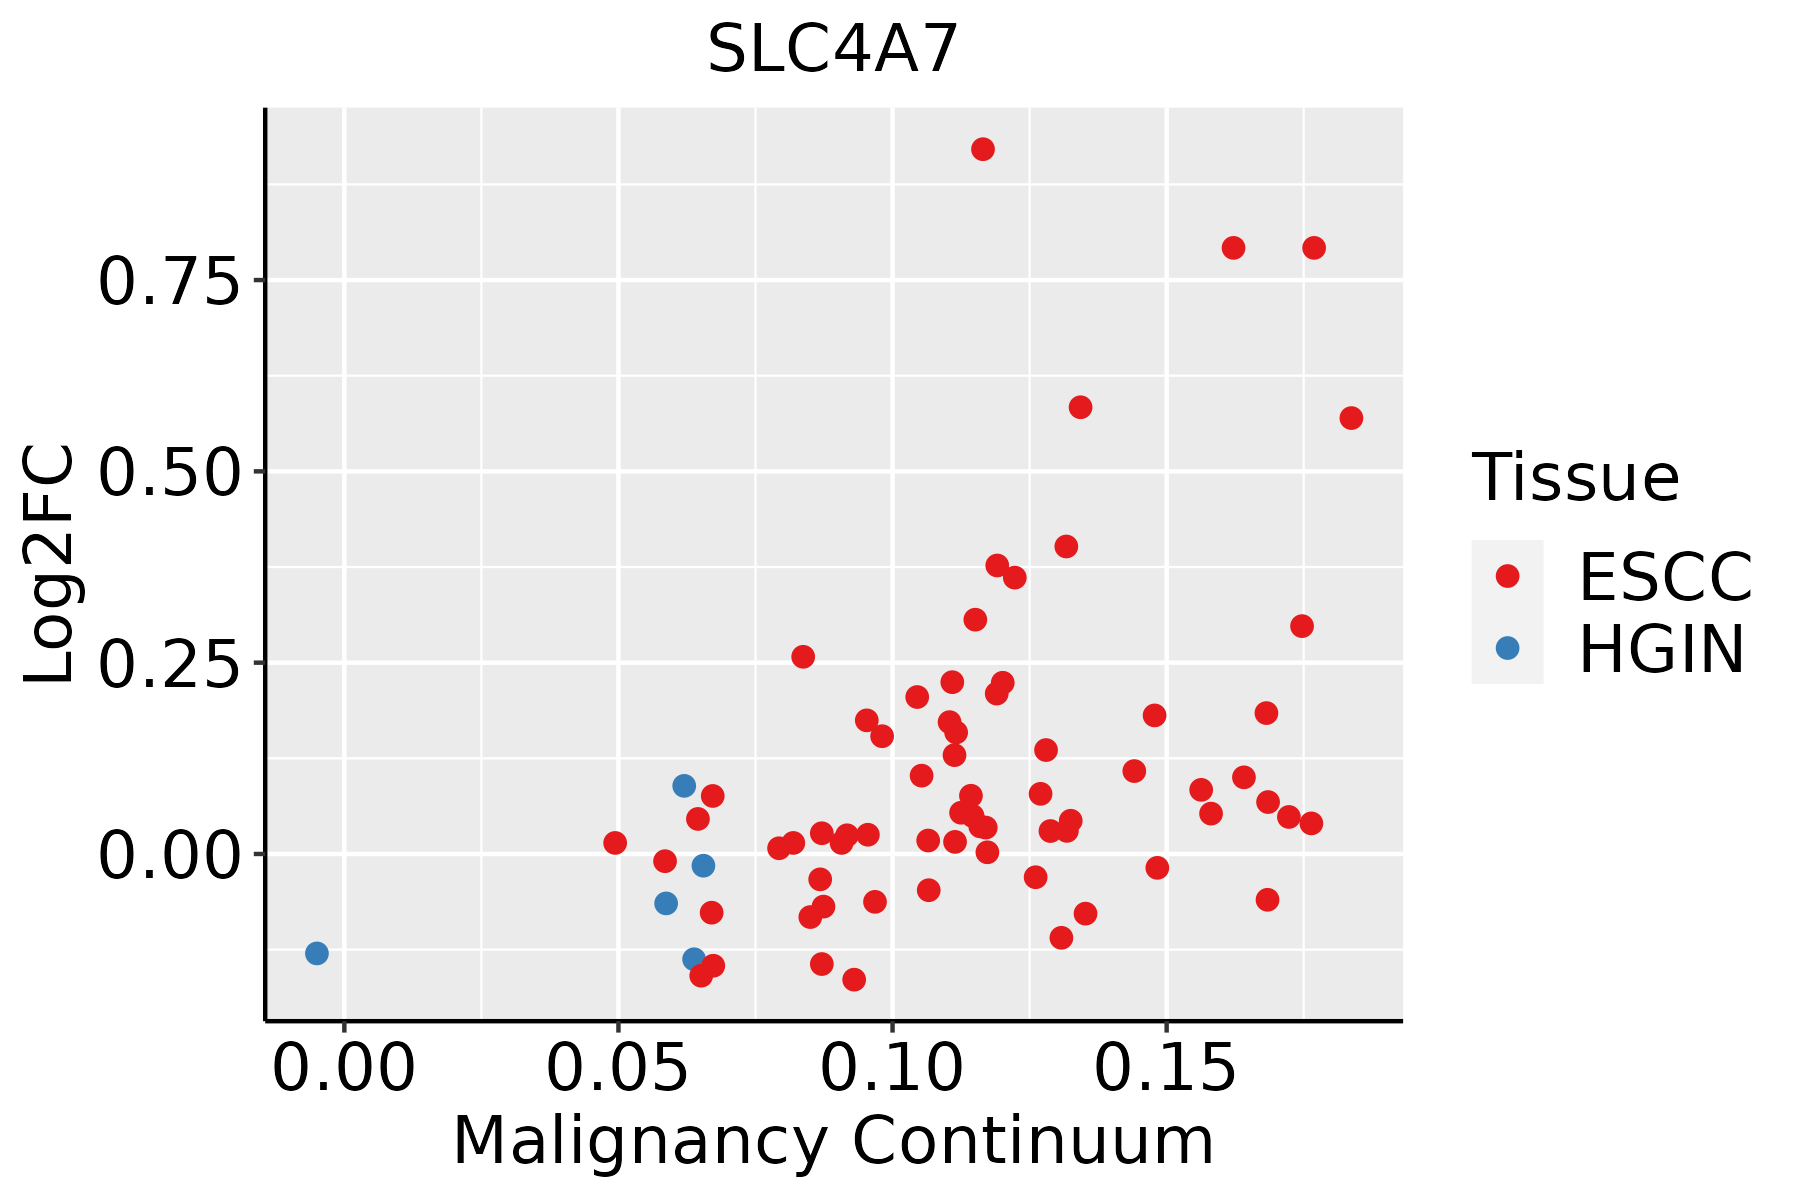 | ESCC: Esophageal squamous cell carcinoma |
| HGIN: High-grade intraepithelial neoplasias | ||
| LGIN: Low-grade intraepithelial neoplasias | ||
| GC | 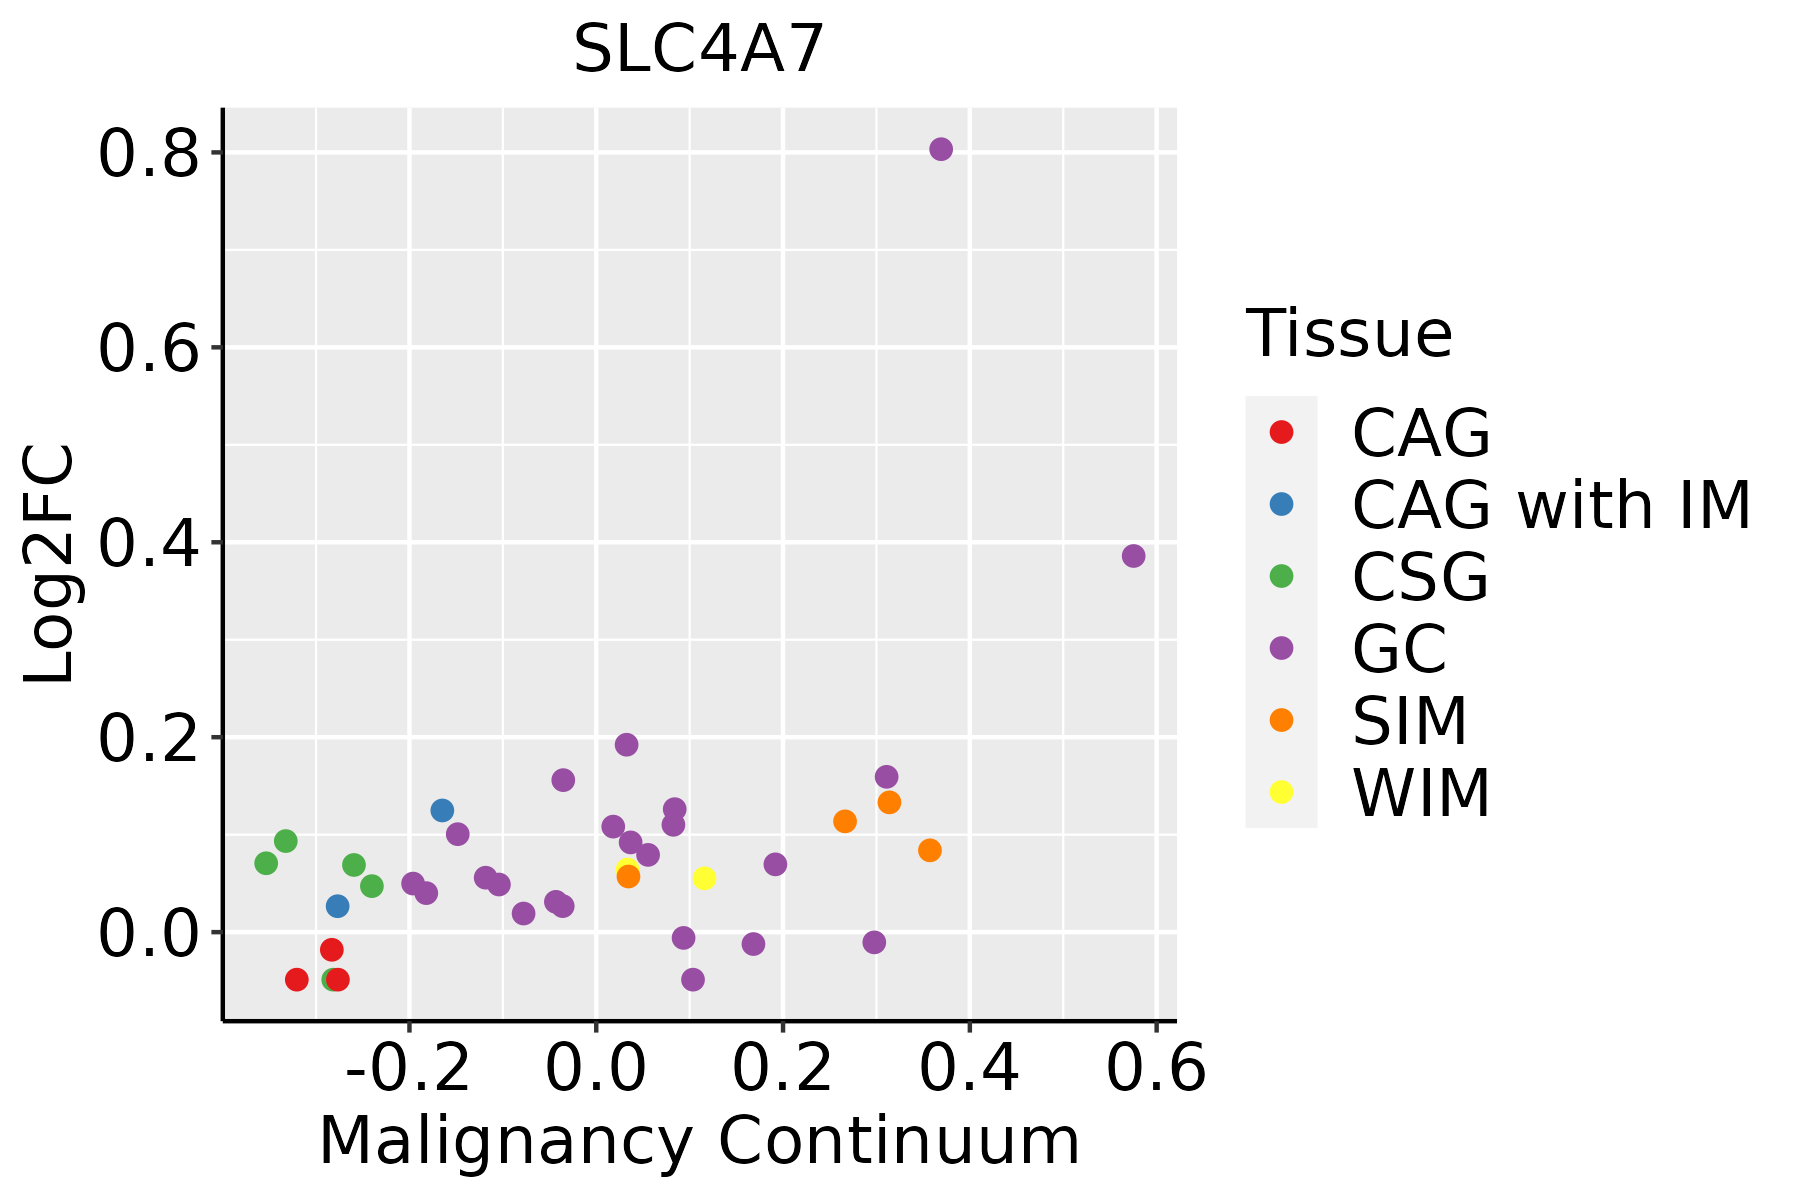 | CAG: Chronic atrophic gastritis |
| CAG with IM: Chronic atrophic gastritis with intestinal metaplasia | ||
| CSG: Chronic superficial gastritis | ||
| GC: Gastric cancer | ||
| SIM: Severe intestinal metaplasia | ||
| WIM: Wild intestinal metaplasia | ||
| Liver | 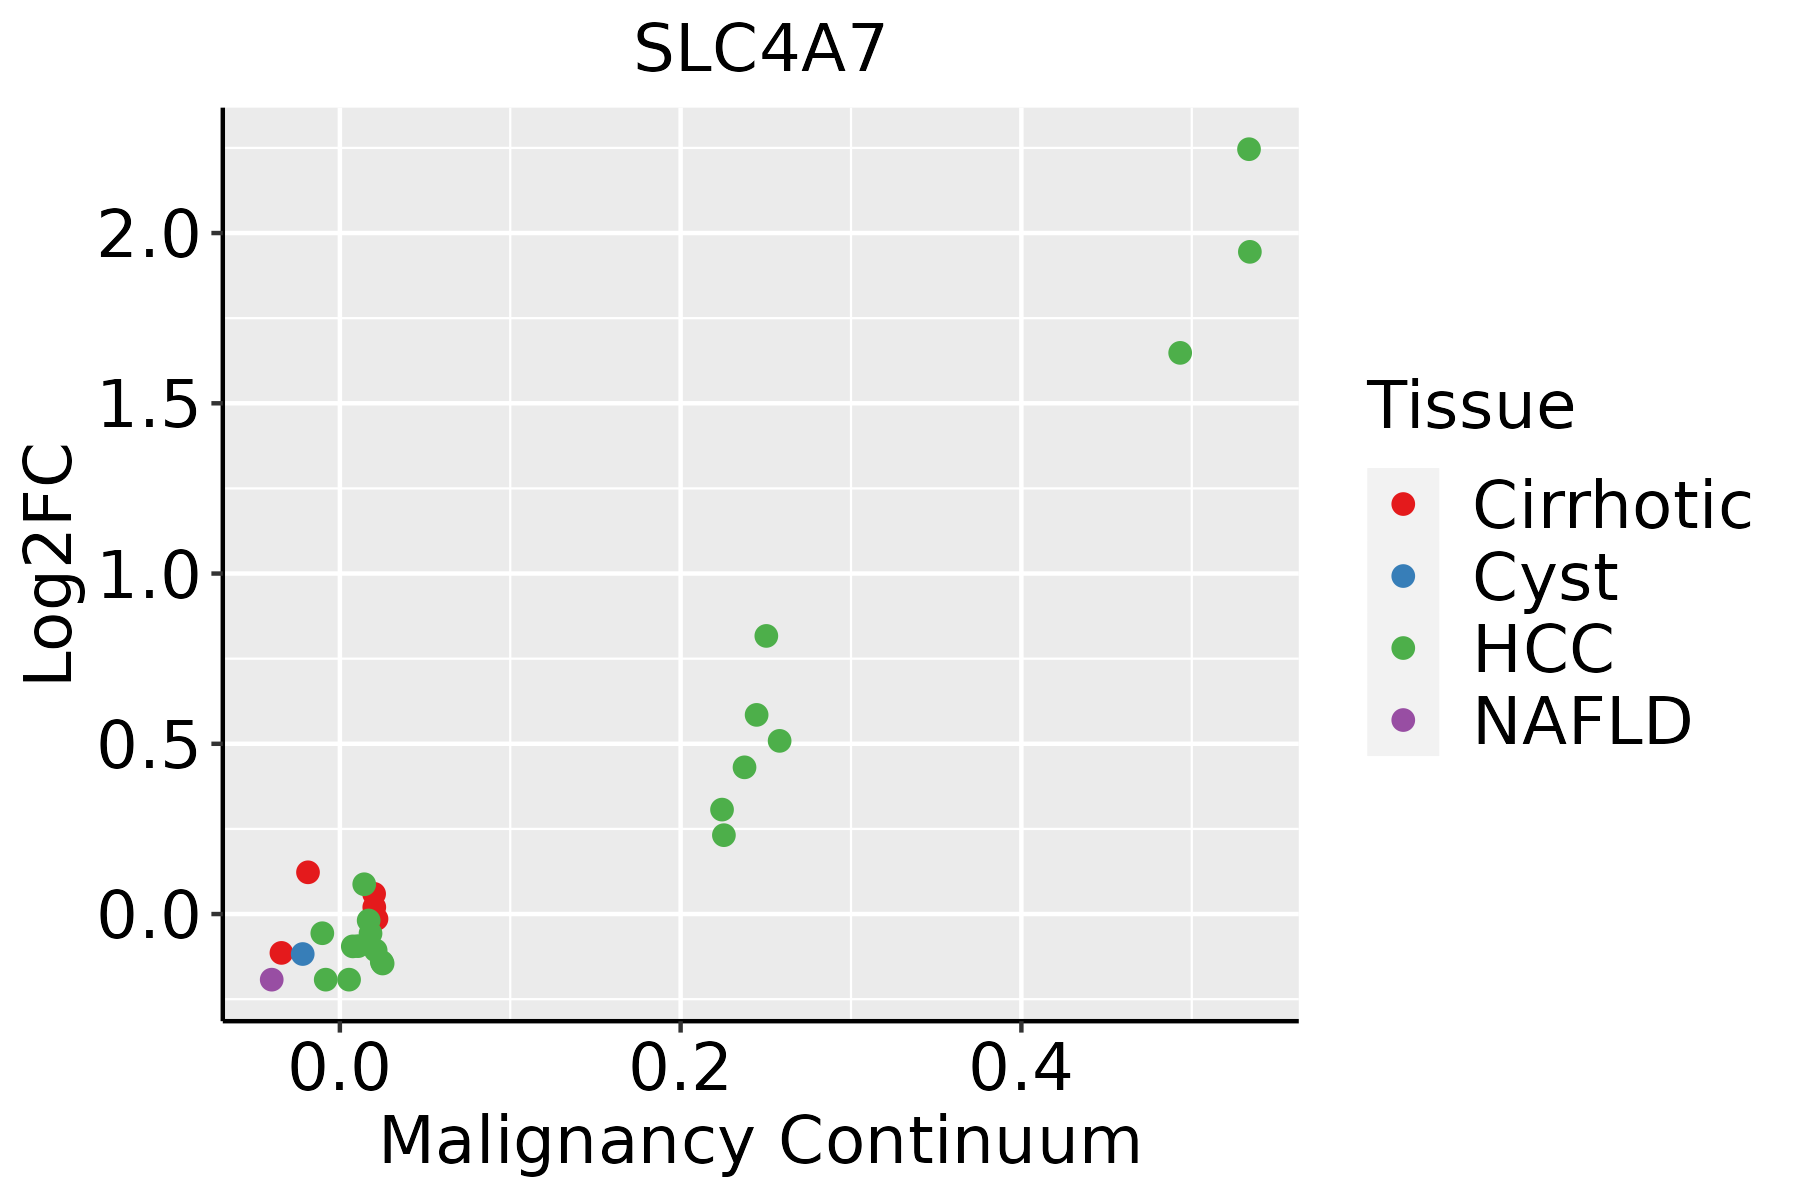 | HCC: Hepatocellular carcinoma |
| NAFLD: Non-alcoholic fatty liver disease | ||
| Lung | 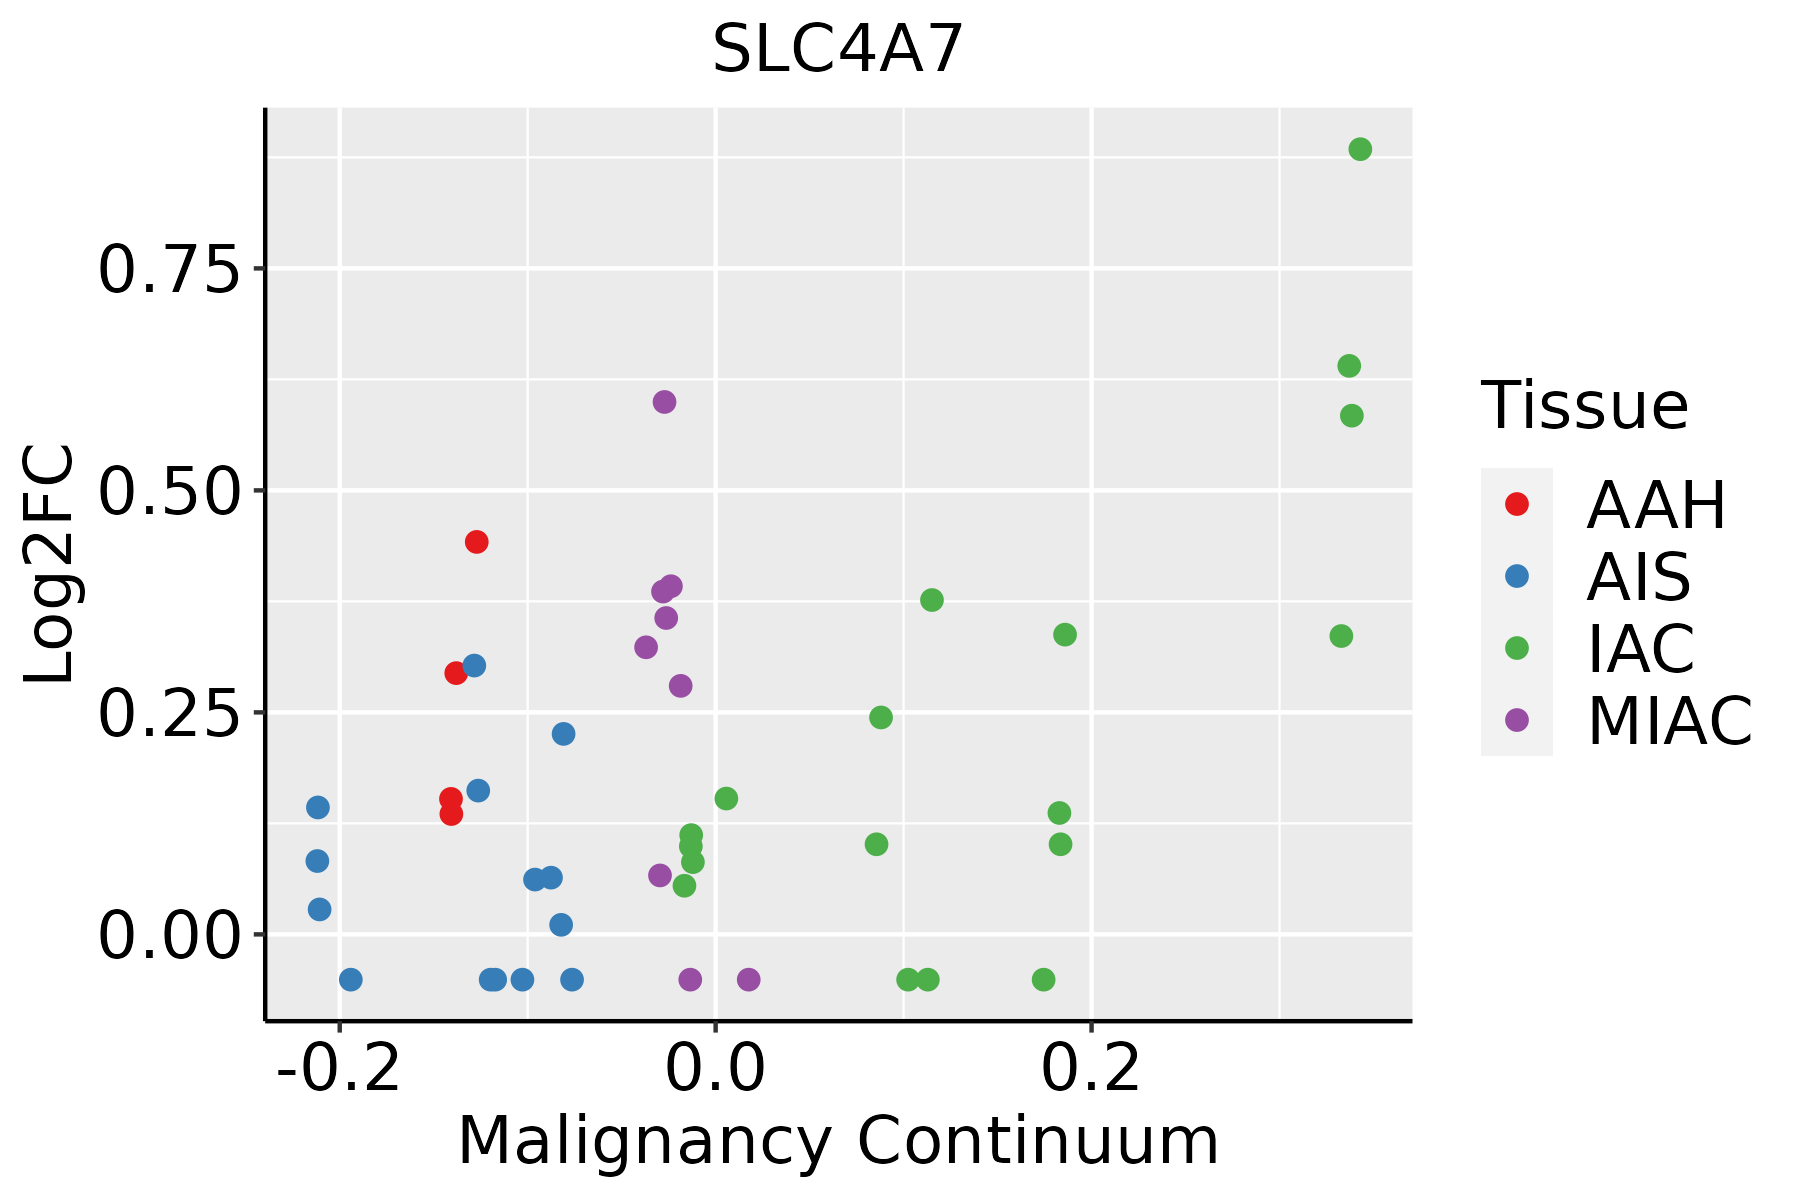 | AAH: Atypical adenomatous hyperplasia |
| AIS: Adenocarcinoma in situ | ||
| IAC: Invasive lung adenocarcinoma | ||
| MIA: Minimally invasive adenocarcinoma | ||
| Oral Cavity |  | EOLP: Erosive Oral lichen planus |
| LP: leukoplakia | ||
| NEOLP: Non-erosive oral lichen planus | ||
| OSCC: Oral squamous cell carcinoma | ||
| Prostate |  | BPH: Benign Prostatic Hyperplasia |
| Skin | 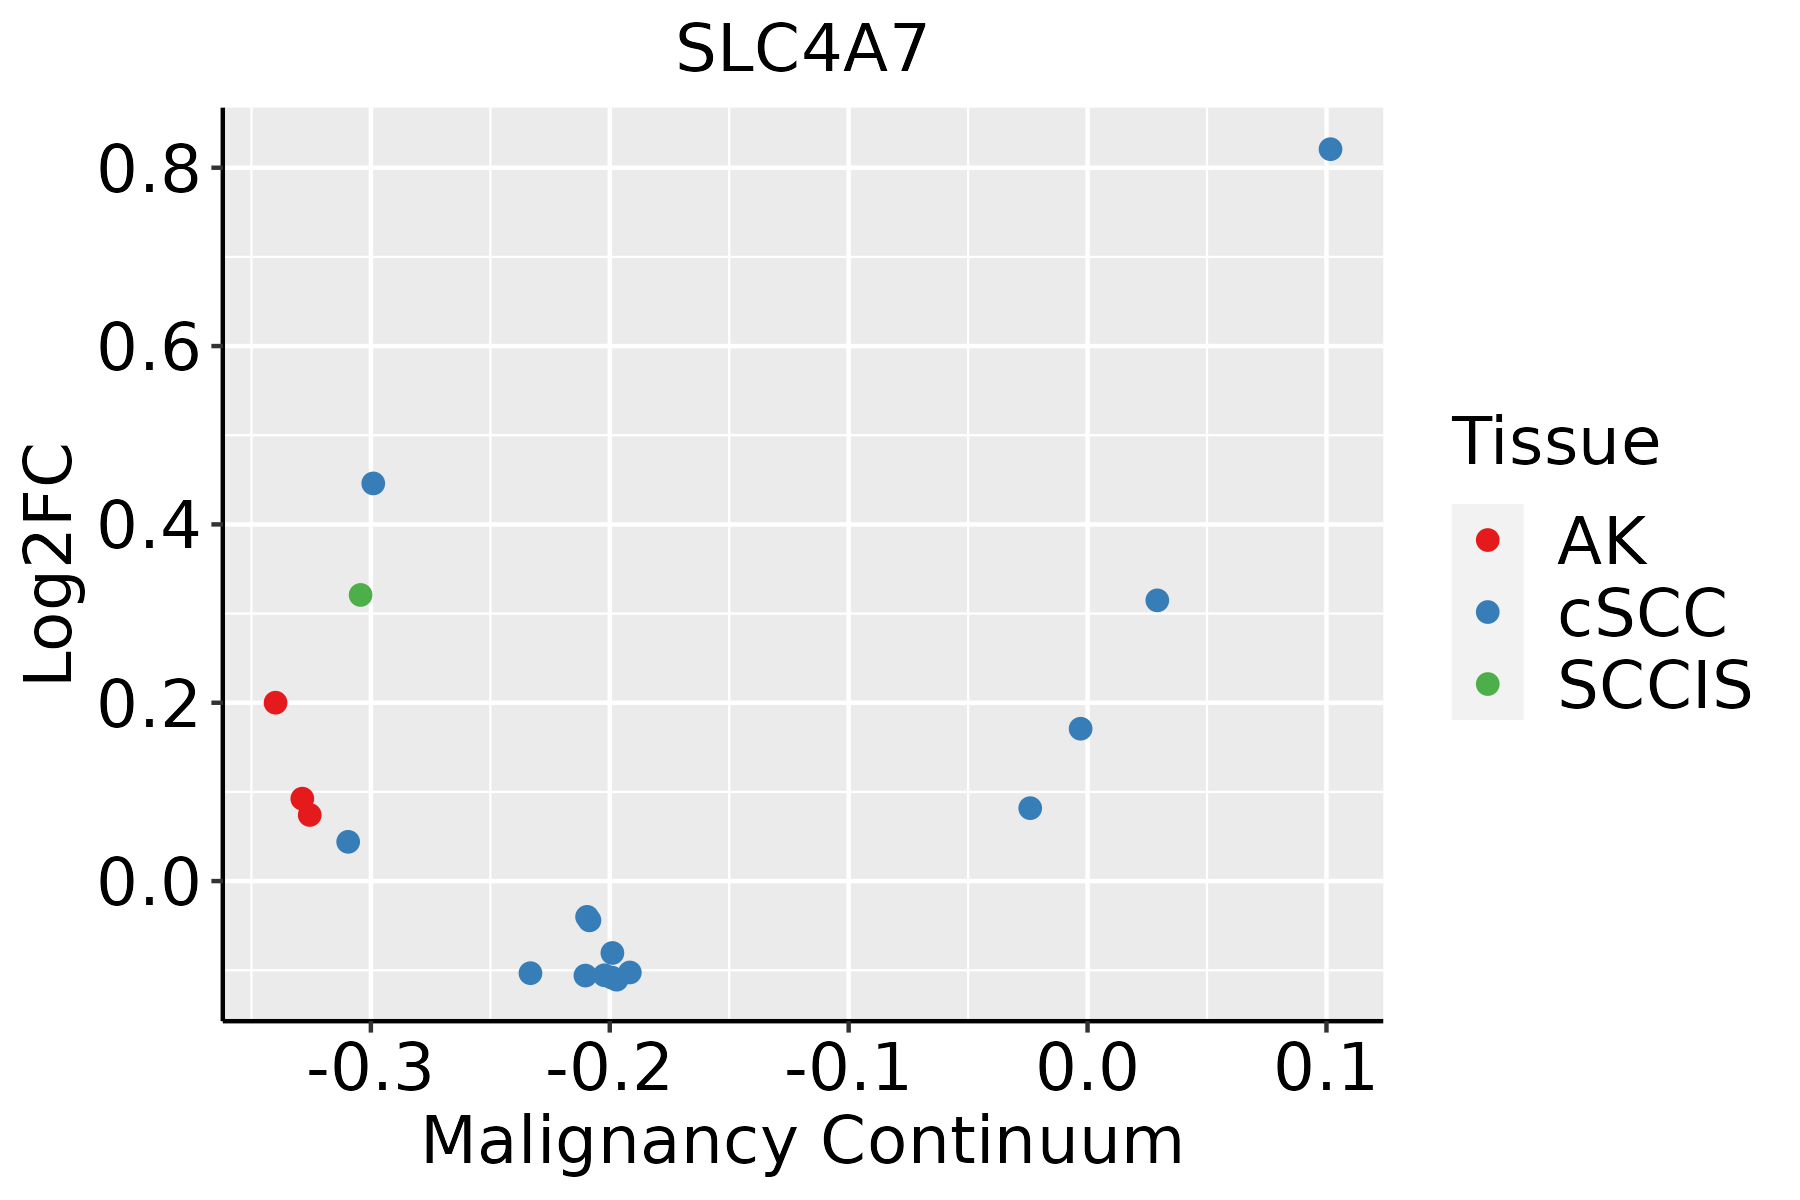 | AK: Actinic keratosis |
| cSCC: Cutaneous squamous cell carcinoma | ||
| SCCIS:squamous cell carcinoma in situ | ||
| Thyroid |  | ATC: Anaplastic thyroid cancer |
| HT: Hashimoto's thyroiditis | ||
| PTC: Papillary thyroid cancer |
| ∗log2FC in expression of this searched gene in stem-like cells from each diseased tissue sample relative to stem-like cells in normal samples in each tissue plotted against the malignancy continuum. Samples are colored based on if they are from different disease stage. |
Top |
Malignant transformation related pathway analysis |
| Find out the enriched GO biological processes and KEGG pathways involved in transition from healthy to precancer to cancer |
| Tissue | Disease Stage | Enriched GO biological Processes |
| Colorectum | AD |  |
| Colorectum | SER |  |
| Colorectum | MSS |  |
| Colorectum | MSI-H |  |
| Colorectum | FAP |  |
| ∗Top 15 enriched GO BP terms are showed in the bar plot of each disease state in each tissue. Each row represents a significant GO biological process which is colored according to the -log10(p.adjust). |
| Page: 1 2 3 4 5 6 7 8 9 |
| GO ID | Tissue | Disease Stage | Description | Gene Ratio | Bg Ratio | pvalue | p.adjust | Count |
| GO:0002064 | Colorectum | AD | epithelial cell development | 89/3918 | 220/18723 | 2.98e-11 | 3.52e-09 | 89 |
| GO:0035315 | Colorectum | AD | hair cell differentiation | 21/3918 | 47/18723 | 2.14e-04 | 2.82e-03 | 21 |
| GO:0060117 | Colorectum | AD | auditory receptor cell development | 12/3918 | 21/18723 | 3.02e-04 | 3.62e-03 | 12 |
| GO:0030004 | Colorectum | AD | cellular monovalent inorganic cation homeostasis | 36/3918 | 103/18723 | 6.80e-04 | 6.95e-03 | 36 |
| GO:0042491 | Colorectum | AD | inner ear auditory receptor cell differentiation | 17/3918 | 38/18723 | 8.26e-04 | 8.13e-03 | 17 |
| GO:0030641 | Colorectum | AD | regulation of cellular pH | 29/3918 | 81/18723 | 1.42e-03 | 1.22e-02 | 29 |
| GO:0042490 | Colorectum | AD | mechanoreceptor differentiation | 24/3918 | 67/18723 | 3.48e-03 | 2.52e-02 | 24 |
| GO:0051453 | Colorectum | AD | regulation of intracellular pH | 26/3918 | 75/18723 | 4.04e-03 | 2.82e-02 | 26 |
| GO:0006885 | Colorectum | AD | regulation of pH | 30/3918 | 91/18723 | 4.95e-03 | 3.32e-02 | 30 |
| GO:0009913 | Colorectum | AD | epidermal cell differentiation | 58/3918 | 202/18723 | 5.16e-03 | 3.42e-02 | 58 |
| GO:0008544 | Colorectum | AD | epidermis development | 87/3918 | 324/18723 | 5.99e-03 | 3.76e-02 | 87 |
| GO:0055067 | Colorectum | AD | monovalent inorganic cation homeostasis | 45/3918 | 151/18723 | 6.19e-03 | 3.88e-02 | 45 |
| GO:0015698 | Colorectum | AD | inorganic anion transport | 52/3918 | 180/18723 | 6.83e-03 | 4.22e-02 | 52 |
| GO:0060119 | Colorectum | AD | inner ear receptor cell development | 17/3918 | 45/18723 | 7.10e-03 | 4.33e-02 | 17 |
| GO:00020642 | Colorectum | MSS | epithelial cell development | 81/3467 | 220/18723 | 1.02e-10 | 1.06e-08 | 81 |
| GO:00601172 | Colorectum | MSS | auditory receptor cell development | 12/3467 | 21/18723 | 8.83e-05 | 1.41e-03 | 12 |
| GO:00353152 | Colorectum | MSS | hair cell differentiation | 19/3467 | 47/18723 | 3.88e-04 | 4.86e-03 | 19 |
| GO:00424911 | Colorectum | MSS | inner ear auditory receptor cell differentiation | 16/3467 | 38/18723 | 6.47e-04 | 7.06e-03 | 16 |
| GO:00601191 | Colorectum | MSS | inner ear receptor cell development | 17/3467 | 45/18723 | 1.89e-03 | 1.65e-02 | 17 |
| GO:00300042 | Colorectum | MSS | cellular monovalent inorganic cation homeostasis | 31/3467 | 103/18723 | 2.94e-03 | 2.27e-02 | 31 |
| Page: 1 2 3 4 5 |
| Pathway ID | Tissue | Disease Stage | Description | Gene Ratio | Bg Ratio | pvalue | p.adjust | qvalue | Count |
| Page: 1 |
Top |
Cell-cell communication analysis |
| Identification of potential cell-cell interactions between two cell types and their ligand-receptor pairs for different disease states |
| Ligand | Receptor | LRpair | Pathway | Tissue | Disease Stage |
| Page: 1 |
Top |
Single-cell gene regulatory network inference analysis |
| Find out the significant the regulons (TFs) and the target genes of each regulon across cell types for different disease states |
| TF | Cell Type | Tissue | Disease Stage | Target Gene | RSS | Regulon Activity |
| ∗The dot plots of a searched regulon are shown for all cell subpopulations in each disease state of each tissue based on the regulon specific score inferred using pySCENIC and by calculating the average expression. |
| Page: 1 |
Top |
Somatic mutation of malignant transformation related genes |
| Annotation of somatic variants for genes involved in malignant transformation |
| Hugo Symbol | Variant Class | Variant Classification | dbSNP RS | HGVSc | HGVSp | HGVSp Short | SWISSPROT | BIOTYPE | SIFT | PolyPhen | Tumor Sample Barcode | Tissue | Histology | Sex | Age | Stage | Therapy Types | Drugs | Outcome |
| SLC4A7 | insertion | Frame_Shift_Ins | novel | c.683_684insAAGAAACAAAGCAG | p.Asn229ArgfsTer23 | p.N229Rfs*23 | Q9Y6M7 | protein_coding | TCGA-FY-A4B0-01 | Thyroid | thyroid carcinoma | Male | >=65 | I/II | Hormone Therapy | synthroid | SD | ||
| SLC4A7 | insertion | Nonsense_Mutation | novel | c.1532_1533insAAA | p.Tyr511delinsTer | p.Y511delins* | Q9Y6M7 | protein_coding | TCGA-IM-A41Z-01 | Thyroid | thyroid carcinoma | Female | <65 | I/II | Hormone Therapy | synthroid | SD | ||
| SLC4A7 | insertion | In_Frame_Ins | novel | c.1530_1531insAATCAAAAAAAATTTTAT | p.Ala510_Tyr511insAsnGlnLysLysPheTyr | p.A510_Y511insNQKKFY | Q9Y6M7 | protein_coding | TCGA-IM-A41Z-01 | Thyroid | thyroid carcinoma | Female | <65 | I/II | Hormone Therapy | synthroid | SD |
| Page: 1 2 3 4 5 6 7 8 9 10 11 12 13 14 |
Top |
Related drugs of malignant transformation related genes |
| Identification of chemicals and drugs interact with genes involved in malignant transfromation |
| (DGIdb 4.0) |
| Entrez ID | Symbol | Category | Interaction Types | Drug Claim Name | Drug Name | PMIDs |
| Page: 1 |

Copyright 2023-Present -The University of Texas Health Science Center at Houston |