
|
|||||
|
 | |
| |
| |
| |
| |
| |
|
Gene: MYO1A |
Gene summary for MYO1A |
| Gene information | Species | Human | Gene symbol | MYO1A | Gene ID | 4640 |
| Gene name | myosin IA | |
| Gene Alias | BBMI | |
| Cytomap | 12q13.3 | |
| Gene Type | protein-coding | GO ID | GO:0003008 | UniProtAcc | B2R643 |
Top |
Malignant transformation analysis |
| Identification of the aberrant gene expression in precancerous and cancerous lesions by comparing the gene expression of stem-like cells in diseased tissues with normal stem cells |
| Entrez ID | Symbol | Replicates | Species | Organ | Tissue | Adj P-value | Log2FC | Malignancy |
| 4640 | MYO1A | Pat01-B | Human | Stomach | GC | 1.72e-39 | 7.85e-01 | 0.5754 |
| 4640 | MYO1A | Pat03-B | Human | Stomach | GC | 2.21e-25 | 6.29e-01 | 0.3693 |
| 4640 | MYO1A | Pat05-B | Human | Stomach | GC | 2.19e-02 | 2.15e-01 | -0.0353 |
| 4640 | MYO1A | Pat17-B | Human | Stomach | GC | 3.01e-08 | 2.97e-01 | 0.3109 |
| 4640 | MYO1A | SIM_1 | Human | Stomach | SIM | 2.40e-03 | 2.90e-01 | 0.3573 |
| 4640 | MYO1A | SIM_2 | Human | Stomach | SIM | 1.23e-02 | 1.44e-01 | 0.3139 |
| Page: 1 |
| Tissue | Expression Dynamics | Abbreviation |
| GC | 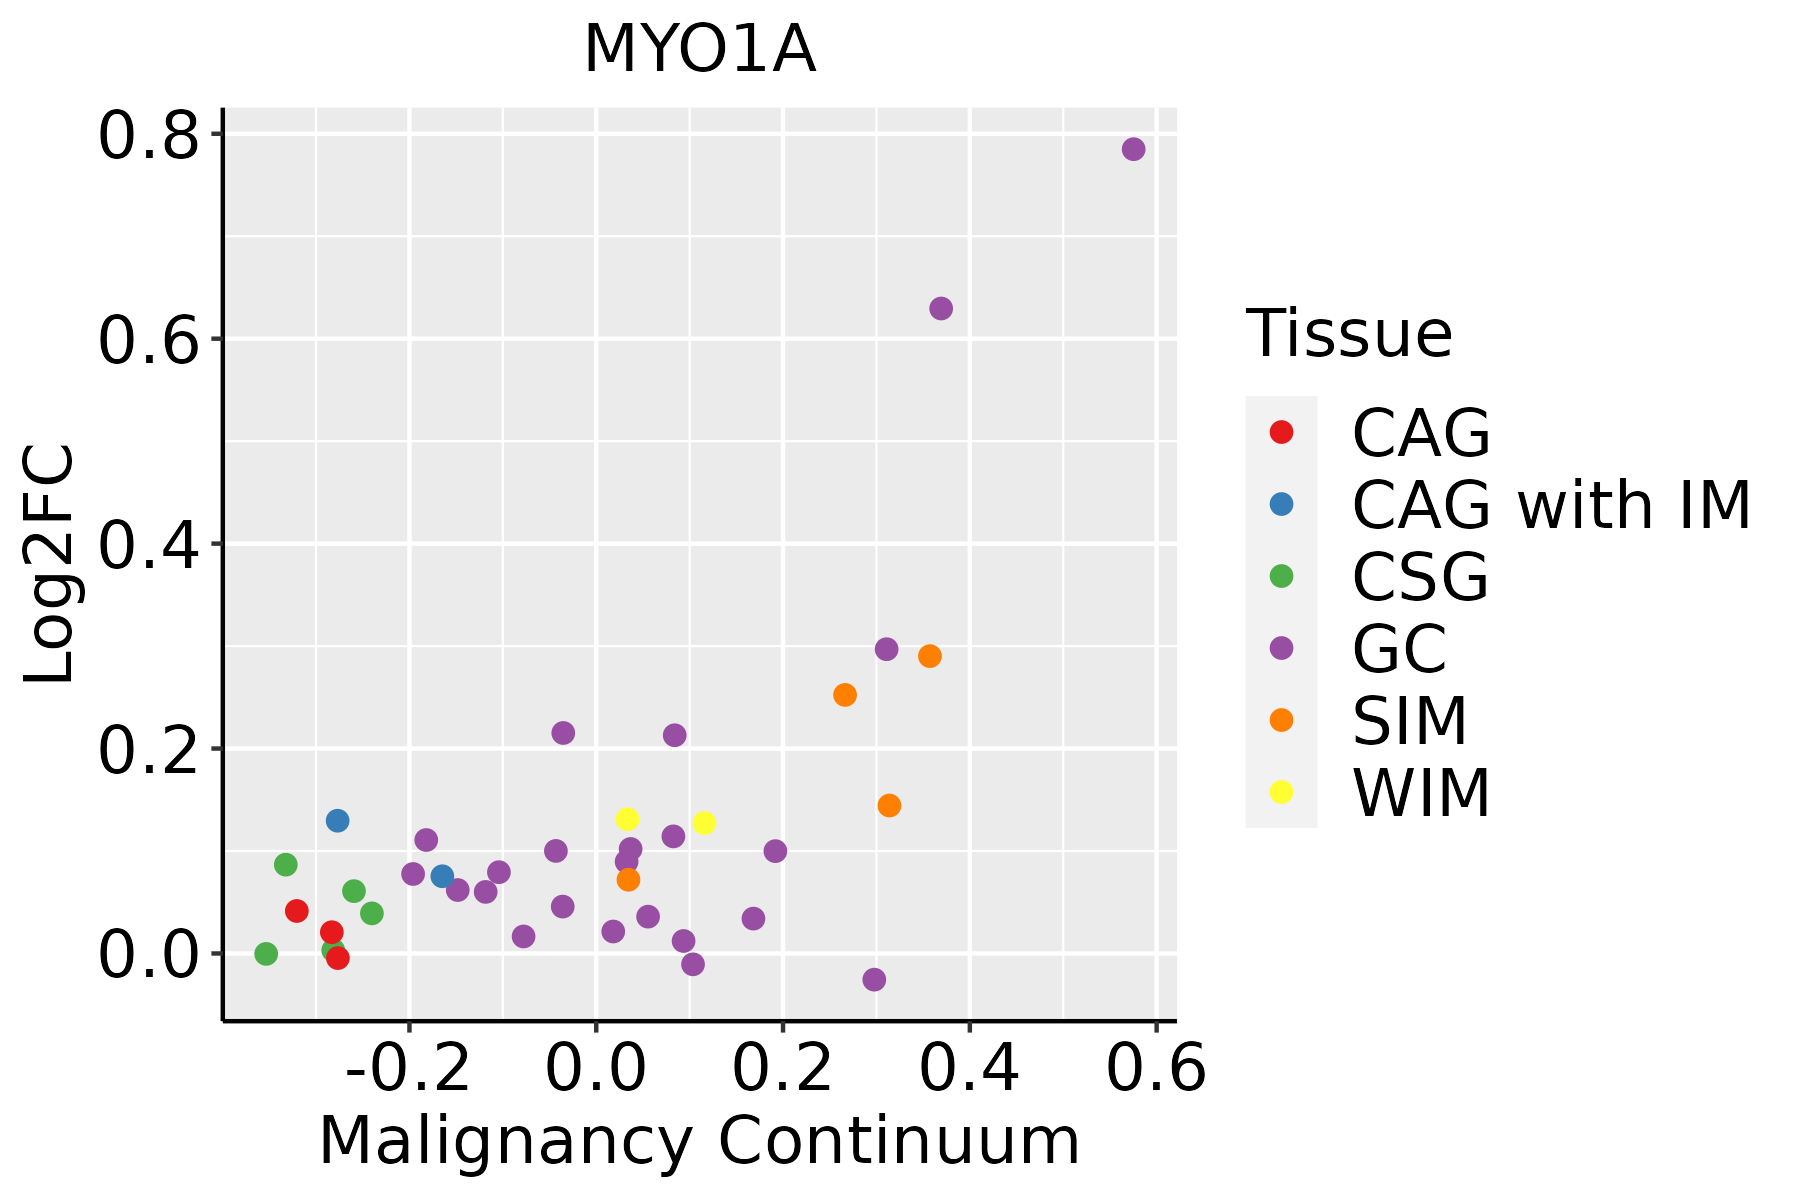 | CAG: Chronic atrophic gastritis |
| CAG with IM: Chronic atrophic gastritis with intestinal metaplasia | ||
| CSG: Chronic superficial gastritis | ||
| GC: Gastric cancer | ||
| SIM: Severe intestinal metaplasia | ||
| WIM: Wild intestinal metaplasia |
| ∗log2FC in expression of this searched gene in stem-like cells from each diseased tissue sample relative to stem-like cells in normal samples in each tissue plotted against the malignancy continuum. Samples are colored based on if they are from different disease stage. |
Top |
Malignant transformation related pathway analysis |
| Find out the enriched GO biological processes and KEGG pathways involved in transition from healthy to precancer to cancer |
| Tissue | Disease Stage | Enriched GO biological Processes |
| Colorectum | AD |  |
| Colorectum | SER |  |
| Colorectum | MSS |  |
| Colorectum | MSI-H |  |
| Colorectum | FAP |  |
| ∗Top 15 enriched GO BP terms are showed in the bar plot of each disease state in each tissue. Each row represents a significant GO biological process which is colored according to the -log10(p.adjust). |
| Page: 1 2 3 4 5 6 7 8 9 |
| GO ID | Tissue | Disease Stage | Description | Gene Ratio | Bg Ratio | pvalue | p.adjust | Count |
| GO:00070156 | Stomach | GC | actin filament organization | 67/1159 | 442/18723 | 7.96e-12 | 2.20e-09 | 67 |
| GO:00325285 | Stomach | GC | microvillus organization | 13/1159 | 24/18723 | 2.41e-10 | 3.75e-08 | 13 |
| GO:00300335 | Stomach | GC | microvillus assembly | 8/1159 | 16/18723 | 1.73e-06 | 7.78e-05 | 8 |
| GO:00300485 | Stomach | GC | actin filament-based movement | 22/1159 | 127/18723 | 1.03e-05 | 3.42e-04 | 22 |
| GO:00995155 | Stomach | GC | actin filament-based transport | 8/1159 | 21/18723 | 2.07e-05 | 6.33e-04 | 8 |
| GO:00300505 | Stomach | GC | vesicle transport along actin filament | 7/1159 | 19/18723 | 8.91e-05 | 1.85e-03 | 7 |
| GO:003252841 | Stomach | SIM | microvillus organization | 9/708 | 24/18723 | 1.18e-07 | 9.94e-06 | 9 |
| GO:000701541 | Stomach | SIM | actin filament organization | 38/708 | 442/18723 | 2.29e-06 | 1.15e-04 | 38 |
| GO:003003341 | Stomach | SIM | microvillus assembly | 5/708 | 16/18723 | 2.35e-04 | 4.64e-03 | 5 |
| Page: 1 |
| Pathway ID | Tissue | Disease Stage | Description | Gene Ratio | Bg Ratio | pvalue | p.adjust | qvalue | Count |
| hsa0513012 | Stomach | GC | Pathogenic Escherichia coli infection | 43/708 | 197/8465 | 2.99e-09 | 6.39e-08 | 4.50e-08 | 43 |
| hsa0513013 | Stomach | GC | Pathogenic Escherichia coli infection | 43/708 | 197/8465 | 2.99e-09 | 6.39e-08 | 4.50e-08 | 43 |
| hsa05130101 | Stomach | SIM | Pathogenic Escherichia coli infection | 31/465 | 197/8465 | 8.76e-08 | 1.66e-06 | 1.34e-06 | 31 |
| hsa05130111 | Stomach | SIM | Pathogenic Escherichia coli infection | 31/465 | 197/8465 | 8.76e-08 | 1.66e-06 | 1.34e-06 | 31 |
| Page: 1 |
Top |
Cell-cell communication analysis |
| Identification of potential cell-cell interactions between two cell types and their ligand-receptor pairs for different disease states |
| Ligand | Receptor | LRpair | Pathway | Tissue | Disease Stage |
| Page: 1 |
Top |
Single-cell gene regulatory network inference analysis |
| Find out the significant the regulons (TFs) and the target genes of each regulon across cell types for different disease states |
| TF | Cell Type | Tissue | Disease Stage | Target Gene | RSS | Regulon Activity |
| ∗The dot plots of a searched regulon are shown for all cell subpopulations in each disease state of each tissue based on the regulon specific score inferred using pySCENIC and by calculating the average expression. |
| Page: 1 |
Top |
Somatic mutation of malignant transformation related genes |
| Annotation of somatic variants for genes involved in malignant transformation |
| Hugo Symbol | Variant Class | Variant Classification | dbSNP RS | HGVSc | HGVSp | HGVSp Short | SWISSPROT | BIOTYPE | SIFT | PolyPhen | Tumor Sample Barcode | Tissue | Histology | Sex | Age | Stage | Therapy Types | Drugs | Outcome |
| MYO1A | deletion | Frame_Shift_Del | novel | c.520delN | p.Leu174SerfsTer15 | p.L174Sfs*15 | Q9UBC5 | protein_coding | TCGA-CG-4465-01 | Stomach | stomach adenocarcinoma | Female | >=65 | III/IV | Chemotherapy | cisplatin | SD |
| Page: 1 2 3 4 5 6 7 8 9 10 11 12 13 14 |
Top |
Related drugs of malignant transformation related genes |
| Identification of chemicals and drugs interact with genes involved in malignant transfromation |
| (DGIdb 4.0) |
| Entrez ID | Symbol | Category | Interaction Types | Drug Claim Name | Drug Name | PMIDs |
| Page: 1 |

Copyright 2023-Present -The University of Texas Health Science Center at Houston |