
|
|||||
|
 | |
| |
| |
| |
| |
| |
|
Gene: ASAP2 |
Gene summary for ASAP2 |
| Gene information | Species | Human | Gene symbol | ASAP2 | Gene ID | 8853 |
| Gene name | ArfGAP with SH3 domain, ankyrin repeat and PH domain 2 | |
| Gene Alias | AMAP2 | |
| Cytomap | 2p25.1 | |
| Gene Type | protein-coding | GO ID | GO:0008150 | UniProtAcc | O43150 |
Top |
Malignant transformation analysis |
| Identification of the aberrant gene expression in precancerous and cancerous lesions by comparing the gene expression of stem-like cells in diseased tissues with normal stem cells |
| Entrez ID | Symbol | Replicates | Species | Organ | Tissue | Adj P-value | Log2FC | Malignancy |
| 8853 | ASAP2 | CCI_1 | Human | Cervix | CC | 1.19e-10 | 8.40e-01 | 0.528 |
| 8853 | ASAP2 | CCI_3 | Human | Cervix | CC | 2.51e-10 | 7.88e-01 | 0.516 |
| 8853 | ASAP2 | sample3 | Human | Cervix | CC | 1.36e-04 | 1.90e-01 | 0.1387 |
| 8853 | ASAP2 | T3 | Human | Cervix | CC | 9.54e-05 | 2.34e-01 | 0.1389 |
| 8853 | ASAP2 | HTA11_347_2000001011 | Human | Colorectum | AD | 2.04e-07 | 4.48e-01 | -0.1954 |
| 8853 | ASAP2 | HTA11_866_3004761011 | Human | Colorectum | AD | 4.94e-05 | -3.11e-01 | 0.096 |
| 8853 | ASAP2 | HTA11_10711_2000001011 | Human | Colorectum | AD | 7.23e-03 | -3.61e-01 | 0.0338 |
| 8853 | ASAP2 | HTA11_99999974143_84620 | Human | Colorectum | MSS | 4.30e-06 | -3.35e-01 | 0.3005 |
| 8853 | ASAP2 | A015-C-203 | Human | Colorectum | FAP | 2.61e-22 | -4.07e-01 | -0.1294 |
| 8853 | ASAP2 | A014-C-040 | Human | Colorectum | FAP | 1.45e-02 | -3.40e-01 | -0.1184 |
| 8853 | ASAP2 | A002-C-201 | Human | Colorectum | FAP | 4.24e-06 | -2.49e-01 | 0.0324 |
| 8853 | ASAP2 | A001-C-119 | Human | Colorectum | FAP | 5.12e-06 | -3.19e-01 | -0.1557 |
| 8853 | ASAP2 | A001-C-108 | Human | Colorectum | FAP | 1.01e-11 | -1.93e-01 | -0.0272 |
| 8853 | ASAP2 | A002-C-205 | Human | Colorectum | FAP | 4.48e-14 | -3.36e-01 | -0.1236 |
| 8853 | ASAP2 | A015-C-006 | Human | Colorectum | FAP | 8.36e-11 | -3.41e-01 | -0.0994 |
| 8853 | ASAP2 | A015-C-106 | Human | Colorectum | FAP | 3.11e-05 | -1.51e-01 | -0.0511 |
| 8853 | ASAP2 | A002-C-114 | Human | Colorectum | FAP | 6.64e-13 | -4.09e-01 | -0.1561 |
| 8853 | ASAP2 | A015-C-104 | Human | Colorectum | FAP | 1.29e-21 | -2.71e-01 | -0.1899 |
| 8853 | ASAP2 | A001-C-014 | Human | Colorectum | FAP | 3.59e-09 | -1.65e-01 | 0.0135 |
| 8853 | ASAP2 | A002-C-016 | Human | Colorectum | FAP | 3.27e-13 | -2.81e-01 | 0.0521 |
| Page: 1 2 3 4 5 6 |
| Tissue | Expression Dynamics | Abbreviation |
| Cervix | 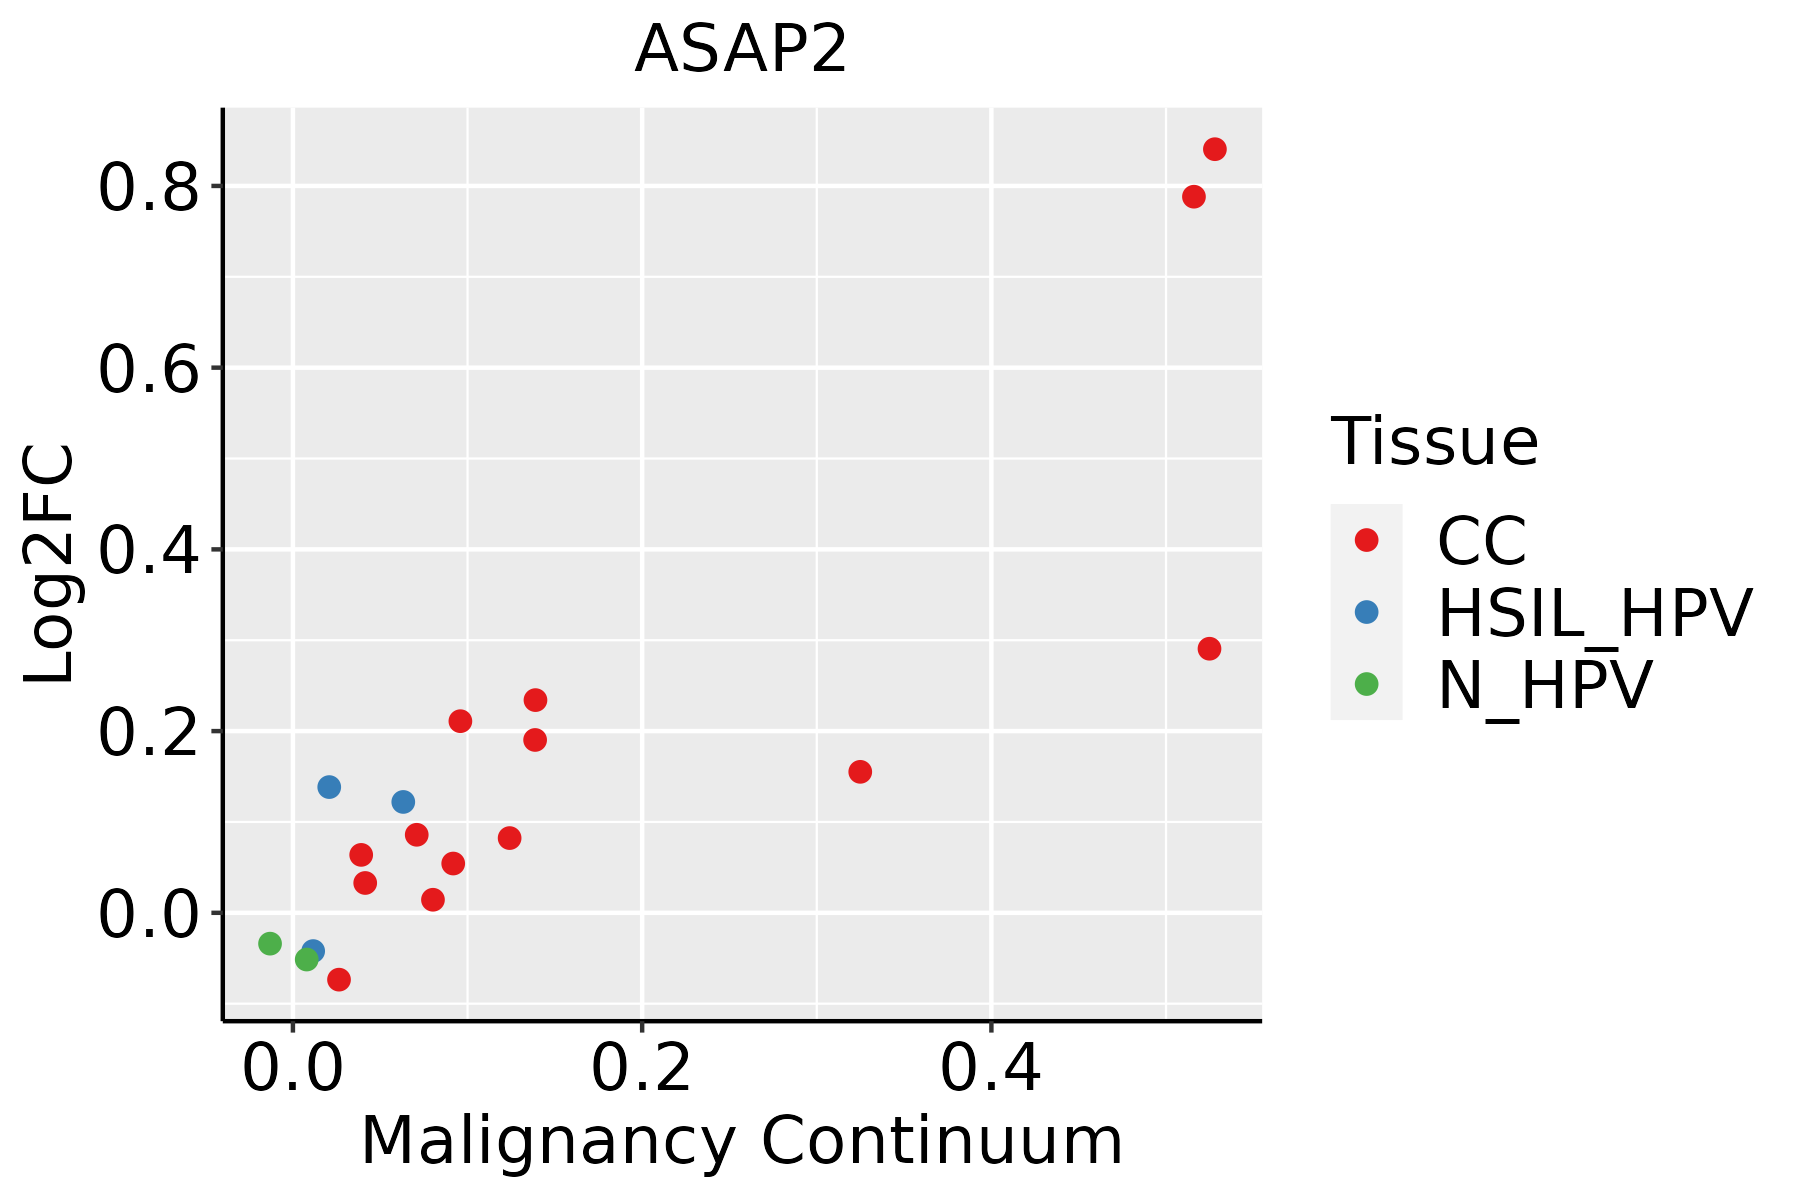 | CC: Cervix cancer |
| HSIL_HPV: HPV-infected high-grade squamous intraepithelial lesions | ||
| N_HPV: HPV-infected normal cervix | ||
| Colorectum (GSE201348) |  | FAP: Familial adenomatous polyposis |
| CRC: Colorectal cancer | ||
| Colorectum (HTA11) |  | AD: Adenomas |
| SER: Sessile serrated lesions | ||
| MSI-H: Microsatellite-high colorectal cancer | ||
| MSS: Microsatellite stable colorectal cancer | ||
| Esophagus | 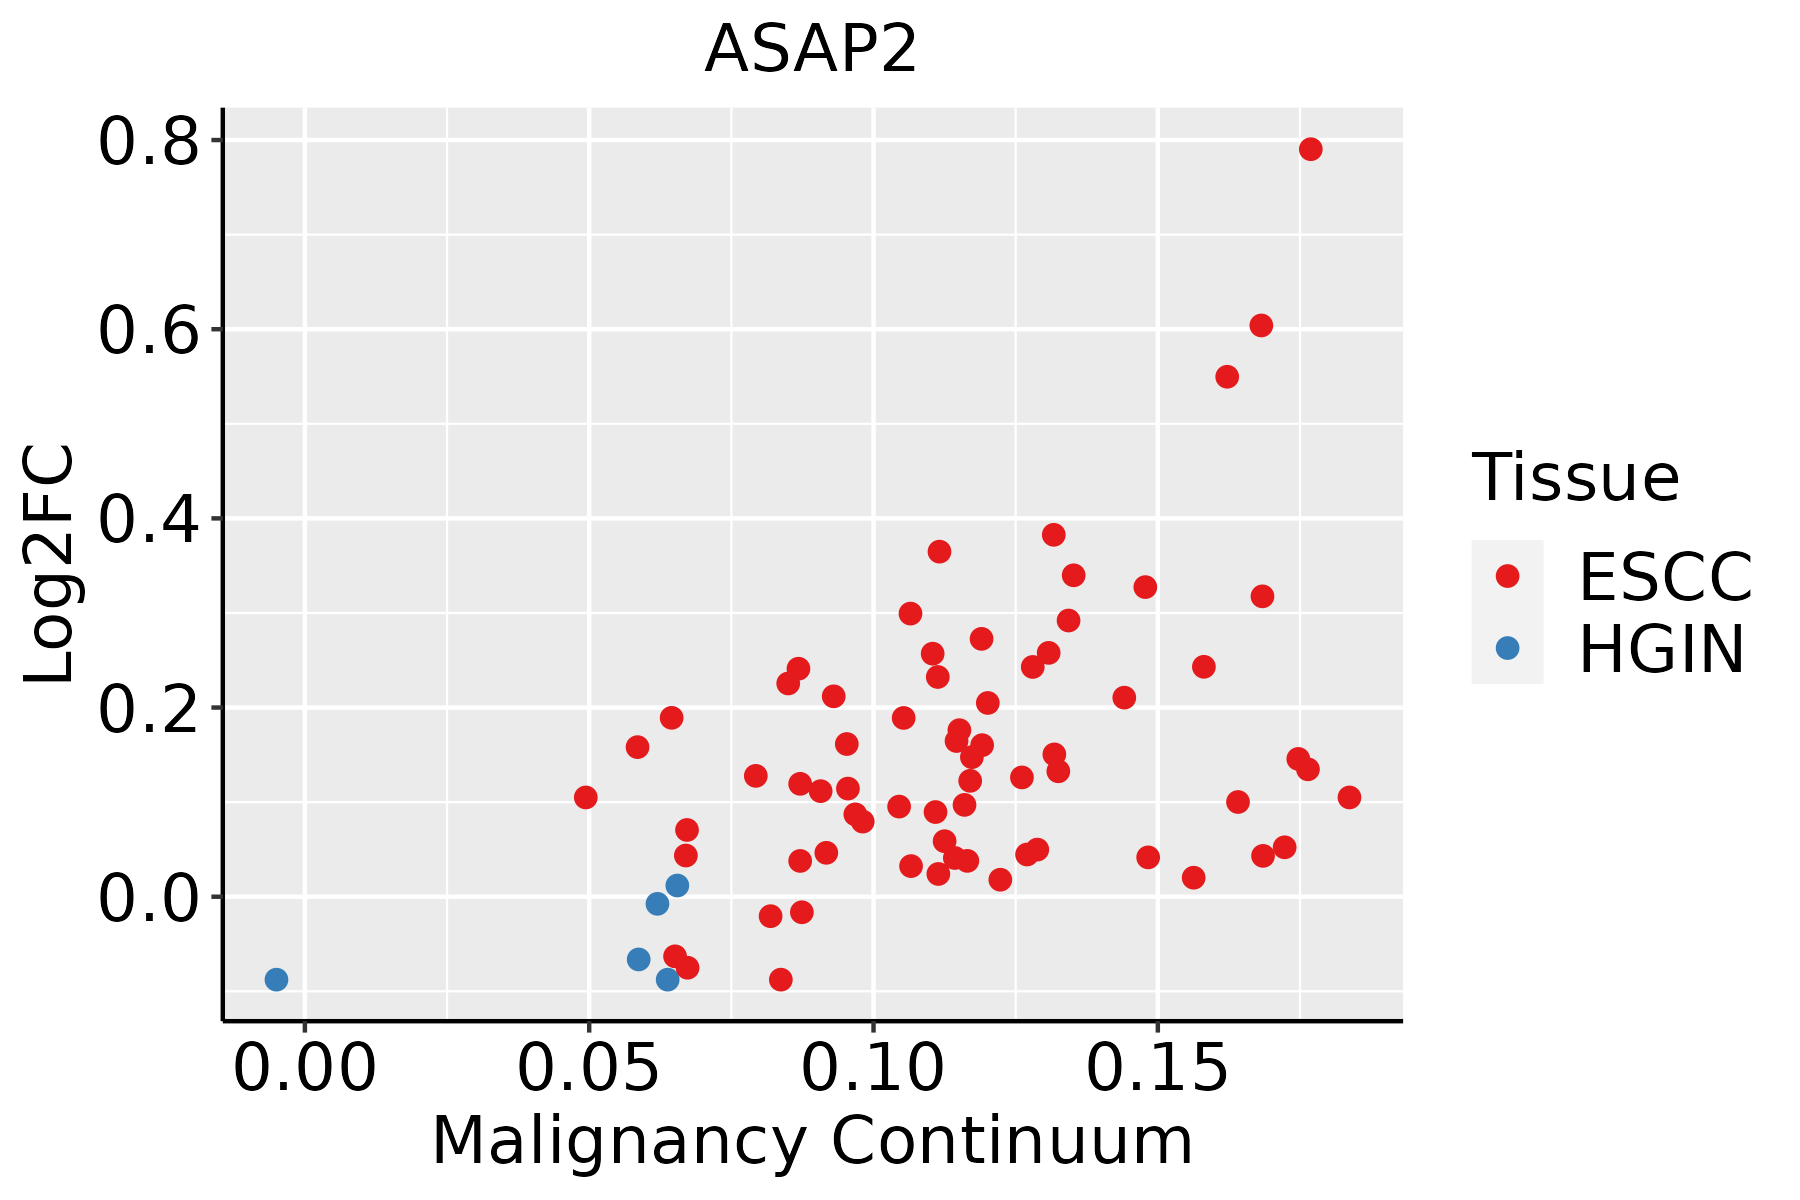 | ESCC: Esophageal squamous cell carcinoma |
| HGIN: High-grade intraepithelial neoplasias | ||
| LGIN: Low-grade intraepithelial neoplasias | ||
| Oral Cavity |  | EOLP: Erosive Oral lichen planus |
| LP: leukoplakia | ||
| NEOLP: Non-erosive oral lichen planus | ||
| OSCC: Oral squamous cell carcinoma | ||
| Thyroid | 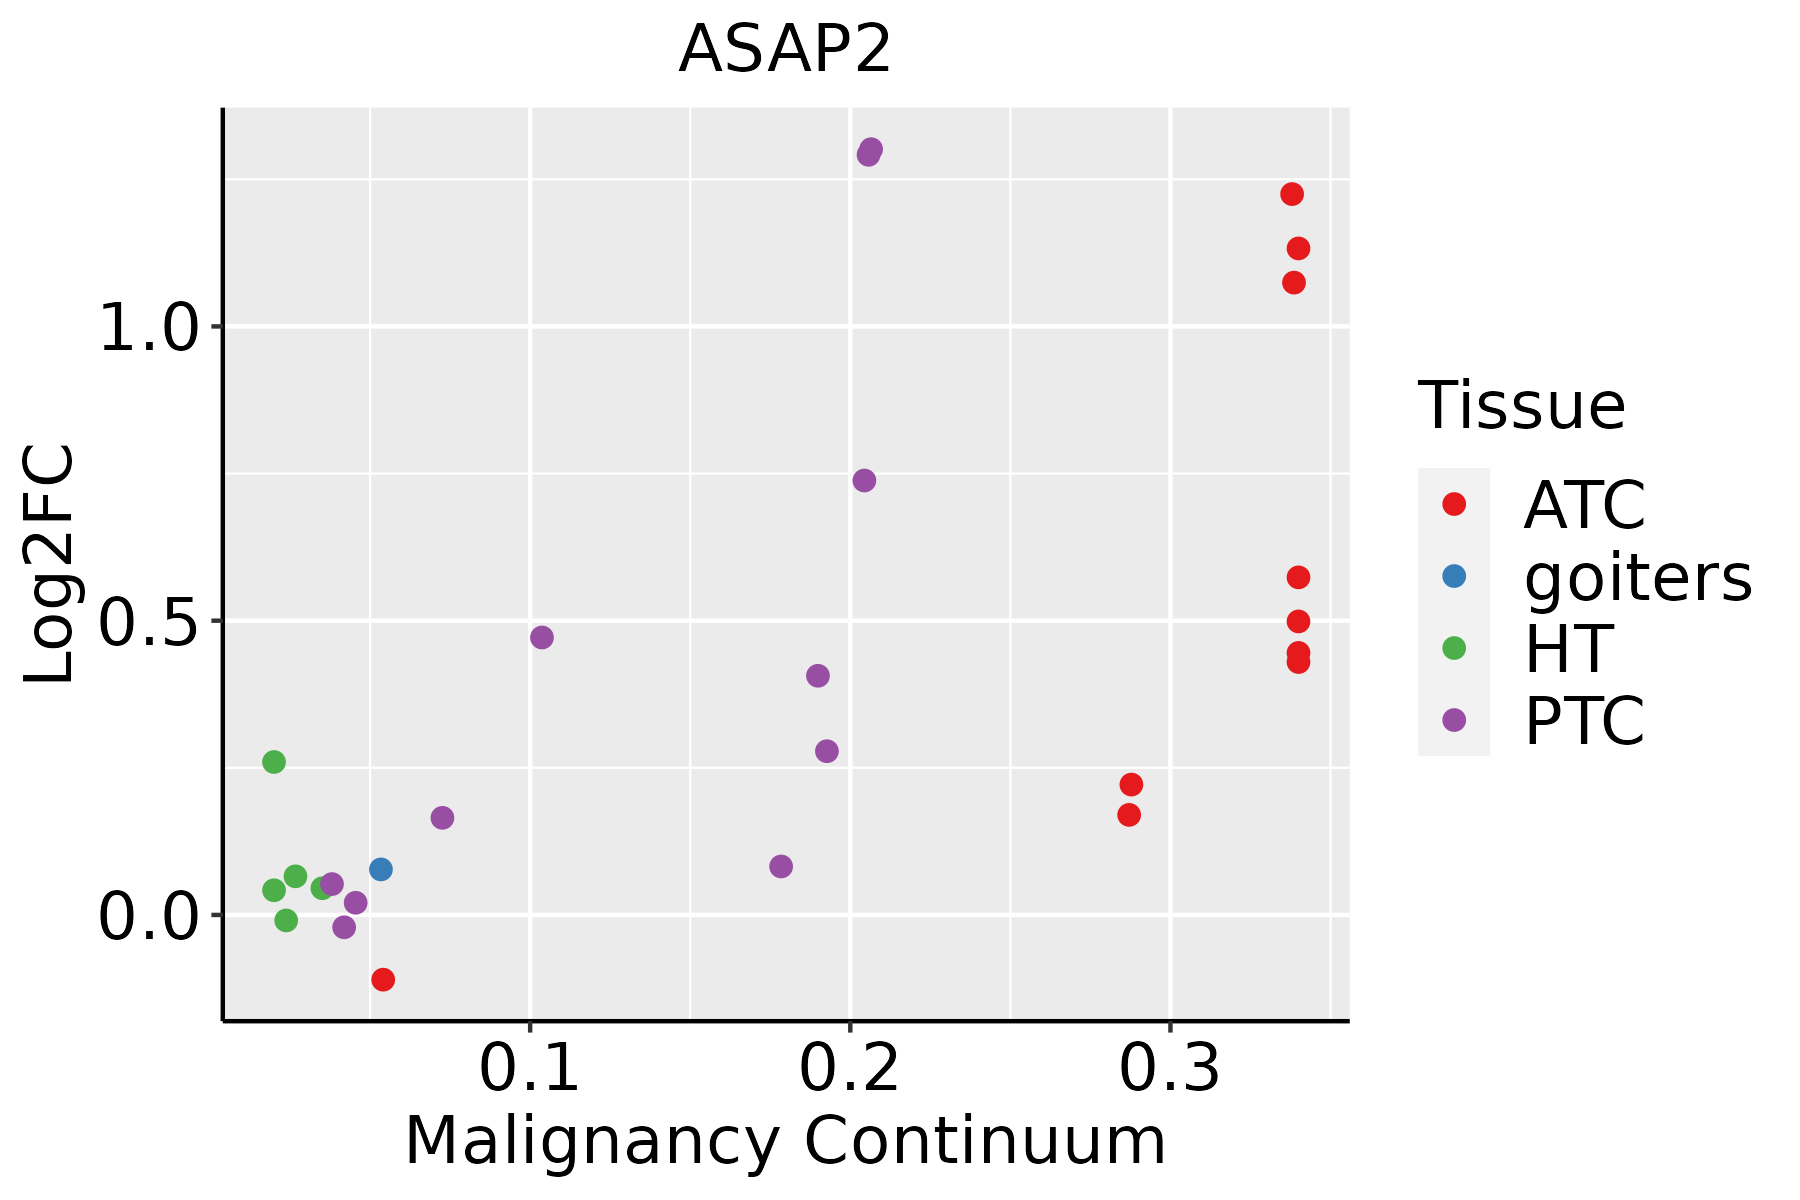 | ATC: Anaplastic thyroid cancer |
| HT: Hashimoto's thyroiditis | ||
| PTC: Papillary thyroid cancer |
| ∗log2FC in expression of this searched gene in stem-like cells from each diseased tissue sample relative to stem-like cells in normal samples in each tissue plotted against the malignancy continuum. Samples are colored based on if they are from different disease stage. |
Top |
Malignant transformation related pathway analysis |
| Find out the enriched GO biological processes and KEGG pathways involved in transition from healthy to precancer to cancer |
| Tissue | Disease Stage | Enriched GO biological Processes |
| Colorectum | AD |  |
| Colorectum | SER |  |
| Colorectum | MSS |  |
| Colorectum | MSI-H |  |
| Colorectum | FAP |  |
| ∗Top 15 enriched GO BP terms are showed in the bar plot of each disease state in each tissue. Each row represents a significant GO biological process which is colored according to the -log10(p.adjust). |
| Page: 1 2 3 4 5 6 7 8 9 |
| GO ID | Tissue | Disease Stage | Description | Gene Ratio | Bg Ratio | pvalue | p.adjust | Count |
| GO:00430877 | Cervix | CC | regulation of GTPase activity | 79/2311 | 348/18723 | 4.21e-08 | 2.60e-06 | 79 |
| GO:00435476 | Cervix | CC | positive regulation of GTPase activity | 53/2311 | 255/18723 | 8.72e-05 | 1.16e-03 | 53 |
| GO:0043087 | Colorectum | AD | regulation of GTPase activity | 110/3918 | 348/18723 | 1.64e-06 | 5.03e-05 | 110 |
| GO:0043547 | Colorectum | AD | positive regulation of GTPase activity | 75/3918 | 255/18723 | 7.95e-04 | 7.91e-03 | 75 |
| GO:00430872 | Colorectum | MSS | regulation of GTPase activity | 101/3467 | 348/18723 | 1.00e-06 | 3.46e-05 | 101 |
| GO:00435471 | Colorectum | MSS | positive regulation of GTPase activity | 68/3467 | 255/18723 | 7.97e-04 | 8.38e-03 | 68 |
| GO:00430873 | Colorectum | FAP | regulation of GTPase activity | 85/2622 | 348/18723 | 1.20e-07 | 7.68e-06 | 85 |
| GO:00435472 | Colorectum | FAP | positive regulation of GTPase activity | 61/2622 | 255/18723 | 1.39e-05 | 3.73e-04 | 61 |
| GO:00430874 | Colorectum | CRC | regulation of GTPase activity | 69/2078 | 348/18723 | 1.11e-06 | 6.69e-05 | 69 |
| GO:00435473 | Colorectum | CRC | positive regulation of GTPase activity | 49/2078 | 255/18723 | 8.67e-05 | 1.77e-03 | 49 |
| GO:004308715 | Esophagus | ESCC | regulation of GTPase activity | 183/8552 | 348/18723 | 5.34e-03 | 2.00e-02 | 183 |
| GO:004308710 | Oral cavity | OSCC | regulation of GTPase activity | 165/7305 | 348/18723 | 7.94e-04 | 4.27e-03 | 165 |
| GO:004308714 | Oral cavity | EOLP | regulation of GTPase activity | 66/2218 | 348/18723 | 6.92e-05 | 8.55e-04 | 66 |
| GO:00435479 | Oral cavity | EOLP | positive regulation of GTPase activity | 47/2218 | 255/18723 | 1.34e-03 | 9.33e-03 | 47 |
| GO:004308722 | Oral cavity | NEOLP | regulation of GTPase activity | 54/2005 | 348/18723 | 3.36e-03 | 2.00e-02 | 54 |
| GO:004308718 | Thyroid | PTC | regulation of GTPase activity | 148/5968 | 348/18723 | 1.63e-05 | 1.71e-04 | 148 |
| GO:004354714 | Thyroid | PTC | positive regulation of GTPase activity | 103/5968 | 255/18723 | 2.38e-03 | 1.25e-02 | 103 |
| GO:004308719 | Thyroid | ATC | regulation of GTPase activity | 153/6293 | 348/18723 | 3.24e-05 | 2.68e-04 | 153 |
| GO:004354715 | Thyroid | ATC | positive regulation of GTPase activity | 106/6293 | 255/18723 | 4.58e-03 | 1.89e-02 | 106 |
| Page: 1 |
| Pathway ID | Tissue | Disease Stage | Description | Gene Ratio | Bg Ratio | pvalue | p.adjust | qvalue | Count |
| hsa0414418 | Cervix | CC | Endocytosis | 64/1267 | 251/8465 | 6.97e-06 | 6.10e-05 | 3.61e-05 | 64 |
| hsa0466612 | Cervix | CC | Fc gamma R-mediated phagocytosis | 31/1267 | 97/8465 | 1.78e-05 | 1.42e-04 | 8.40e-05 | 31 |
| hsa0414419 | Cervix | CC | Endocytosis | 64/1267 | 251/8465 | 6.97e-06 | 6.10e-05 | 3.61e-05 | 64 |
| hsa0466613 | Cervix | CC | Fc gamma R-mediated phagocytosis | 31/1267 | 97/8465 | 1.78e-05 | 1.42e-04 | 8.40e-05 | 31 |
| hsa04144 | Colorectum | AD | Endocytosis | 111/2092 | 251/8465 | 5.95e-12 | 1.42e-10 | 9.08e-11 | 111 |
| hsa04666 | Colorectum | AD | Fc gamma R-mediated phagocytosis | 46/2092 | 97/8465 | 9.10e-07 | 1.22e-05 | 7.77e-06 | 46 |
| hsa041441 | Colorectum | AD | Endocytosis | 111/2092 | 251/8465 | 5.95e-12 | 1.42e-10 | 9.08e-11 | 111 |
| hsa046661 | Colorectum | AD | Fc gamma R-mediated phagocytosis | 46/2092 | 97/8465 | 9.10e-07 | 1.22e-05 | 7.77e-06 | 46 |
| hsa041444 | Colorectum | MSS | Endocytosis | 102/1875 | 251/8465 | 1.85e-11 | 4.43e-10 | 2.71e-10 | 102 |
| hsa046664 | Colorectum | MSS | Fc gamma R-mediated phagocytosis | 45/1875 | 97/8465 | 9.30e-08 | 1.56e-06 | 9.55e-07 | 45 |
| hsa041445 | Colorectum | MSS | Endocytosis | 102/1875 | 251/8465 | 1.85e-11 | 4.43e-10 | 2.71e-10 | 102 |
| hsa046665 | Colorectum | MSS | Fc gamma R-mediated phagocytosis | 45/1875 | 97/8465 | 9.30e-08 | 1.56e-06 | 9.55e-07 | 45 |
| hsa041446 | Colorectum | FAP | Endocytosis | 78/1404 | 251/8465 | 6.20e-09 | 2.96e-07 | 1.80e-07 | 78 |
| hsa046666 | Colorectum | FAP | Fc gamma R-mediated phagocytosis | 35/1404 | 97/8465 | 2.46e-06 | 4.28e-05 | 2.60e-05 | 35 |
| hsa041447 | Colorectum | FAP | Endocytosis | 78/1404 | 251/8465 | 6.20e-09 | 2.96e-07 | 1.80e-07 | 78 |
| hsa046667 | Colorectum | FAP | Fc gamma R-mediated phagocytosis | 35/1404 | 97/8465 | 2.46e-06 | 4.28e-05 | 2.60e-05 | 35 |
| hsa041448 | Colorectum | CRC | Endocytosis | 65/1091 | 251/8465 | 1.27e-08 | 1.06e-06 | 7.19e-07 | 65 |
| hsa046668 | Colorectum | CRC | Fc gamma R-mediated phagocytosis | 27/1091 | 97/8465 | 6.24e-05 | 1.12e-03 | 7.57e-04 | 27 |
| hsa041449 | Colorectum | CRC | Endocytosis | 65/1091 | 251/8465 | 1.27e-08 | 1.06e-06 | 7.19e-07 | 65 |
| hsa046669 | Colorectum | CRC | Fc gamma R-mediated phagocytosis | 27/1091 | 97/8465 | 6.24e-05 | 1.12e-03 | 7.57e-04 | 27 |
| Page: 1 2 |
Top |
Cell-cell communication analysis |
| Identification of potential cell-cell interactions between two cell types and their ligand-receptor pairs for different disease states |
| Ligand | Receptor | LRpair | Pathway | Tissue | Disease Stage |
| Page: 1 |
Top |
Single-cell gene regulatory network inference analysis |
| Find out the significant the regulons (TFs) and the target genes of each regulon across cell types for different disease states |
| TF | Cell Type | Tissue | Disease Stage | Target Gene | RSS | Regulon Activity |
| ∗The dot plots of a searched regulon are shown for all cell subpopulations in each disease state of each tissue based on the regulon specific score inferred using pySCENIC and by calculating the average expression. |
| Page: 1 |
Top |
Somatic mutation of malignant transformation related genes |
| Annotation of somatic variants for genes involved in malignant transformation |
| Hugo Symbol | Variant Class | Variant Classification | dbSNP RS | HGVSc | HGVSp | HGVSp Short | SWISSPROT | BIOTYPE | SIFT | PolyPhen | Tumor Sample Barcode | Tissue | Histology | Sex | Age | Stage | Therapy Types | Drugs | Outcome |
| ASAP2 | SNV | Missense_Mutation | novel | c.2147N>T | p.Arg716Leu | p.R716L | O43150 | protein_coding | deleterious(0.01) | probably_damaging(0.987) | TCGA-EM-A22J-01 | Thyroid | thyroid carcinoma | Female | <65 | I/II | Unknown | Unknown | SD |
| ASAP2 | SNV | Missense_Mutation | c.527C>G | p.Thr176Ser | p.T176S | O43150 | protein_coding | tolerated(0.24) | probably_damaging(0.97) | TCGA-EM-A3FR-01 | Thyroid | thyroid carcinoma | Female | <65 | III/IV | Unknown | Unknown | SD |
| Page: 1 2 3 4 5 6 7 8 9 10 11 12 13 |
Top |
Related drugs of malignant transformation related genes |
| Identification of chemicals and drugs interact with genes involved in malignant transfromation |
| (DGIdb 4.0) |
| Entrez ID | Symbol | Category | Interaction Types | Drug Claim Name | Drug Name | PMIDs |
| Page: 1 |

Copyright 2023-Present -The University of Texas Health Science Center at Houston |