
|
|||||
|
 | |
| |
| |
| |
| |
| |
|
Gene: TBC1D4 |
Gene summary for TBC1D4 |
| Gene information | Species | Human | Gene symbol | TBC1D4 | Gene ID | 9882 |
| Gene name | TBC1 domain family member 4 | |
| Gene Alias | AS160 | |
| Cytomap | 13q22.2 | |
| Gene Type | protein-coding | GO ID | GO:0006810 | UniProtAcc | O60343 |
Top |
Malignant transformation analysis |
| Identification of the aberrant gene expression in precancerous and cancerous lesions by comparing the gene expression of stem-like cells in diseased tissues with normal stem cells |
| Entrez ID | Symbol | Replicates | Species | Organ | Tissue | Adj P-value | Log2FC | Malignancy |
| 9882 | TBC1D4 | HTA11_3410_2000001011 | Human | Colorectum | AD | 1.24e-11 | -5.70e-01 | 0.0155 |
| 9882 | TBC1D4 | HTA11_2487_2000001011 | Human | Colorectum | SER | 5.57e-03 | -5.19e-01 | -0.1808 |
| 9882 | TBC1D4 | HTA11_2951_2000001011 | Human | Colorectum | AD | 4.40e-05 | -8.35e-01 | 0.0216 |
| 9882 | TBC1D4 | HTA11_3361_2000001011 | Human | Colorectum | AD | 7.92e-04 | -5.89e-01 | -0.1207 |
| 9882 | TBC1D4 | HTA11_696_2000001011 | Human | Colorectum | AD | 2.43e-07 | -3.90e-01 | -0.1464 |
| 9882 | TBC1D4 | HTA11_866_2000001011 | Human | Colorectum | AD | 1.23e-06 | -4.09e-01 | -0.1001 |
| 9882 | TBC1D4 | HTA11_8622_2000001021 | Human | Colorectum | SER | 6.42e-03 | -6.51e-01 | 0.0528 |
| 9882 | TBC1D4 | HTA11_10711_2000001011 | Human | Colorectum | AD | 3.54e-04 | -5.23e-01 | 0.0338 |
| 9882 | TBC1D4 | HTA11_7696_3000711011 | Human | Colorectum | AD | 1.27e-02 | -3.37e-01 | 0.0674 |
| 9882 | TBC1D4 | HTA11_6818_2000001021 | Human | Colorectum | AD | 4.06e-03 | -5.69e-01 | 0.0588 |
| 9882 | TBC1D4 | HTA11_99999970781_79442 | Human | Colorectum | MSS | 1.62e-03 | -2.26e-01 | 0.294 |
| 9882 | TBC1D4 | HTA11_99999965104_69814 | Human | Colorectum | MSS | 3.11e-08 | 6.90e-01 | 0.281 |
| 9882 | TBC1D4 | HTA11_99999974143_84620 | Human | Colorectum | MSS | 1.59e-13 | -4.84e-01 | 0.3005 |
| 9882 | TBC1D4 | A002-C-010 | Human | Colorectum | FAP | 2.42e-05 | -1.91e-01 | 0.242 |
| 9882 | TBC1D4 | A001-C-207 | Human | Colorectum | FAP | 9.09e-03 | -2.85e-01 | 0.1278 |
| 9882 | TBC1D4 | A015-C-203 | Human | Colorectum | FAP | 2.03e-24 | -3.07e-01 | -0.1294 |
| 9882 | TBC1D4 | A015-C-204 | Human | Colorectum | FAP | 9.43e-05 | -3.17e-01 | -0.0228 |
| 9882 | TBC1D4 | A014-C-040 | Human | Colorectum | FAP | 4.83e-03 | -4.04e-01 | -0.1184 |
| 9882 | TBC1D4 | A002-C-201 | Human | Colorectum | FAP | 3.17e-14 | -4.93e-01 | 0.0324 |
| 9882 | TBC1D4 | A002-C-203 | Human | Colorectum | FAP | 6.73e-07 | -2.94e-01 | 0.2786 |
| Page: 1 2 3 4 5 6 |
| Tissue | Expression Dynamics | Abbreviation |
| Colorectum (GSE201348) |  | FAP: Familial adenomatous polyposis |
| CRC: Colorectal cancer | ||
| Colorectum (HTA11) |  | AD: Adenomas |
| SER: Sessile serrated lesions | ||
| MSI-H: Microsatellite-high colorectal cancer | ||
| MSS: Microsatellite stable colorectal cancer | ||
| Esophagus | 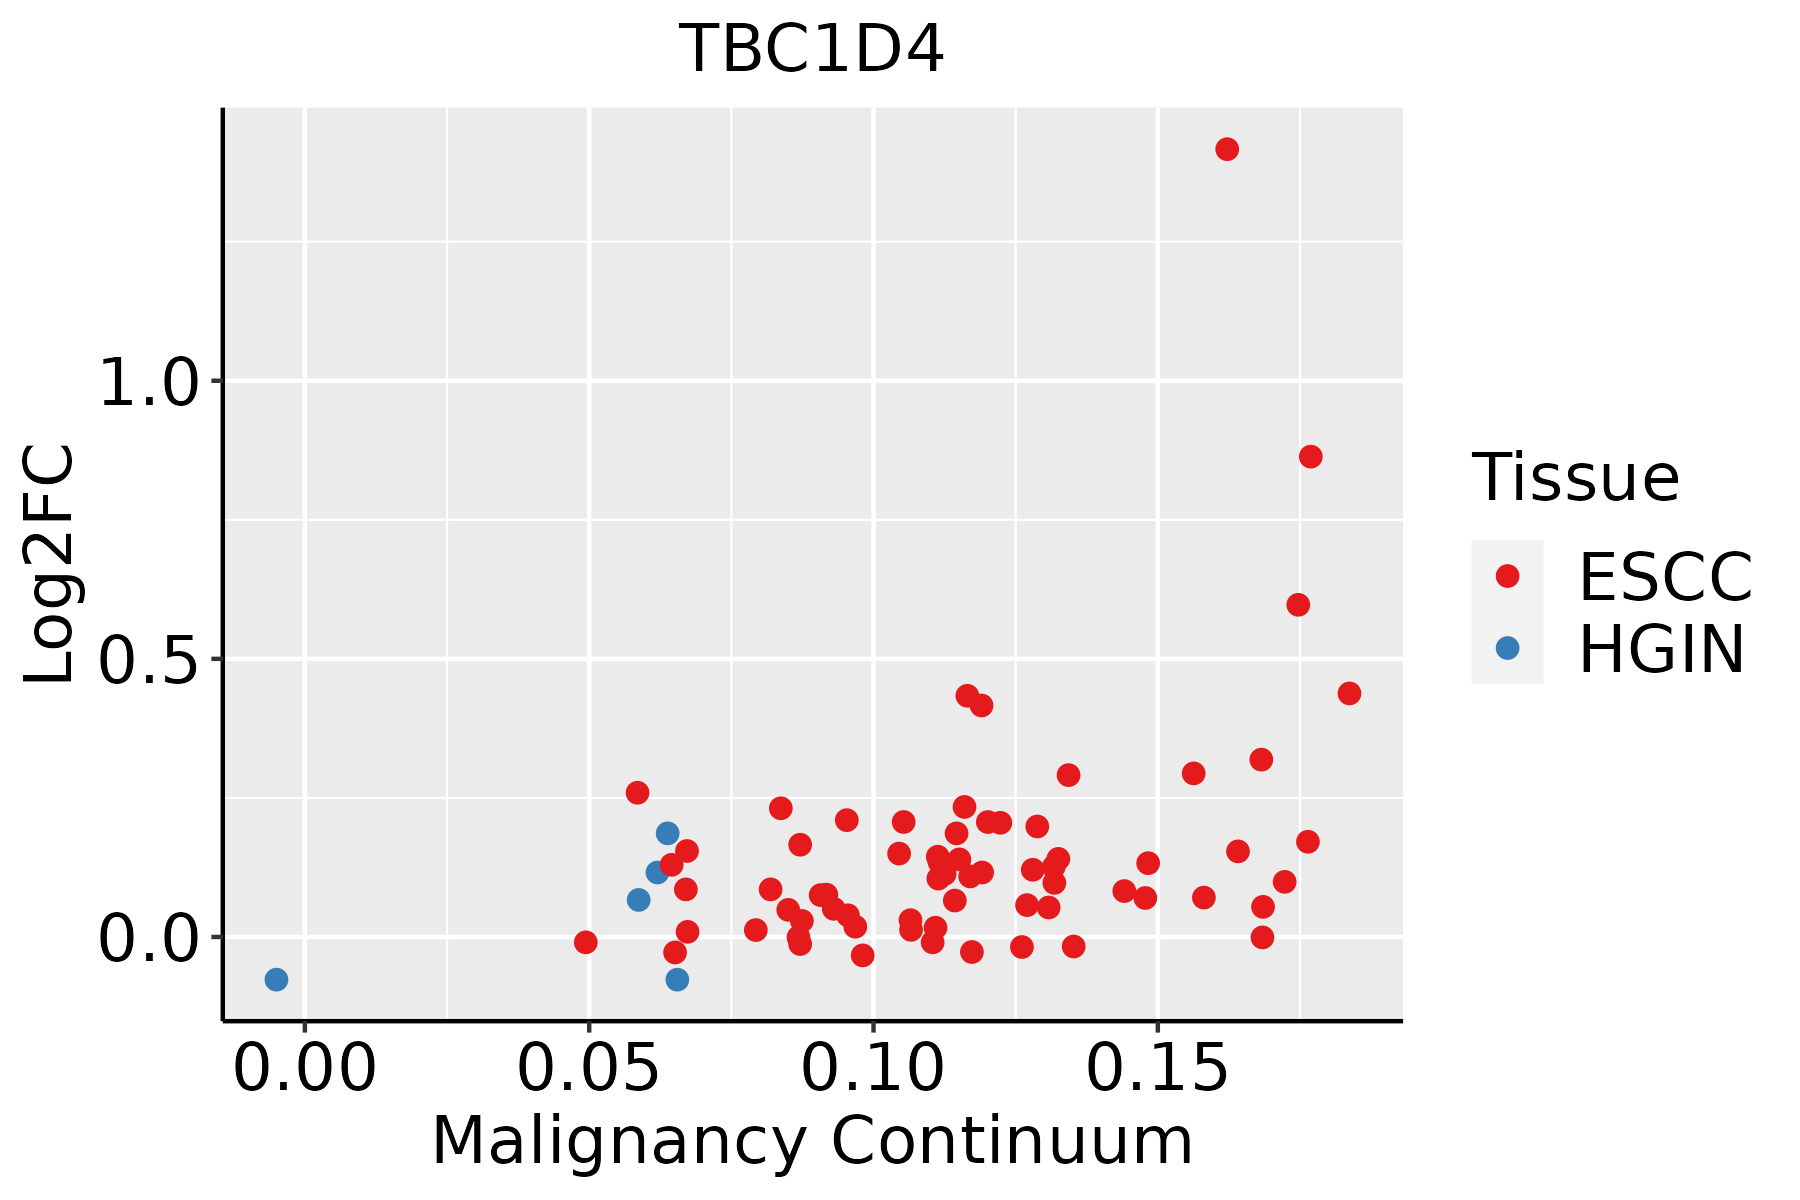 | ESCC: Esophageal squamous cell carcinoma |
| HGIN: High-grade intraepithelial neoplasias | ||
| LGIN: Low-grade intraepithelial neoplasias | ||
| Liver |  | HCC: Hepatocellular carcinoma |
| NAFLD: Non-alcoholic fatty liver disease | ||
| Lung | 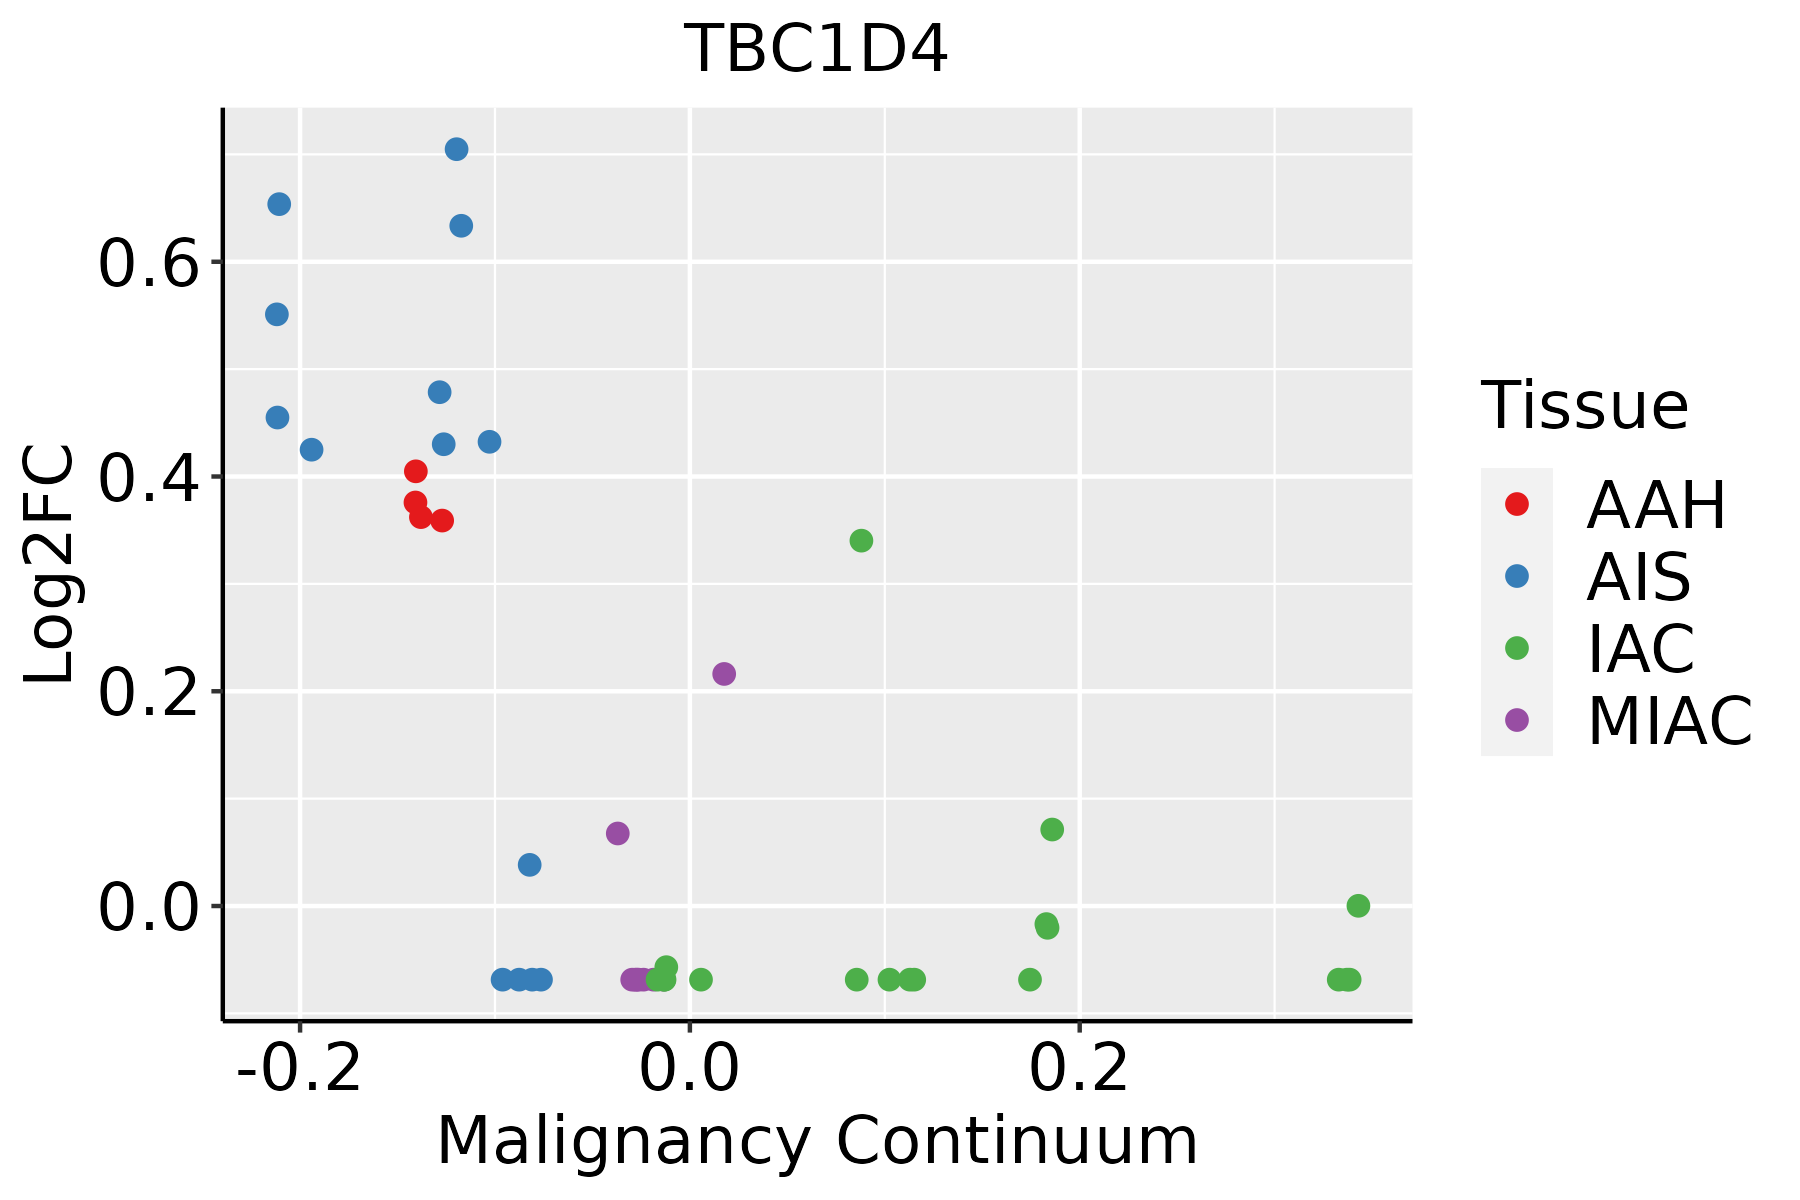 | AAH: Atypical adenomatous hyperplasia |
| AIS: Adenocarcinoma in situ | ||
| IAC: Invasive lung adenocarcinoma | ||
| MIA: Minimally invasive adenocarcinoma | ||
| Thyroid |  | ATC: Anaplastic thyroid cancer |
| HT: Hashimoto's thyroiditis | ||
| PTC: Papillary thyroid cancer |
| ∗log2FC in expression of this searched gene in stem-like cells from each diseased tissue sample relative to stem-like cells in normal samples in each tissue plotted against the malignancy continuum. Samples are colored based on if they are from different disease stage. |
Top |
Malignant transformation related pathway analysis |
| Find out the enriched GO biological processes and KEGG pathways involved in transition from healthy to precancer to cancer |
| Tissue | Disease Stage | Enriched GO biological Processes |
| Colorectum | AD |  |
| Colorectum | SER |  |
| Colorectum | MSS |  |
| Colorectum | MSI-H |  |
| Colorectum | FAP |  |
| ∗Top 15 enriched GO BP terms are showed in the bar plot of each disease state in each tissue. Each row represents a significant GO biological process which is colored according to the -log10(p.adjust). |
| Page: 1 2 3 4 5 6 7 8 9 |
| GO ID | Tissue | Disease Stage | Description | Gene Ratio | Bg Ratio | pvalue | p.adjust | Count |
| GO:0010639 | Colorectum | AD | negative regulation of organelle organization | 114/3918 | 348/18723 | 1.41e-07 | 6.49e-06 | 114 |
| GO:0016050 | Colorectum | AD | vesicle organization | 101/3918 | 300/18723 | 1.65e-07 | 7.17e-06 | 101 |
| GO:0032868 | Colorectum | AD | response to insulin | 91/3918 | 264/18723 | 2.02e-07 | 8.48e-06 | 91 |
| GO:1901653 | Colorectum | AD | cellular response to peptide | 114/3918 | 359/18723 | 8.32e-07 | 2.88e-05 | 114 |
| GO:0032869 | Colorectum | AD | cellular response to insulin stimulus | 72/3918 | 203/18723 | 1.10e-06 | 3.68e-05 | 72 |
| GO:0071375 | Colorectum | AD | cellular response to peptide hormone stimulus | 95/3918 | 290/18723 | 1.50e-06 | 4.66e-05 | 95 |
| GO:0043087 | Colorectum | AD | regulation of GTPase activity | 110/3918 | 348/18723 | 1.64e-06 | 5.03e-05 | 110 |
| GO:0043434 | Colorectum | AD | response to peptide hormone | 126/3918 | 414/18723 | 2.70e-06 | 7.86e-05 | 126 |
| GO:0043547 | Colorectum | AD | positive regulation of GTPase activity | 75/3918 | 255/18723 | 7.95e-04 | 7.91e-03 | 75 |
| GO:0048284 | Colorectum | AD | organelle fusion | 42/3918 | 141/18723 | 8.04e-03 | 4.73e-02 | 42 |
| GO:00106391 | Colorectum | SER | negative regulation of organelle organization | 90/2897 | 348/18723 | 3.14e-07 | 1.69e-05 | 90 |
| GO:00328681 | Colorectum | SER | response to insulin | 65/2897 | 264/18723 | 6.70e-05 | 1.53e-03 | 65 |
| GO:19016531 | Colorectum | SER | cellular response to peptide | 83/2897 | 359/18723 | 8.03e-05 | 1.77e-03 | 83 |
| GO:00434341 | Colorectum | SER | response to peptide hormone | 93/2897 | 414/18723 | 9.61e-05 | 2.04e-03 | 93 |
| GO:00713751 | Colorectum | SER | cellular response to peptide hormone stimulus | 68/2897 | 290/18723 | 2.20e-04 | 3.89e-03 | 68 |
| GO:00328691 | Colorectum | SER | cellular response to insulin stimulus | 51/2897 | 203/18723 | 2.30e-04 | 3.96e-03 | 51 |
| GO:00160501 | Colorectum | SER | vesicle organization | 69/2897 | 300/18723 | 3.59e-04 | 5.61e-03 | 69 |
| GO:00430871 | Colorectum | SER | regulation of GTPase activity | 77/2897 | 348/18723 | 5.90e-04 | 8.07e-03 | 77 |
| GO:0051051 | Colorectum | SER | negative regulation of transport | 98/2897 | 470/18723 | 1.01e-03 | 1.19e-02 | 98 |
| GO:00160502 | Colorectum | MSS | vesicle organization | 93/3467 | 300/18723 | 1.04e-07 | 4.97e-06 | 93 |
| Page: 1 2 3 4 5 6 |
| Pathway ID | Tissue | Disease Stage | Description | Gene Ratio | Bg Ratio | pvalue | p.adjust | qvalue | Count |
| hsa05415 | Colorectum | AD | Diabetic cardiomyopathy | 114/2092 | 203/8465 | 3.65e-22 | 3.06e-20 | 1.95e-20 | 114 |
| hsa04919 | Colorectum | AD | Thyroid hormone signaling pathway | 51/2092 | 121/8465 | 1.71e-05 | 1.73e-04 | 1.10e-04 | 51 |
| hsa054151 | Colorectum | AD | Diabetic cardiomyopathy | 114/2092 | 203/8465 | 3.65e-22 | 3.06e-20 | 1.95e-20 | 114 |
| hsa049191 | Colorectum | AD | Thyroid hormone signaling pathway | 51/2092 | 121/8465 | 1.71e-05 | 1.73e-04 | 1.10e-04 | 51 |
| hsa054152 | Colorectum | SER | Diabetic cardiomyopathy | 103/1580 | 203/8465 | 1.45e-25 | 1.61e-23 | 1.17e-23 | 103 |
| hsa049192 | Colorectum | SER | Thyroid hormone signaling pathway | 40/1580 | 121/8465 | 1.02e-04 | 1.06e-03 | 7.67e-04 | 40 |
| hsa054153 | Colorectum | SER | Diabetic cardiomyopathy | 103/1580 | 203/8465 | 1.45e-25 | 1.61e-23 | 1.17e-23 | 103 |
| hsa049193 | Colorectum | SER | Thyroid hormone signaling pathway | 40/1580 | 121/8465 | 1.02e-04 | 1.06e-03 | 7.67e-04 | 40 |
| hsa054154 | Colorectum | MSS | Diabetic cardiomyopathy | 106/1875 | 203/8465 | 2.47e-21 | 1.62e-19 | 9.92e-20 | 106 |
| hsa049194 | Colorectum | MSS | Thyroid hormone signaling pathway | 46/1875 | 121/8465 | 5.04e-05 | 4.97e-04 | 3.05e-04 | 46 |
| hsa04931 | Colorectum | MSS | Insulin resistance | 36/1875 | 108/8465 | 4.74e-03 | 2.01e-02 | 1.23e-02 | 36 |
| hsa054155 | Colorectum | MSS | Diabetic cardiomyopathy | 106/1875 | 203/8465 | 2.47e-21 | 1.62e-19 | 9.92e-20 | 106 |
| hsa049195 | Colorectum | MSS | Thyroid hormone signaling pathway | 46/1875 | 121/8465 | 5.04e-05 | 4.97e-04 | 3.05e-04 | 46 |
| hsa049311 | Colorectum | MSS | Insulin resistance | 36/1875 | 108/8465 | 4.74e-03 | 2.01e-02 | 1.23e-02 | 36 |
| hsa054158 | Colorectum | FAP | Diabetic cardiomyopathy | 70/1404 | 203/8465 | 2.62e-10 | 2.18e-08 | 1.33e-08 | 70 |
| hsa049198 | Colorectum | FAP | Thyroid hormone signaling pathway | 41/1404 | 121/8465 | 2.28e-06 | 4.28e-05 | 2.60e-05 | 41 |
| hsa049312 | Colorectum | FAP | Insulin resistance | 32/1404 | 108/8465 | 4.90e-04 | 3.56e-03 | 2.16e-03 | 32 |
| hsa054159 | Colorectum | FAP | Diabetic cardiomyopathy | 70/1404 | 203/8465 | 2.62e-10 | 2.18e-08 | 1.33e-08 | 70 |
| hsa049199 | Colorectum | FAP | Thyroid hormone signaling pathway | 41/1404 | 121/8465 | 2.28e-06 | 4.28e-05 | 2.60e-05 | 41 |
| hsa049313 | Colorectum | FAP | Insulin resistance | 32/1404 | 108/8465 | 4.90e-04 | 3.56e-03 | 2.16e-03 | 32 |
| Page: 1 2 |
Top |
Cell-cell communication analysis |
| Identification of potential cell-cell interactions between two cell types and their ligand-receptor pairs for different disease states |
| Ligand | Receptor | LRpair | Pathway | Tissue | Disease Stage |
| Page: 1 |
Top |
Single-cell gene regulatory network inference analysis |
| Find out the significant the regulons (TFs) and the target genes of each regulon across cell types for different disease states |
| TF | Cell Type | Tissue | Disease Stage | Target Gene | RSS | Regulon Activity |
| ∗The dot plots of a searched regulon are shown for all cell subpopulations in each disease state of each tissue based on the regulon specific score inferred using pySCENIC and by calculating the average expression. |
| Page: 1 |
Top |
Somatic mutation of malignant transformation related genes |
| Annotation of somatic variants for genes involved in malignant transformation |
| Hugo Symbol | Variant Class | Variant Classification | dbSNP RS | HGVSc | HGVSp | HGVSp Short | SWISSPROT | BIOTYPE | SIFT | PolyPhen | Tumor Sample Barcode | Tissue | Histology | Sex | Age | Stage | Therapy Types | Drugs | Outcome |
| TBC1D4 | SNV | Missense_Mutation | c.1390C>A | p.Leu464Ile | p.L464I | O60343 | protein_coding | deleterious(0.02) | probably_damaging(0.996) | TCGA-86-8585-01 | Lung | lung adenocarcinoma | Male | <65 | I/II | Unknown | Unknown | SD | |
| TBC1D4 | SNV | Missense_Mutation | c.3780N>C | p.Lys1260Asn | p.K1260N | O60343 | protein_coding | tolerated(0.34) | benign(0.02) | TCGA-97-7937-01 | Lung | lung adenocarcinoma | Male | >=65 | I/II | Unknown | Unknown | SD | |
| TBC1D4 | SNV | Missense_Mutation | c.2362N>T | p.Pro788Ser | p.P788S | O60343 | protein_coding | tolerated(0.41) | benign(0.028) | TCGA-18-3409-01 | Lung | lung squamous cell carcinoma | Male | >=65 | I/II | Unknown | Unknown | PD | |
| TBC1D4 | SNV | Missense_Mutation | c.724N>A | p.Glu242Lys | p.E242K | O60343 | protein_coding | tolerated(0.45) | possibly_damaging(0.661) | TCGA-18-3415-01 | Lung | lung squamous cell carcinoma | Male | >=65 | I/II | Chemotherapy | navelbine | CR | |
| TBC1D4 | SNV | Missense_Mutation | c.847G>T | p.Gly283Trp | p.G283W | O60343 | protein_coding | tolerated(0.08) | benign(0.337) | TCGA-18-3421-01 | Lung | lung squamous cell carcinoma | Male | >=65 | I/II | Unknown | Unknown | SD | |
| TBC1D4 | SNV | Missense_Mutation | c.362N>G | p.His121Arg | p.H121R | O60343 | protein_coding | tolerated(0.49) | probably_damaging(0.998) | TCGA-21-1075-01 | Lung | lung squamous cell carcinoma | Male | <65 | I/II | Unknown | Unknown | SD | |
| TBC1D4 | SNV | Missense_Mutation | c.1427N>A | p.Ala476Asp | p.A476D | O60343 | protein_coding | deleterious(0) | probably_damaging(0.988) | TCGA-22-4599-01 | Lung | lung squamous cell carcinoma | Female | >=65 | I/II | Unknown | Unknown | SD | |
| TBC1D4 | SNV | Missense_Mutation | novel | c.2244N>T | p.Arg748Ser | p.R748S | O60343 | protein_coding | tolerated(0.08) | possibly_damaging(0.521) | TCGA-22-4609-01 | Lung | lung squamous cell carcinoma | Male | >=65 | I/II | Unknown | Unknown | SD |
| TBC1D4 | SNV | Missense_Mutation | novel | c.2816N>C | p.His939Pro | p.H939P | O60343 | protein_coding | deleterious(0) | probably_damaging(0.978) | TCGA-60-2695-01 | Lung | lung squamous cell carcinoma | Female | >=65 | I/II | Unknown | Unknown | SD |
| TBC1D4 | SNV | Missense_Mutation | novel | c.2125N>C | p.Thr709Pro | p.T709P | O60343 | protein_coding | tolerated(0.09) | benign(0.092) | TCGA-60-2715-01 | Lung | lung squamous cell carcinoma | Male | <65 | I/II | Chemotherapy | docetaxel | PD |
| Page: 1 2 3 4 5 6 7 8 9 10 11 12 13 14 15 16 |
Top |
Related drugs of malignant transformation related genes |
| Identification of chemicals and drugs interact with genes involved in malignant transfromation |
| (DGIdb 4.0) |
| Entrez ID | Symbol | Category | Interaction Types | Drug Claim Name | Drug Name | PMIDs |
| Page: 1 |

Copyright 2023-Present -The University of Texas Health Science Center at Houston |