
|
|||||
|
 | |
| |
| |
| |
| |
| |
|
Gene: PPP1R12B |
Gene summary for PPP1R12B |
| Gene information | Species | Human | Gene symbol | PPP1R12B | Gene ID | 4660 |
| Gene name | protein phosphatase 1 regulatory subunit 12B | |
| Gene Alias | MYPT2 | |
| Cytomap | 1q32.1 | |
| Gene Type | protein-coding | GO ID | GO:0003008 | UniProtAcc | O60237 |
Top |
Malignant transformation analysis |
| Identification of the aberrant gene expression in precancerous and cancerous lesions by comparing the gene expression of stem-like cells in diseased tissues with normal stem cells |
| Entrez ID | Symbol | Replicates | Species | Organ | Tissue | Adj P-value | Log2FC | Malignancy |
| 4660 | PPP1R12B | CCI_1 | Human | Cervix | CC | 1.46e-11 | 1.21e+00 | 0.528 |
| 4660 | PPP1R12B | CCI_3 | Human | Cervix | CC | 1.12e-28 | 1.74e+00 | 0.516 |
| 4660 | PPP1R12B | HTA11_3410_2000001011 | Human | Colorectum | AD | 5.00e-26 | -6.78e-01 | 0.0155 |
| 4660 | PPP1R12B | HTA11_2951_2000001011 | Human | Colorectum | AD | 5.82e-05 | -9.59e-01 | 0.0216 |
| 4660 | PPP1R12B | HTA11_347_2000001011 | Human | Colorectum | AD | 1.44e-11 | 6.31e-01 | -0.1954 |
| 4660 | PPP1R12B | HTA11_3361_2000001011 | Human | Colorectum | AD | 2.16e-12 | -6.47e-01 | -0.1207 |
| 4660 | PPP1R12B | HTA11_9341_2000001011 | Human | Colorectum | SER | 1.72e-03 | -9.06e-01 | -0.00410000000000005 |
| 4660 | PPP1R12B | HTA11_866_3004761011 | Human | Colorectum | AD | 2.63e-03 | -4.73e-01 | 0.096 |
| 4660 | PPP1R12B | HTA11_8622_2000001021 | Human | Colorectum | SER | 1.76e-05 | -5.45e-01 | 0.0528 |
| 4660 | PPP1R12B | HTA11_10711_2000001011 | Human | Colorectum | AD | 1.38e-16 | -7.26e-01 | 0.0338 |
| 4660 | PPP1R12B | HTA11_7696_3000711011 | Human | Colorectum | AD | 2.77e-08 | -4.96e-01 | 0.0674 |
| 4660 | PPP1R12B | HTA11_7469_2000001011 | Human | Colorectum | AD | 6.50e-03 | -4.84e-01 | -0.0124 |
| 4660 | PPP1R12B | HTA11_6818_2000001021 | Human | Colorectum | AD | 4.46e-05 | -5.18e-01 | 0.0588 |
| 4660 | PPP1R12B | HTA11_99999970781_79442 | Human | Colorectum | MSS | 6.76e-10 | -4.45e-01 | 0.294 |
| 4660 | PPP1R12B | HTA11_99999971662_82457 | Human | Colorectum | MSS | 3.08e-13 | -5.52e-01 | 0.3859 |
| 4660 | PPP1R12B | HTA11_99999973899_84307 | Human | Colorectum | MSS | 8.72e-13 | -8.95e-01 | 0.2585 |
| 4660 | PPP1R12B | HTA11_99999974143_84620 | Human | Colorectum | MSS | 4.06e-47 | -9.40e-01 | 0.3005 |
| 4660 | PPP1R12B | A001-C-207 | Human | Colorectum | FAP | 9.75e-05 | -4.19e-01 | 0.1278 |
| 4660 | PPP1R12B | A015-C-203 | Human | Colorectum | FAP | 9.00e-45 | -8.30e-01 | -0.1294 |
| 4660 | PPP1R12B | A015-C-204 | Human | Colorectum | FAP | 5.77e-11 | -6.09e-01 | -0.0228 |
| Page: 1 2 3 4 |
| Tissue | Expression Dynamics | Abbreviation |
| Cervix | 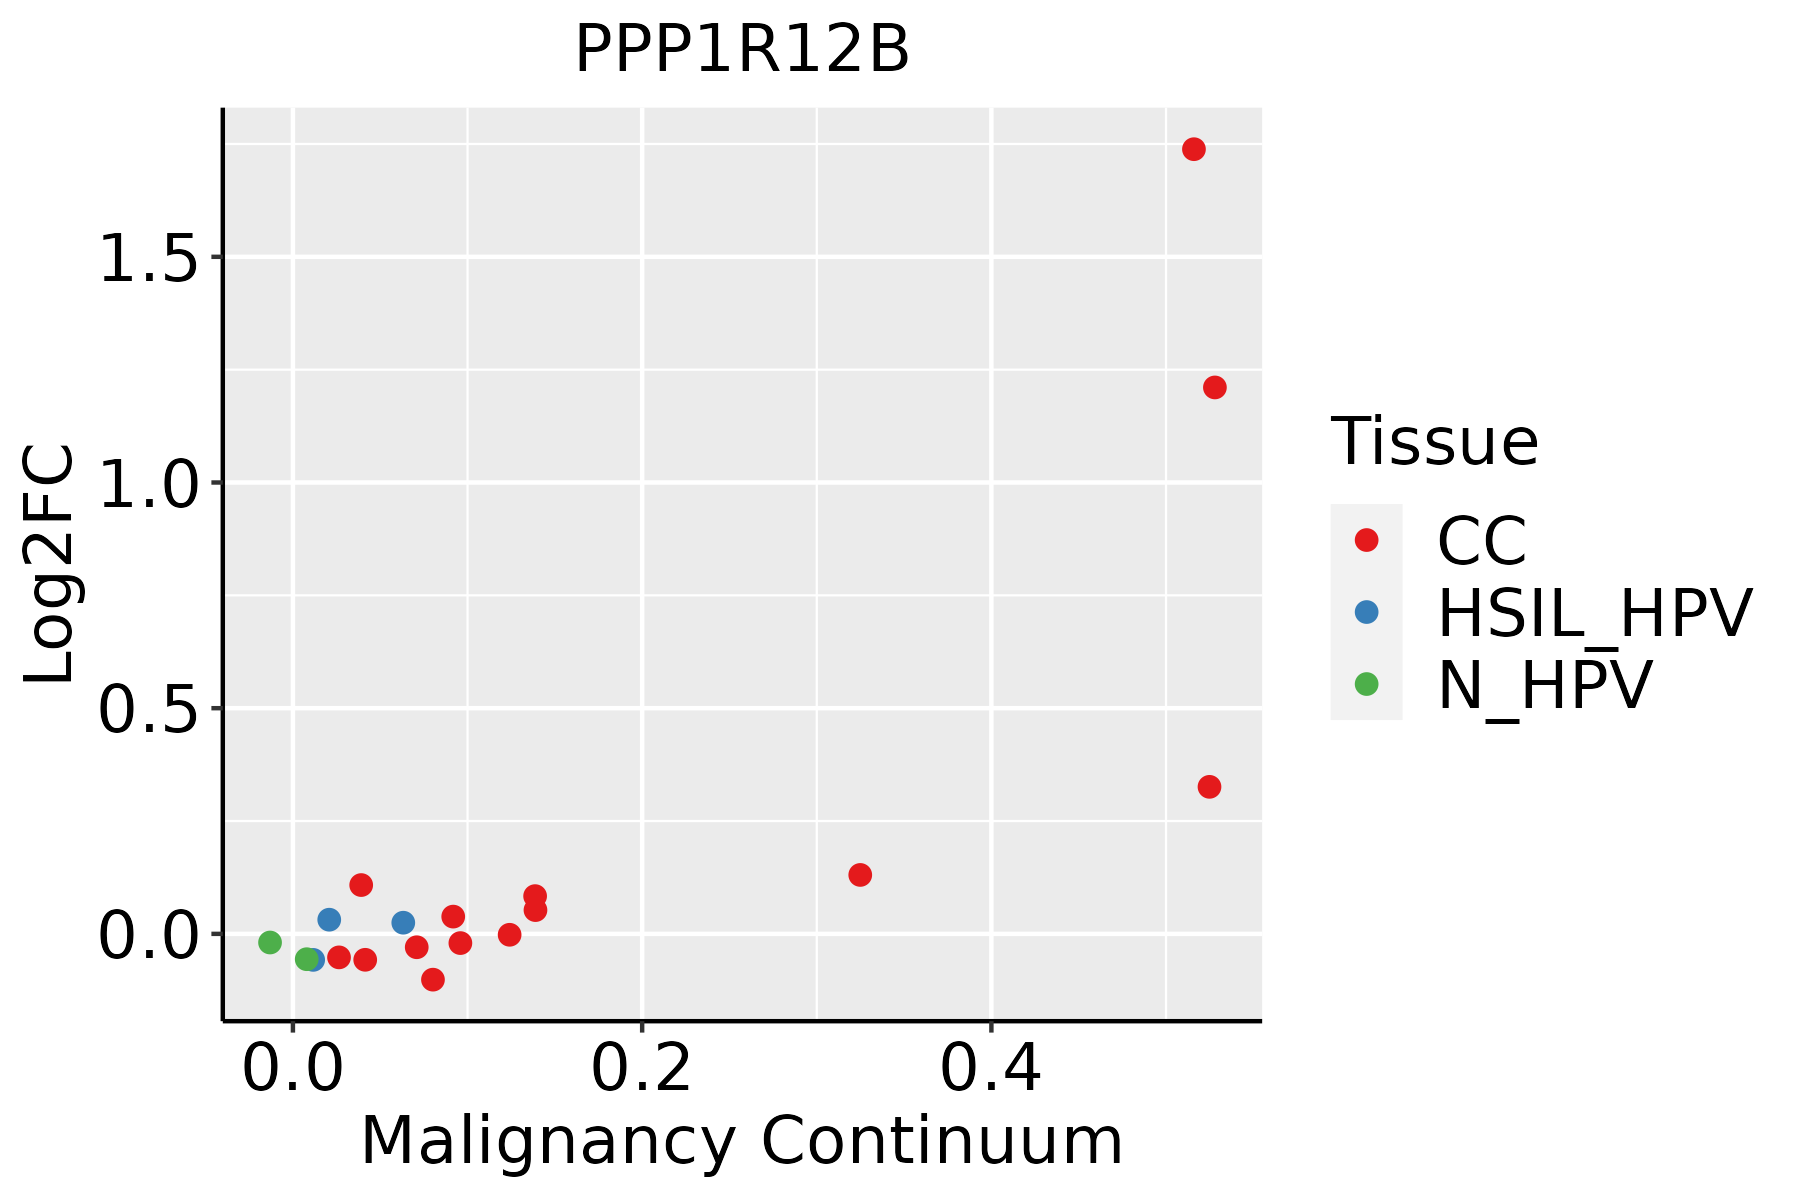 | CC: Cervix cancer |
| HSIL_HPV: HPV-infected high-grade squamous intraepithelial lesions | ||
| N_HPV: HPV-infected normal cervix | ||
| Colorectum (GSE201348) |  | FAP: Familial adenomatous polyposis |
| CRC: Colorectal cancer | ||
| Colorectum (HTA11) |  | AD: Adenomas |
| SER: Sessile serrated lesions | ||
| MSI-H: Microsatellite-high colorectal cancer | ||
| MSS: Microsatellite stable colorectal cancer | ||
| Liver | 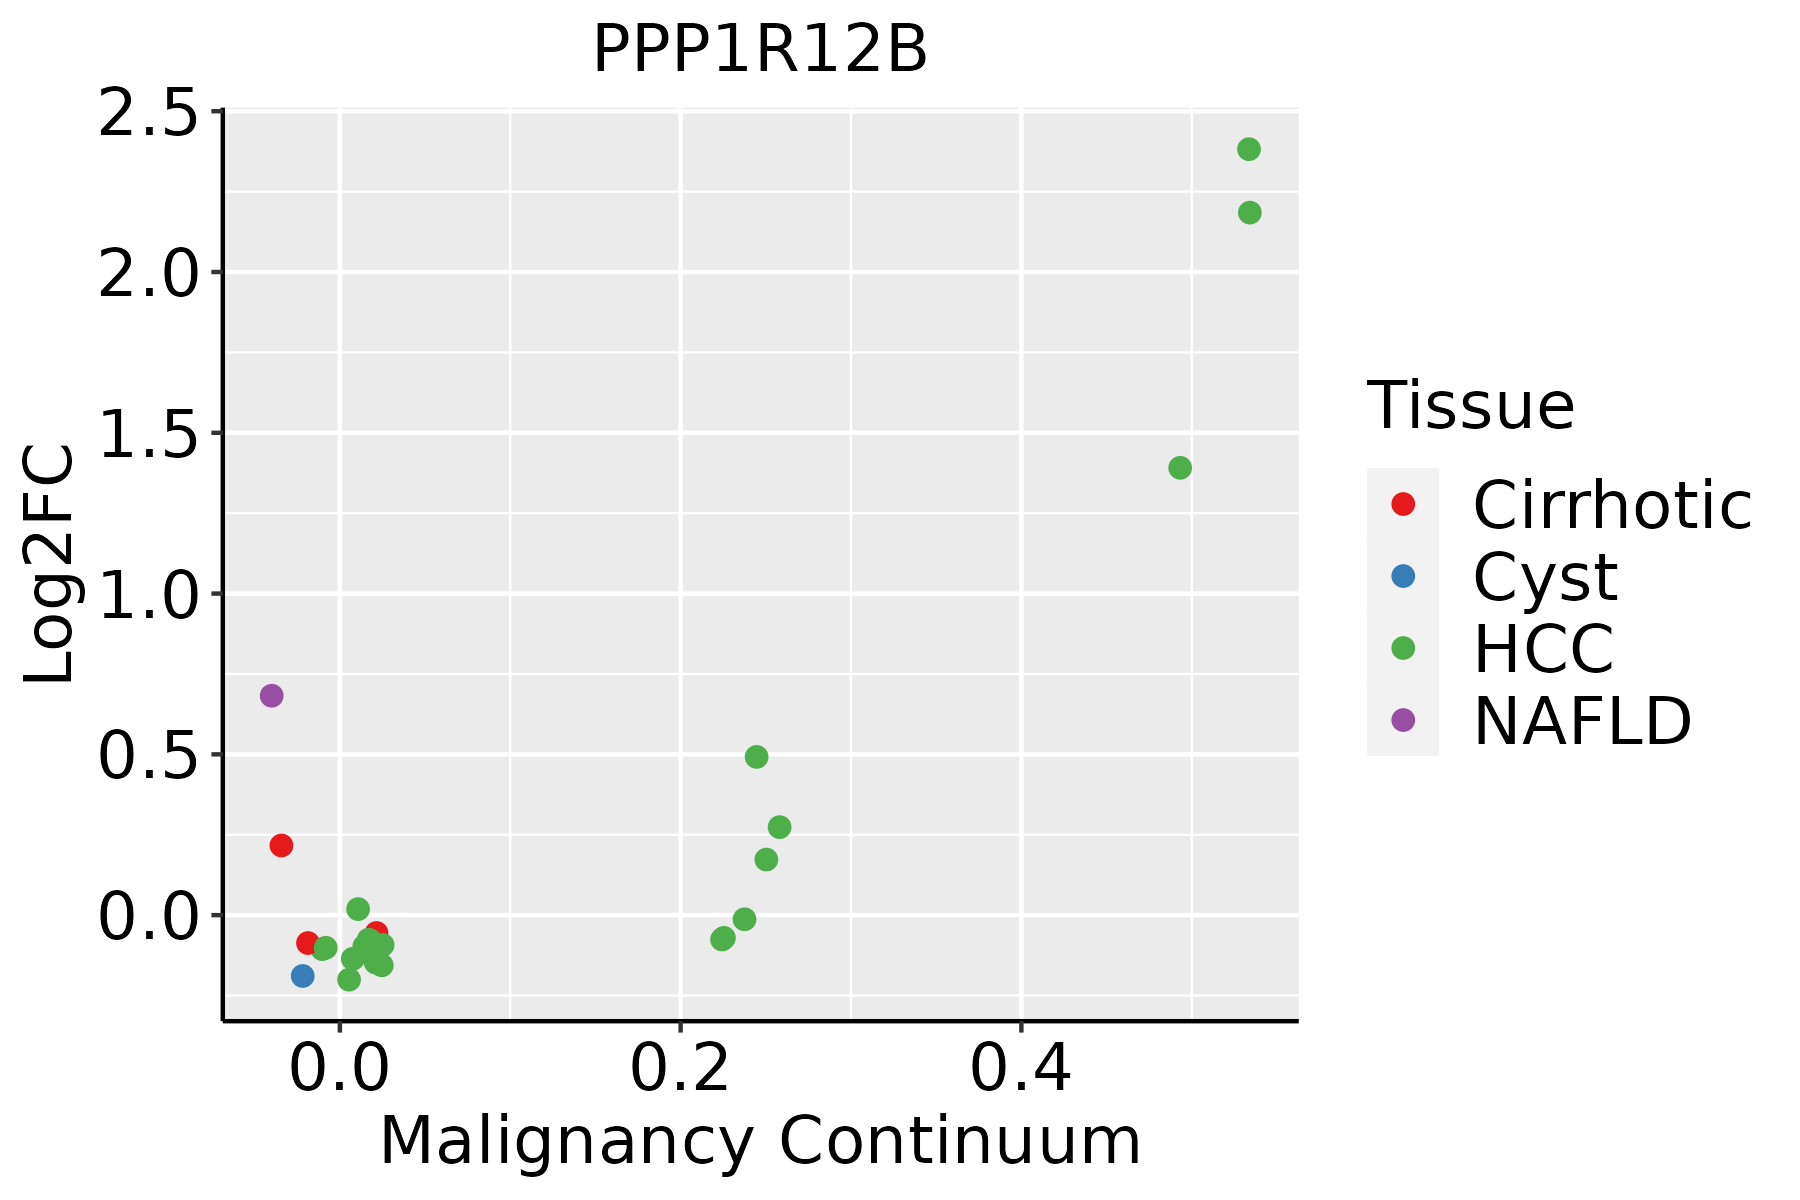 | HCC: Hepatocellular carcinoma |
| NAFLD: Non-alcoholic fatty liver disease | ||
| Lung | 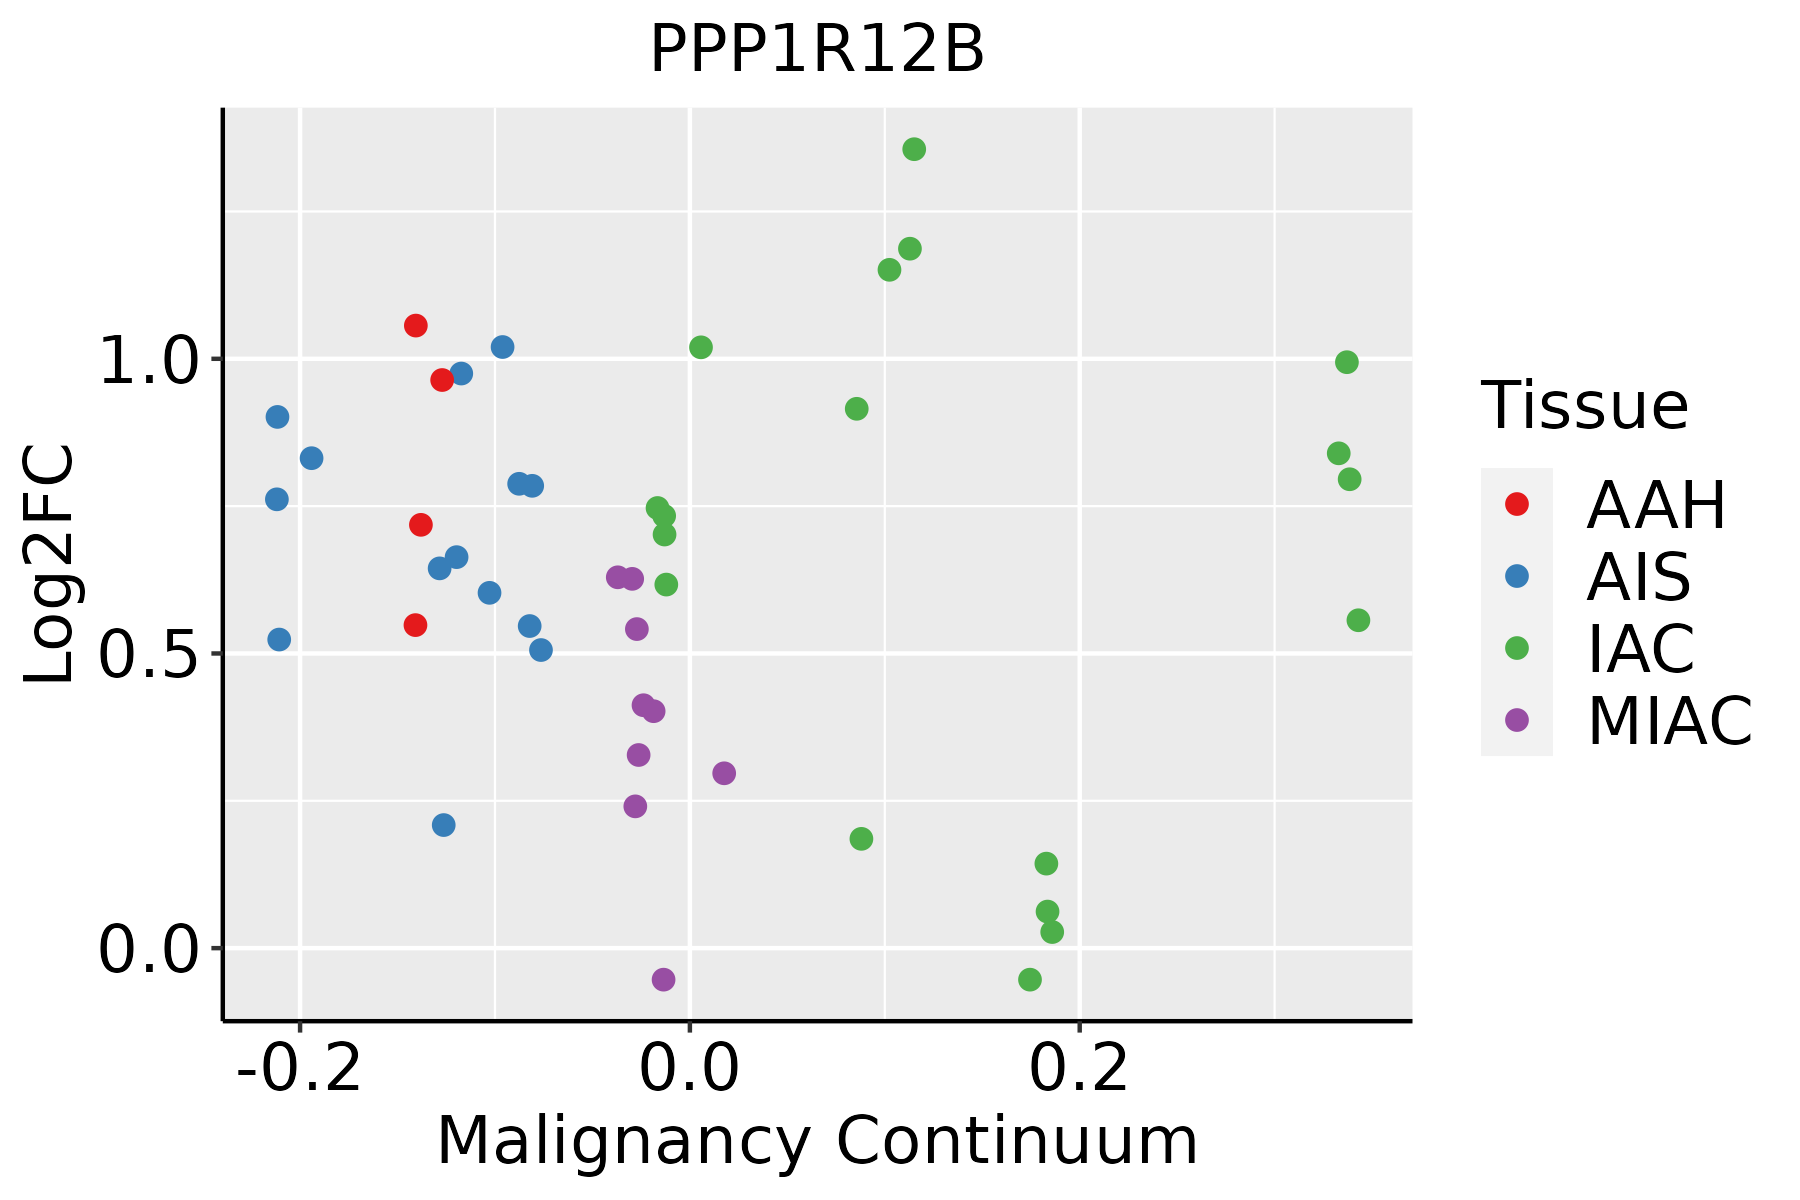 | AAH: Atypical adenomatous hyperplasia |
| AIS: Adenocarcinoma in situ | ||
| IAC: Invasive lung adenocarcinoma | ||
| MIA: Minimally invasive adenocarcinoma | ||
| Oral Cavity | 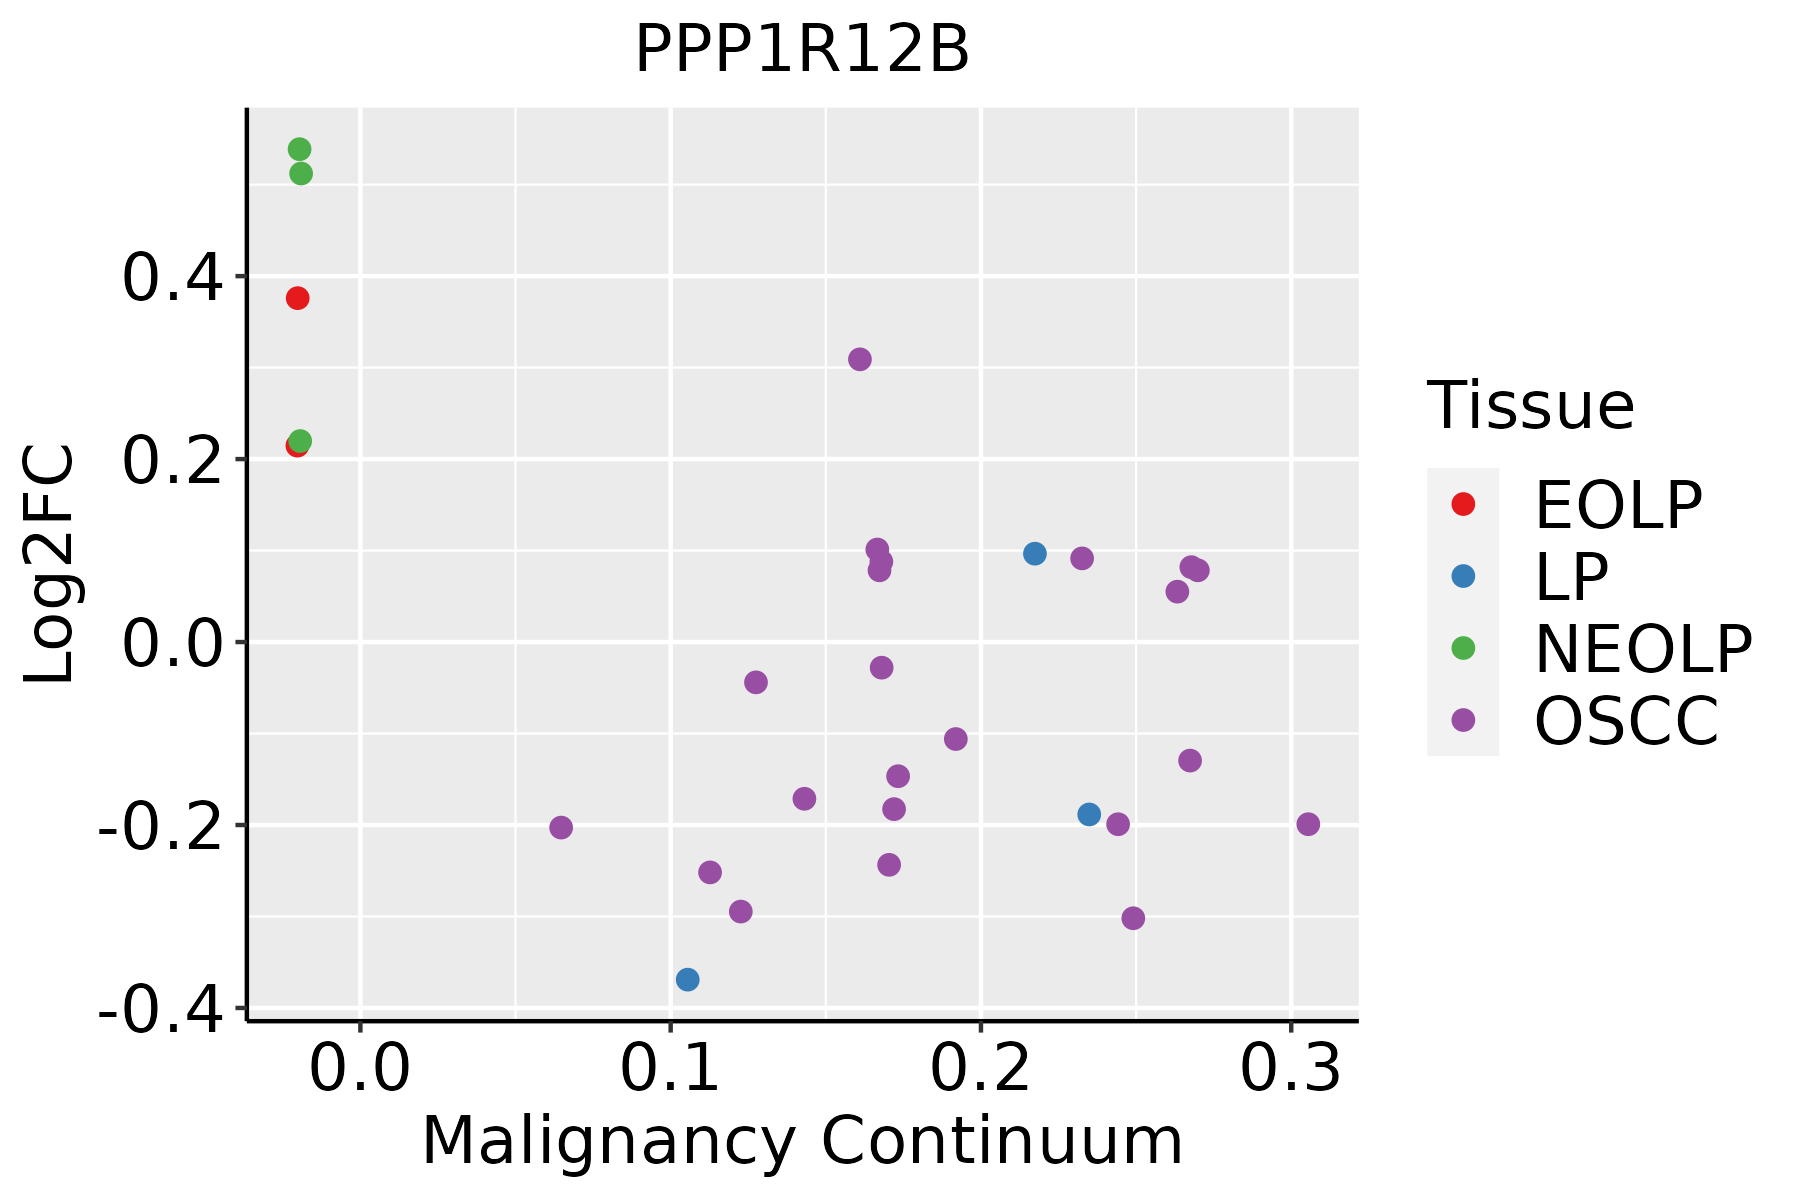 | EOLP: Erosive Oral lichen planus |
| LP: leukoplakia | ||
| NEOLP: Non-erosive oral lichen planus | ||
| OSCC: Oral squamous cell carcinoma |
| ∗log2FC in expression of this searched gene in stem-like cells from each diseased tissue sample relative to stem-like cells in normal samples in each tissue plotted against the malignancy continuum. Samples are colored based on if they are from different disease stage. |
Top |
Malignant transformation related pathway analysis |
| Find out the enriched GO biological processes and KEGG pathways involved in transition from healthy to precancer to cancer |
| Tissue | Disease Stage | Enriched GO biological Processes |
| Colorectum | AD |  |
| Colorectum | SER |  |
| Colorectum | MSS |  |
| Colorectum | MSI-H |  |
| Colorectum | FAP |  |
| ∗Top 15 enriched GO BP terms are showed in the bar plot of each disease state in each tissue. Each row represents a significant GO biological process which is colored according to the -log10(p.adjust). |
| Page: 1 2 3 4 5 6 7 8 9 |
| GO ID | Tissue | Disease Stage | Description | Gene Ratio | Bg Ratio | pvalue | p.adjust | Count |
| GO:00902578 | Cervix | CC | regulation of muscle system process | 45/2311 | 252/18723 | 6.73e-03 | 3.70e-02 | 45 |
| GO:0090257 | Colorectum | AD | regulation of muscle system process | 73/3918 | 252/18723 | 1.46e-03 | 1.24e-02 | 73 |
| GO:00902571 | Colorectum | SER | regulation of muscle system process | 60/2897 | 252/18723 | 3.28e-04 | 5.22e-03 | 60 |
| GO:0003012 | Colorectum | SER | muscle system process | 92/2897 | 452/18723 | 2.98e-03 | 2.63e-02 | 92 |
| GO:00902572 | Colorectum | MSS | regulation of muscle system process | 66/3467 | 252/18723 | 1.55e-03 | 1.41e-02 | 66 |
| GO:00030121 | Colorectum | MSS | muscle system process | 105/3467 | 452/18723 | 6.39e-03 | 4.26e-02 | 105 |
| GO:00902574 | Colorectum | FAP | regulation of muscle system process | 58/2622 | 252/18723 | 7.22e-05 | 1.33e-03 | 58 |
| GO:00030122 | Colorectum | FAP | muscle system process | 89/2622 | 452/18723 | 4.63e-04 | 5.39e-03 | 89 |
| GO:00069371 | Colorectum | FAP | regulation of muscle contraction | 37/2622 | 169/18723 | 3.39e-03 | 2.47e-02 | 37 |
| GO:00902575 | Colorectum | CRC | regulation of muscle system process | 51/2078 | 252/18723 | 1.49e-05 | 4.63e-04 | 51 |
| GO:00030123 | Colorectum | CRC | muscle system process | 74/2078 | 452/18723 | 3.92e-04 | 5.80e-03 | 74 |
| GO:00069372 | Colorectum | CRC | regulation of muscle contraction | 33/2078 | 169/18723 | 8.65e-04 | 1.07e-02 | 33 |
| GO:00030124 | Lung | IAC | muscle system process | 71/2061 | 452/18723 | 1.29e-03 | 1.45e-02 | 71 |
| GO:00902577 | Lung | IAC | regulation of muscle system process | 43/2061 | 252/18723 | 2.35e-03 | 2.28e-02 | 43 |
| GO:000301211 | Lung | AIS | muscle system process | 63/1849 | 452/18723 | 3.18e-03 | 3.05e-02 | 63 |
| GO:00030128 | Oral cavity | EOLP | muscle system process | 71/2218 | 452/18723 | 7.83e-03 | 3.73e-02 | 71 |
| Page: 1 |
| Pathway ID | Tissue | Disease Stage | Description | Gene Ratio | Bg Ratio | pvalue | p.adjust | qvalue | Count |
| hsa0520516 | Cervix | CC | Proteoglycans in cancer | 60/1267 | 205/8465 | 9.13e-08 | 1.18e-06 | 7.00e-07 | 60 |
| hsa0451010 | Cervix | CC | Focal adhesion | 59/1267 | 203/8465 | 1.53e-07 | 1.84e-06 | 1.09e-06 | 59 |
| hsa0481016 | Cervix | CC | Regulation of actin cytoskeleton | 64/1267 | 229/8465 | 2.24e-07 | 2.59e-06 | 1.53e-06 | 64 |
| hsa049218 | Cervix | CC | Oxytocin signaling pathway | 34/1267 | 154/8465 | 1.12e-02 | 3.42e-02 | 2.02e-02 | 34 |
| hsa0520517 | Cervix | CC | Proteoglycans in cancer | 60/1267 | 205/8465 | 9.13e-08 | 1.18e-06 | 7.00e-07 | 60 |
| hsa0451014 | Cervix | CC | Focal adhesion | 59/1267 | 203/8465 | 1.53e-07 | 1.84e-06 | 1.09e-06 | 59 |
| hsa0481017 | Cervix | CC | Regulation of actin cytoskeleton | 64/1267 | 229/8465 | 2.24e-07 | 2.59e-06 | 1.53e-06 | 64 |
| hsa0492111 | Cervix | CC | Oxytocin signaling pathway | 34/1267 | 154/8465 | 1.12e-02 | 3.42e-02 | 2.02e-02 | 34 |
| hsa05205 | Colorectum | AD | Proteoglycans in cancer | 70/2092 | 205/8465 | 1.37e-03 | 8.46e-03 | 5.39e-03 | 70 |
| hsa04810 | Colorectum | AD | Regulation of actin cytoskeleton | 75/2092 | 229/8465 | 3.36e-03 | 1.76e-02 | 1.12e-02 | 75 |
| hsa04510 | Colorectum | AD | Focal adhesion | 67/2092 | 203/8465 | 4.40e-03 | 2.17e-02 | 1.38e-02 | 67 |
| hsa052051 | Colorectum | AD | Proteoglycans in cancer | 70/2092 | 205/8465 | 1.37e-03 | 8.46e-03 | 5.39e-03 | 70 |
| hsa048101 | Colorectum | AD | Regulation of actin cytoskeleton | 75/2092 | 229/8465 | 3.36e-03 | 1.76e-02 | 1.12e-02 | 75 |
| hsa045101 | Colorectum | AD | Focal adhesion | 67/2092 | 203/8465 | 4.40e-03 | 2.17e-02 | 1.38e-02 | 67 |
| hsa052052 | Colorectum | SER | Proteoglycans in cancer | 58/1580 | 205/8465 | 4.37e-04 | 3.82e-03 | 2.77e-03 | 58 |
| hsa048102 | Colorectum | SER | Regulation of actin cytoskeleton | 60/1580 | 229/8465 | 2.74e-03 | 2.02e-02 | 1.47e-02 | 60 |
| hsa052053 | Colorectum | SER | Proteoglycans in cancer | 58/1580 | 205/8465 | 4.37e-04 | 3.82e-03 | 2.77e-03 | 58 |
| hsa048103 | Colorectum | SER | Regulation of actin cytoskeleton | 60/1580 | 229/8465 | 2.74e-03 | 2.02e-02 | 1.47e-02 | 60 |
| hsa052054 | Colorectum | MSS | Proteoglycans in cancer | 65/1875 | 205/8465 | 8.66e-04 | 5.38e-03 | 3.29e-03 | 65 |
| hsa048104 | Colorectum | MSS | Regulation of actin cytoskeleton | 68/1875 | 229/8465 | 4.27e-03 | 1.86e-02 | 1.14e-02 | 68 |
| Page: 1 2 3 4 5 |
Top |
Cell-cell communication analysis |
| Identification of potential cell-cell interactions between two cell types and their ligand-receptor pairs for different disease states |
| Ligand | Receptor | LRpair | Pathway | Tissue | Disease Stage |
| Page: 1 |
Top |
Single-cell gene regulatory network inference analysis |
| Find out the significant the regulons (TFs) and the target genes of each regulon across cell types for different disease states |
| TF | Cell Type | Tissue | Disease Stage | Target Gene | RSS | Regulon Activity |
| ∗The dot plots of a searched regulon are shown for all cell subpopulations in each disease state of each tissue based on the regulon specific score inferred using pySCENIC and by calculating the average expression. |
| Page: 1 |
Top |
Somatic mutation of malignant transformation related genes |
| Annotation of somatic variants for genes involved in malignant transformation |
| Hugo Symbol | Variant Class | Variant Classification | dbSNP RS | HGVSc | HGVSp | HGVSp Short | SWISSPROT | BIOTYPE | SIFT | PolyPhen | Tumor Sample Barcode | Tissue | Histology | Sex | Age | Stage | Therapy Types | Drugs | Outcome |
| PPP1R12B | insertion | Frame_Shift_Ins | novel | c.476_477insCTCTATTTTGAGTTTAAAATATGGTC | p.Pro160SerfsTer19 | p.P160Sfs*19 | protein_coding | TCGA-DJ-A3VL-01 | Thyroid | thyroid carcinoma | Male | <65 | I/II | Unknown | Unknown | PD |
| Page: 1 2 3 4 5 6 7 8 9 10 11 12 |
Top |
Related drugs of malignant transformation related genes |
| Identification of chemicals and drugs interact with genes involved in malignant transfromation |
| (DGIdb 4.0) |
| Entrez ID | Symbol | Category | Interaction Types | Drug Claim Name | Drug Name | PMIDs |
| Page: 1 |

Copyright 2023-Present -The University of Texas Health Science Center at Houston |