
|
|||||
|
 | |
| |
| |
| |
| |
| |
|
Gene: ITGA1 |
Gene summary for ITGA1 |
| Gene information | Species | Human | Gene symbol | ITGA1 | Gene ID | 3672 |
| Gene name | integrin subunit alpha 1 | |
| Gene Alias | CD49a | |
| Cytomap | 5q11.2 | |
| Gene Type | protein-coding | GO ID | GO:0000902 | UniProtAcc | P56199 |
Top |
Malignant transformation analysis |
| Identification of the aberrant gene expression in precancerous and cancerous lesions by comparing the gene expression of stem-like cells in diseased tissues with normal stem cells |
| Entrez ID | Symbol | Replicates | Species | Organ | Tissue | Adj P-value | Log2FC | Malignancy |
| 3672 | ITGA1 | LZE6T | Human | Esophagus | ESCC | 3.74e-05 | 2.01e-01 | 0.0845 |
| 3672 | ITGA1 | P8T-E | Human | Esophagus | ESCC | 1.63e-02 | 9.15e-02 | 0.0889 |
| 3672 | ITGA1 | P9T-E | Human | Esophagus | ESCC | 1.90e-02 | 2.02e-01 | 0.1131 |
| 3672 | ITGA1 | P11T-E | Human | Esophagus | ESCC | 1.89e-08 | 6.87e-01 | 0.1426 |
| 3672 | ITGA1 | P12T-E | Human | Esophagus | ESCC | 3.94e-04 | 2.00e-01 | 0.1122 |
| 3672 | ITGA1 | P19T-E | Human | Esophagus | ESCC | 3.71e-14 | 1.39e+00 | 0.1662 |
| 3672 | ITGA1 | P32T-E | Human | Esophagus | ESCC | 5.22e-04 | 1.66e-01 | 0.1666 |
| 3672 | ITGA1 | P44T-E | Human | Esophagus | ESCC | 8.48e-07 | 4.20e-01 | 0.1096 |
| 3672 | ITGA1 | P75T-E | Human | Esophagus | ESCC | 4.57e-04 | 6.19e-02 | 0.1125 |
| 3672 | ITGA1 | NAFLD1 | Human | Liver | NAFLD | 3.07e-12 | 1.04e+00 | -0.04 |
| 3672 | ITGA1 | S41 | Human | Liver | Cirrhotic | 1.46e-06 | 6.26e-01 | -0.0343 |
| 3672 | ITGA1 | S43 | Human | Liver | Cirrhotic | 6.98e-08 | 2.30e-01 | -0.0187 |
| 3672 | ITGA1 | HCC1_Meng | Human | Liver | HCC | 4.23e-82 | 1.58e-01 | 0.0246 |
| 3672 | ITGA1 | HCC2_Meng | Human | Liver | HCC | 3.32e-10 | -9.04e-02 | 0.0107 |
| 3672 | ITGA1 | Pt13.b | Human | Liver | HCC | 1.21e-20 | 5.43e-01 | 0.0251 |
| 3672 | ITGA1 | S014 | Human | Liver | HCC | 1.87e-13 | 8.96e-01 | 0.2254 |
| 3672 | ITGA1 | S015 | Human | Liver | HCC | 5.16e-17 | 1.13e+00 | 0.2375 |
| 3672 | ITGA1 | S016 | Human | Liver | HCC | 2.94e-16 | 8.41e-01 | 0.2243 |
| 3672 | ITGA1 | S028 | Human | Liver | HCC | 3.71e-02 | 2.60e-01 | 0.2503 |
| 3672 | ITGA1 | S029 | Human | Liver | HCC | 1.52e-05 | 5.52e-01 | 0.2581 |
| Page: 1 2 |
| Tissue | Expression Dynamics | Abbreviation |
| Esophagus | 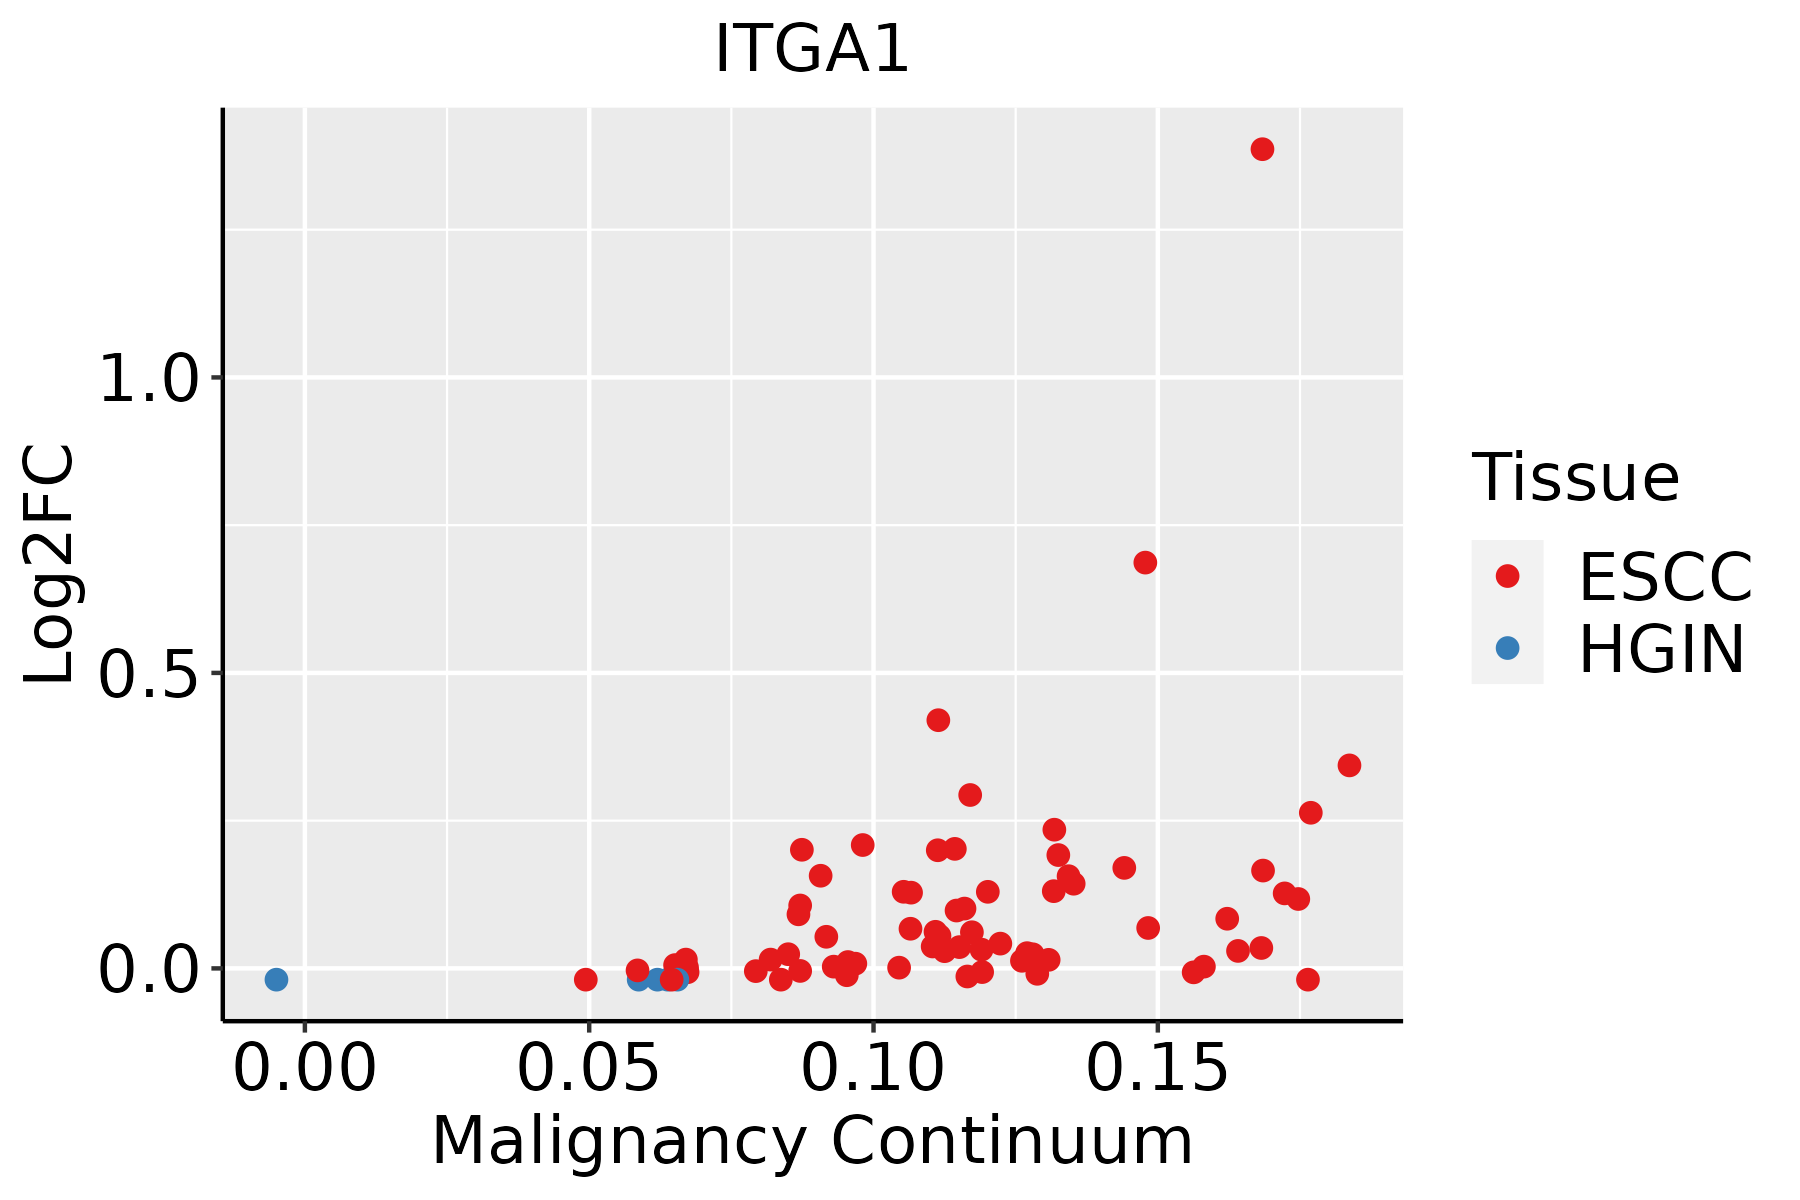 | ESCC: Esophageal squamous cell carcinoma |
| HGIN: High-grade intraepithelial neoplasias | ||
| LGIN: Low-grade intraepithelial neoplasias | ||
| Liver | 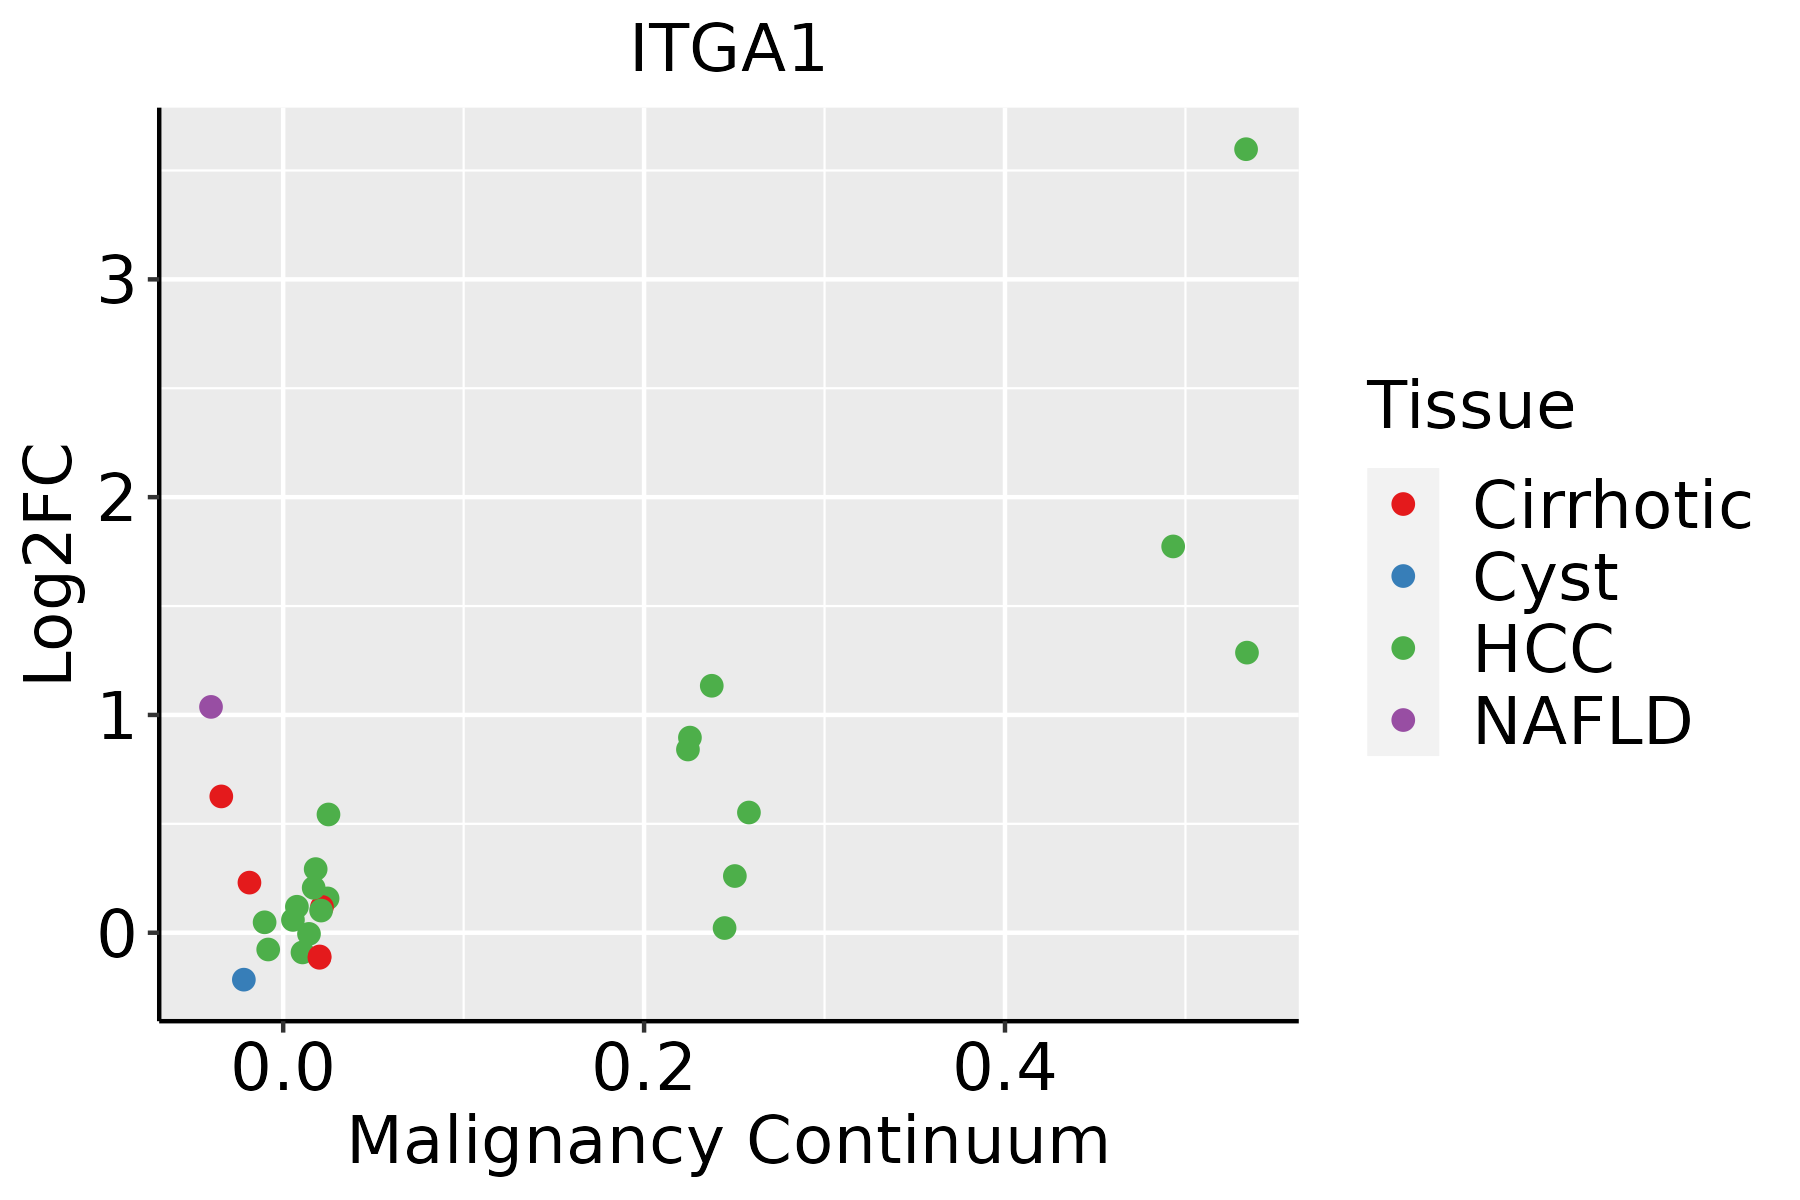 | HCC: Hepatocellular carcinoma |
| NAFLD: Non-alcoholic fatty liver disease | ||
| Lung | 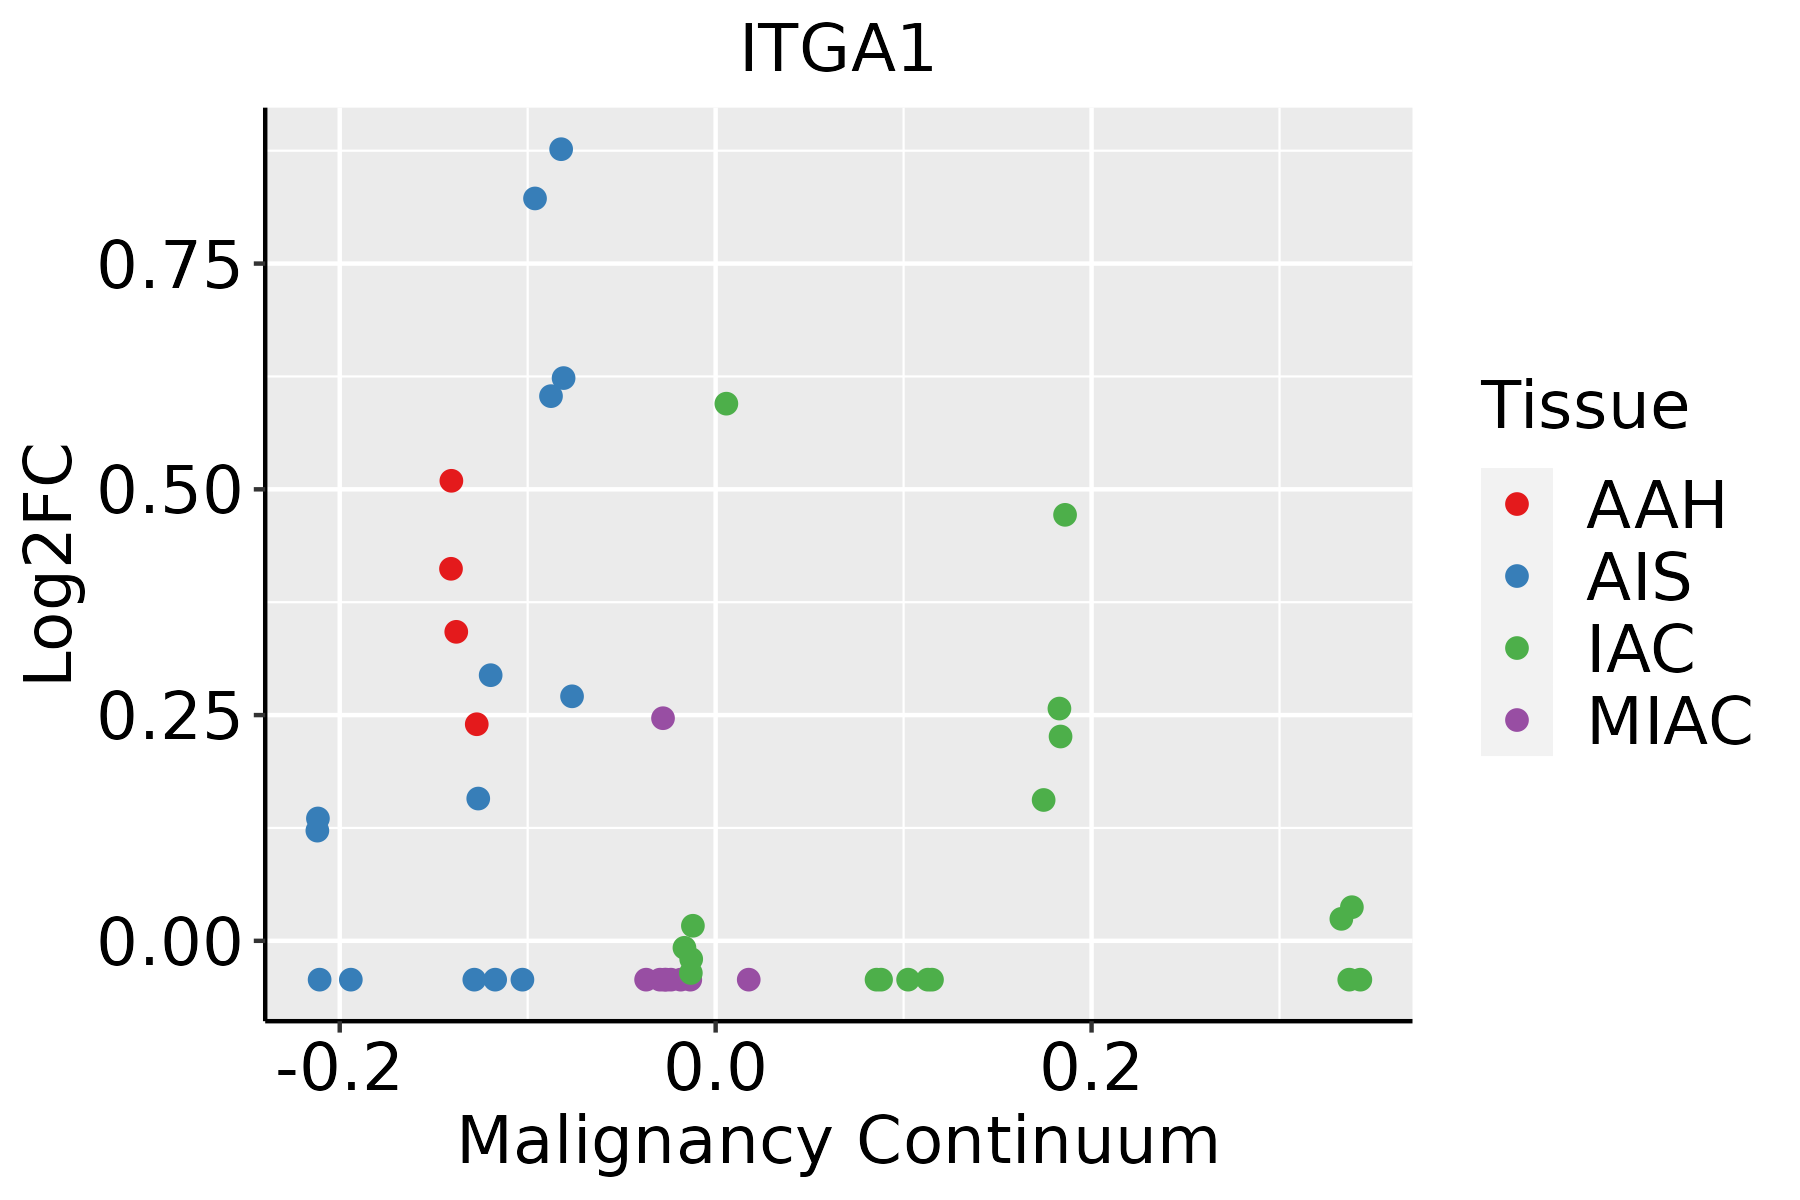 | AAH: Atypical adenomatous hyperplasia |
| AIS: Adenocarcinoma in situ | ||
| IAC: Invasive lung adenocarcinoma | ||
| MIA: Minimally invasive adenocarcinoma | ||
| Thyroid | 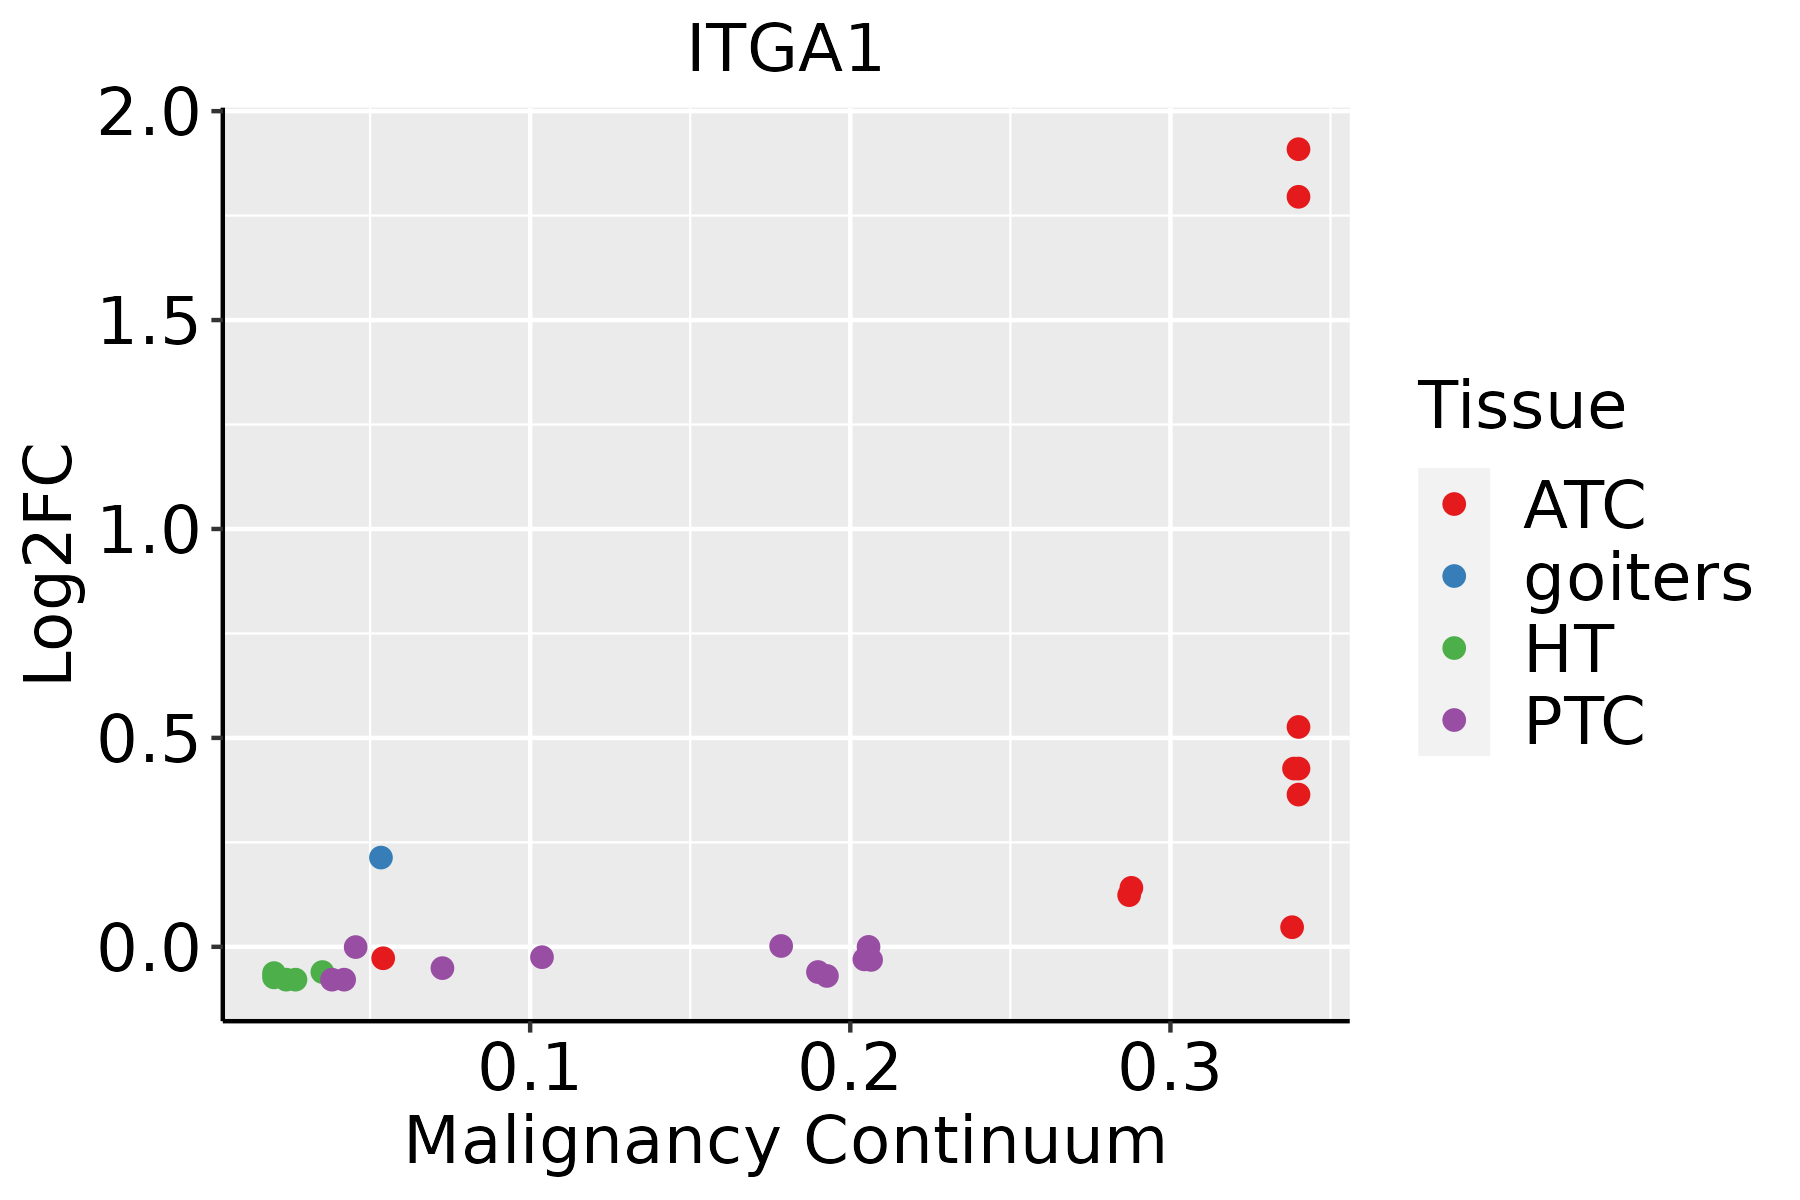 | ATC: Anaplastic thyroid cancer |
| HT: Hashimoto's thyroiditis | ||
| PTC: Papillary thyroid cancer |
| ∗log2FC in expression of this searched gene in stem-like cells from each diseased tissue sample relative to stem-like cells in normal samples in each tissue plotted against the malignancy continuum. Samples are colored based on if they are from different disease stage. |
Top |
Malignant transformation related pathway analysis |
| Find out the enriched GO biological processes and KEGG pathways involved in transition from healthy to precancer to cancer |
| Tissue | Disease Stage | Enriched GO biological Processes |
| Colorectum | AD |  |
| Colorectum | SER |  |
| Colorectum | MSS |  |
| Colorectum | MSI-H |  |
| Colorectum | FAP |  |
| ∗Top 15 enriched GO BP terms are showed in the bar plot of each disease state in each tissue. Each row represents a significant GO biological process which is colored according to the -log10(p.adjust). |
| Page: 1 2 3 4 5 6 7 8 9 |
| GO ID | Tissue | Disease Stage | Description | Gene Ratio | Bg Ratio | pvalue | p.adjust | Count |
| GO:001631110 | Esophagus | ESCC | dephosphorylation | 251/8552 | 417/18723 | 1.26e-09 | 2.99e-08 | 251 |
| GO:003158919 | Esophagus | ESCC | cell-substrate adhesion | 221/8552 | 363/18723 | 3.06e-09 | 6.62e-08 | 221 |
| GO:000647018 | Esophagus | ESCC | protein dephosphorylation | 177/8552 | 281/18723 | 3.13e-09 | 6.72e-08 | 177 |
| GO:0070997111 | Esophagus | ESCC | neuron death | 216/8552 | 361/18723 | 3.49e-08 | 6.45e-07 | 216 |
| GO:0035304111 | Esophagus | ESCC | regulation of protein dephosphorylation | 66/8552 | 90/18723 | 8.82e-08 | 1.48e-06 | 66 |
| GO:0035303111 | Esophagus | ESCC | regulation of dephosphorylation | 88/8552 | 128/18723 | 1.04e-07 | 1.71e-06 | 88 |
| GO:003812718 | Esophagus | ESCC | ERBB signaling pathway | 82/8552 | 121/18723 | 7.23e-07 | 9.40e-06 | 82 |
| GO:0051402110 | Esophagus | ESCC | neuron apoptotic process | 148/8552 | 246/18723 | 3.08e-06 | 3.47e-05 | 148 |
| GO:000716018 | Esophagus | ESCC | cell-matrix adhesion | 141/8552 | 233/18723 | 3.33e-06 | 3.71e-05 | 141 |
| GO:1901214111 | Esophagus | ESCC | regulation of neuron death | 186/8552 | 319/18723 | 3.35e-06 | 3.73e-05 | 186 |
| GO:000717318 | Esophagus | ESCC | epidermal growth factor receptor signaling pathway | 73/8552 | 108/18723 | 3.36e-06 | 3.73e-05 | 73 |
| GO:1901216111 | Esophagus | ESCC | positive regulation of neuron death | 65/8552 | 97/18723 | 1.76e-05 | 1.56e-04 | 65 |
| GO:190118413 | Esophagus | ESCC | regulation of ERBB signaling pathway | 54/8552 | 79/18723 | 3.81e-05 | 3.08e-04 | 54 |
| GO:00420588 | Esophagus | ESCC | regulation of epidermal growth factor receptor signaling pathway | 50/8552 | 73/18723 | 6.75e-05 | 5.12e-04 | 50 |
| GO:19011859 | Esophagus | ESCC | negative regulation of ERBB signaling pathway | 25/8552 | 32/18723 | 1.84e-04 | 1.17e-03 | 25 |
| GO:0043525110 | Esophagus | ESCC | positive regulation of neuron apoptotic process | 40/8552 | 58/18723 | 2.83e-04 | 1.71e-03 | 40 |
| GO:0043666110 | Esophagus | ESCC | regulation of phosphoprotein phosphatase activity | 40/8552 | 58/18723 | 2.83e-04 | 1.71e-03 | 40 |
| GO:00072299 | Esophagus | ESCC | integrin-mediated signaling pathway | 67/8552 | 107/18723 | 3.03e-04 | 1.81e-03 | 67 |
| GO:004352317 | Esophagus | ESCC | regulation of neuron apoptotic process | 122/8552 | 212/18723 | 3.21e-04 | 1.90e-03 | 122 |
| GO:00420599 | Esophagus | ESCC | negative regulation of epidermal growth factor receptor signaling pathway | 22/8552 | 28/18723 | 3.95e-04 | 2.26e-03 | 22 |
| Page: 1 2 3 4 5 6 7 |
| Pathway ID | Tissue | Disease Stage | Description | Gene Ratio | Bg Ratio | pvalue | p.adjust | qvalue | Count |
| hsa0516510 | Esophagus | ESCC | Human papillomavirus infection | 215/4205 | 331/8465 | 7.86e-09 | 7.12e-08 | 3.65e-08 | 215 |
| hsa0451020 | Esophagus | ESCC | Focal adhesion | 127/4205 | 203/8465 | 1.25e-04 | 4.99e-04 | 2.56e-04 | 127 |
| hsa0481028 | Esophagus | ESCC | Regulation of actin cytoskeleton | 133/4205 | 229/8465 | 5.94e-03 | 1.48e-02 | 7.56e-03 | 133 |
| hsa041517 | Esophagus | ESCC | PI3K-Akt signaling pathway | 197/4205 | 354/8465 | 1.24e-02 | 2.83e-02 | 1.45e-02 | 197 |
| hsa0516515 | Esophagus | ESCC | Human papillomavirus infection | 215/4205 | 331/8465 | 7.86e-09 | 7.12e-08 | 3.65e-08 | 215 |
| hsa04510111 | Esophagus | ESCC | Focal adhesion | 127/4205 | 203/8465 | 1.25e-04 | 4.99e-04 | 2.56e-04 | 127 |
| hsa04810112 | Esophagus | ESCC | Regulation of actin cytoskeleton | 133/4205 | 229/8465 | 5.94e-03 | 1.48e-02 | 7.56e-03 | 133 |
| hsa0415114 | Esophagus | ESCC | PI3K-Akt signaling pathway | 197/4205 | 354/8465 | 1.24e-02 | 2.83e-02 | 1.45e-02 | 197 |
| hsa0481010 | Liver | NAFLD | Regulation of actin cytoskeleton | 50/1043 | 229/8465 | 3.01e-05 | 7.59e-04 | 6.11e-04 | 50 |
| hsa045106 | Liver | NAFLD | Focal adhesion | 38/1043 | 203/8465 | 5.13e-03 | 4.43e-02 | 3.57e-02 | 38 |
| hsa0481011 | Liver | NAFLD | Regulation of actin cytoskeleton | 50/1043 | 229/8465 | 3.01e-05 | 7.59e-04 | 6.11e-04 | 50 |
| hsa0451011 | Liver | NAFLD | Focal adhesion | 38/1043 | 203/8465 | 5.13e-03 | 4.43e-02 | 3.57e-02 | 38 |
| hsa0451021 | Liver | Cirrhotic | Focal adhesion | 93/2530 | 203/8465 | 9.27e-07 | 1.10e-05 | 6.80e-06 | 93 |
| hsa0481021 | Liver | Cirrhotic | Regulation of actin cytoskeleton | 100/2530 | 229/8465 | 5.28e-06 | 5.50e-05 | 3.39e-05 | 100 |
| hsa05165 | Liver | Cirrhotic | Human papillomavirus infection | 124/2530 | 331/8465 | 1.55e-03 | 7.83e-03 | 4.83e-03 | 124 |
| hsa0451031 | Liver | Cirrhotic | Focal adhesion | 93/2530 | 203/8465 | 9.27e-07 | 1.10e-05 | 6.80e-06 | 93 |
| hsa0481031 | Liver | Cirrhotic | Regulation of actin cytoskeleton | 100/2530 | 229/8465 | 5.28e-06 | 5.50e-05 | 3.39e-05 | 100 |
| hsa051651 | Liver | Cirrhotic | Human papillomavirus infection | 124/2530 | 331/8465 | 1.55e-03 | 7.83e-03 | 4.83e-03 | 124 |
| hsa0451041 | Liver | HCC | Focal adhesion | 125/4020 | 203/8465 | 3.12e-05 | 1.88e-04 | 1.04e-04 | 125 |
| hsa051652 | Liver | HCC | Human papillomavirus infection | 188/4020 | 331/8465 | 3.34e-04 | 1.49e-03 | 8.29e-04 | 188 |
| Page: 1 2 3 |
Top |
Cell-cell communication analysis |
| Identification of potential cell-cell interactions between two cell types and their ligand-receptor pairs for different disease states |
| Ligand | Receptor | LRpair | Pathway | Tissue | Disease Stage |
| COL1A1 | ITGA1_ITGB1 | COL1A1_ITGA1_ITGB1 | COLLAGEN | Breast | ADJ |
| COL1A2 | ITGA1_ITGB1 | COL1A2_ITGA1_ITGB1 | COLLAGEN | Breast | ADJ |
| COL4A1 | ITGA1_ITGB1 | COL4A1_ITGA1_ITGB1 | COLLAGEN | Breast | ADJ |
| COL4A2 | ITGA1_ITGB1 | COL4A2_ITGA1_ITGB1 | COLLAGEN | Breast | ADJ |
| COL6A1 | ITGA1_ITGB1 | COL6A1_ITGA1_ITGB1 | COLLAGEN | Breast | ADJ |
| COL6A2 | ITGA1_ITGB1 | COL6A2_ITGA1_ITGB1 | COLLAGEN | Breast | ADJ |
| COL6A3 | ITGA1_ITGB1 | COL6A3_ITGA1_ITGB1 | COLLAGEN | Breast | ADJ |
| LAMA2 | ITGA1_ITGB1 | LAMA2_ITGA1_ITGB1 | LAMININ | Breast | ADJ |
| LAMA4 | ITGA1_ITGB1 | LAMA4_ITGA1_ITGB1 | LAMININ | Breast | ADJ |
| LAMB2 | ITGA1_ITGB1 | LAMB2_ITGA1_ITGB1 | LAMININ | Breast | ADJ |
| LAMB3 | ITGA1_ITGB1 | LAMB3_ITGA1_ITGB1 | LAMININ | Breast | ADJ |
| LAMC1 | ITGA1_ITGB1 | LAMC1_ITGA1_ITGB1 | LAMININ | Breast | ADJ |
| LAMC2 | ITGA1_ITGB1 | LAMC2_ITGA1_ITGB1 | LAMININ | Breast | ADJ |
| COL1A1 | ITGA1_ITGB1 | COL1A1_ITGA1_ITGB1 | COLLAGEN | Breast | DCIS |
| COL1A2 | ITGA1_ITGB1 | COL1A2_ITGA1_ITGB1 | COLLAGEN | Breast | DCIS |
| COL4A1 | ITGA1_ITGB1 | COL4A1_ITGA1_ITGB1 | COLLAGEN | Breast | DCIS |
| COL4A2 | ITGA1_ITGB1 | COL4A2_ITGA1_ITGB1 | COLLAGEN | Breast | DCIS |
| COL6A1 | ITGA1_ITGB1 | COL6A1_ITGA1_ITGB1 | COLLAGEN | Breast | DCIS |
| COL6A2 | ITGA1_ITGB1 | COL6A2_ITGA1_ITGB1 | COLLAGEN | Breast | DCIS |
| COL6A3 | ITGA1_ITGB1 | COL6A3_ITGA1_ITGB1 | COLLAGEN | Breast | DCIS |
| Page: 1 |
Top |
Single-cell gene regulatory network inference analysis |
| Find out the significant the regulons (TFs) and the target genes of each regulon across cell types for different disease states |
| TF | Cell Type | Tissue | Disease Stage | Target Gene | RSS | Regulon Activity |
| ∗The dot plots of a searched regulon are shown for all cell subpopulations in each disease state of each tissue based on the regulon specific score inferred using pySCENIC and by calculating the average expression. |
| Page: 1 |
Top |
Somatic mutation of malignant transformation related genes |
| Annotation of somatic variants for genes involved in malignant transformation |
| Hugo Symbol | Variant Class | Variant Classification | dbSNP RS | HGVSc | HGVSp | HGVSp Short | SWISSPROT | BIOTYPE | SIFT | PolyPhen | Tumor Sample Barcode | Tissue | Histology | Sex | Age | Stage | Therapy Types | Drugs | Outcome |
| ITGA1 | SNV | Missense_Mutation | novel | c.1904N>T | p.Gln635Leu | p.Q635L | P56199 | protein_coding | deleterious(0.01) | possibly_damaging(0.829) | TCGA-CN-6988-01 | Oral cavity | head & neck squamous cell carcinoma | Male | <65 | I/II | Unknown | Unknown | SD |
| ITGA1 | SNV | Missense_Mutation | novel | c.769N>A | p.Ala257Thr | p.A257T | P56199 | protein_coding | deleterious(0.02) | possibly_damaging(0.47) | TCGA-CN-A498-01 | Oral cavity | head & neck squamous cell carcinoma | Female | <65 | III/IV | Chemotherapy | carboplatin | PD |
| ITGA1 | SNV | Missense_Mutation | novel | c.3151A>G | p.Thr1051Ala | p.T1051A | P56199 | protein_coding | tolerated(0.32) | benign(0.005) | TCGA-CQ-5323-01 | Oral cavity | head & neck squamous cell carcinoma | Male | >=65 | I/II | Unknown | Unknown | SD |
| ITGA1 | SNV | Missense_Mutation | rs199962878 | c.1893A>T | p.Lys631Asn | p.K631N | P56199 | protein_coding | deleterious(0.02) | possibly_damaging(0.467) | TCGA-V1-A8WW-01 | Prostate | prostate adenocarcinoma | Male | <65 | 9 | Hormone Therapy | lhrh | SD |
| ITGA1 | SNV | Missense_Mutation | novel | c.1763N>G | p.Asp588Gly | p.D588G | P56199 | protein_coding | deleterious(0) | probably_damaging(0.992) | TCGA-XK-AAIW-01 | Prostate | prostate adenocarcinoma | Male | >=65 | 9 | Unknown | Unknown | PD |
| ITGA1 | SNV | Missense_Mutation | rs200592092 | c.200N>T | p.Pro67Leu | p.P67L | P56199 | protein_coding | deleterious(0) | probably_damaging(1) | TCGA-BR-6452-01 | Stomach | stomach adenocarcinoma | Female | >=65 | I/II | Unknown | Unknown | SD |
| ITGA1 | SNV | Missense_Mutation | c.2861N>T | p.Ser954Ile | p.S954I | P56199 | protein_coding | tolerated(0.1) | benign(0.332) | TCGA-BR-7707-01 | Stomach | stomach adenocarcinoma | Female | >=65 | I/II | Unknown | Unknown | SD | |
| ITGA1 | SNV | Missense_Mutation | c.1223N>G | p.Gln408Arg | p.Q408R | P56199 | protein_coding | tolerated(0.07) | benign(0.13) | TCGA-BR-8368-01 | Stomach | stomach adenocarcinoma | Female | >=65 | I/II | Unknown | Unknown | SD | |
| ITGA1 | SNV | Missense_Mutation | c.1641N>C | p.Gln547His | p.Q547H | P56199 | protein_coding | deleterious(0) | possibly_damaging(0.868) | TCGA-CG-5717-01 | Stomach | stomach adenocarcinoma | Male | <65 | I/II | Chemotherapy | 5-fluorouracil | PD | |
| ITGA1 | SNV | Missense_Mutation | c.2921N>G | p.Asn974Ser | p.N974S | P56199 | protein_coding | tolerated(0.22) | benign(0.034) | TCGA-D7-A4YU-01 | Stomach | stomach adenocarcinoma | Male | >=65 | III/IV | Chemotherapy | capecitabine | SD |
| Page: 1 2 3 4 5 6 7 8 9 10 11 12 13 |
Top |
Related drugs of malignant transformation related genes |
| Identification of chemicals and drugs interact with genes involved in malignant transfromation |
| (DGIdb 4.0) |
| Entrez ID | Symbol | Category | Interaction Types | Drug Claim Name | Drug Name | PMIDs |
| 3672 | ITGA1 | DRUGGABLE GENOME, EXTERNAL SIDE OF PLASMA MEMBRANE, CELL SURFACE | SAN-300 | SAN-300 | ||
| 3672 | ITGA1 | DRUGGABLE GENOME, EXTERNAL SIDE OF PLASMA MEMBRANE, CELL SURFACE | SAN-300 | SAN-300 |
| Page: 1 |

Copyright 2023-Present -The University of Texas Health Science Center at Houston |