
|
|||||
|
 | |
| |
| |
| |
| |
| |
|
Gene: ZNF90 |
Gene summary for ZNF90 |
| Gene information | Species | Human | Gene symbol | ZNF90 | Gene ID | 7643 |
| Gene name | zinc finger protein 90 | |
| Gene Alias | HTF9 | |
| Cytomap | 19p12 | |
| Gene Type | protein-coding | GO ID | GO:0006139 | UniProtAcc | Q03938 |
Top |
Malignant transformation analysis |
| Identification of the aberrant gene expression in precancerous and cancerous lesions by comparing the gene expression of stem-like cells in diseased tissues with normal stem cells |
| Entrez ID | Symbol | Replicates | Species | Organ | Tissue | Adj P-value | Log2FC | Malignancy |
| 7643 | ZNF90 | GSM4909281 | Human | Breast | IDC | 5.60e-21 | 5.29e-01 | 0.21 |
| 7643 | ZNF90 | GSM4909311 | Human | Breast | IDC | 8.34e-04 | -9.27e-02 | 0.1534 |
| 7643 | ZNF90 | GSM4909319 | Human | Breast | IDC | 8.07e-06 | -1.15e-01 | 0.1563 |
| 7643 | ZNF90 | GSM4909320 | Human | Breast | IDC | 4.52e-08 | 5.89e-01 | 0.1575 |
| 7643 | ZNF90 | GSM4909321 | Human | Breast | IDC | 1.46e-06 | 2.87e-01 | 0.1559 |
| 7643 | ZNF90 | DCIS2 | Human | Breast | DCIS | 2.19e-03 | -8.95e-02 | 0.0085 |
| 7643 | ZNF90 | EEC-subject2 | Human | Endometrium | EEC | 3.98e-03 | -1.25e-01 | -0.2607 |
| 7643 | ZNF90 | EEC-subject3 | Human | Endometrium | EEC | 1.09e-10 | -1.30e-01 | -0.2525 |
| 7643 | ZNF90 | EEC-subject5 | Human | Endometrium | EEC | 1.82e-05 | -1.36e-01 | -0.249 |
| 7643 | ZNF90 | GSM6177620_NYU_UCEC1_lib1_lib1 | Human | Endometrium | EEC | 3.14e-50 | 1.21e+00 | -0.1869 |
| 7643 | ZNF90 | GSM6177620_NYU_UCEC1_lib2_lib2 | Human | Endometrium | EEC | 3.60e-52 | 1.28e+00 | -0.1875 |
| 7643 | ZNF90 | GSM6177620_NYU_UCEC1_lib3_lib3 | Human | Endometrium | EEC | 2.61e-70 | 1.41e+00 | -0.1883 |
| 7643 | ZNF90 | GSM6177621_NYU_UCEC2_lib1_lib1 | Human | Endometrium | EEC | 4.35e-35 | 8.85e-01 | -0.1934 |
| 7643 | ZNF90 | GSM6177622_NYU_UCEC3_lib1_lib1 | Human | Endometrium | EEC | 2.20e-61 | 1.17e+00 | -0.1917 |
| 7643 | ZNF90 | GSM6177622_NYU_UCEC3_lib2_lib2 | Human | Endometrium | EEC | 2.80e-49 | 1.07e+00 | -0.1916 |
| 7643 | ZNF90 | S41 | Human | Liver | Cirrhotic | 1.99e-06 | -7.80e-01 | -0.0343 |
| 7643 | ZNF90 | S42 | Human | Liver | HCC | 1.07e-02 | -6.48e-01 | -0.0103 |
| 7643 | ZNF90 | S43 | Human | Liver | Cirrhotic | 6.77e-38 | -7.67e-01 | -0.0187 |
| 7643 | ZNF90 | S44 | Human | Liver | HCC | 2.02e-02 | -7.80e-01 | -0.0083 |
| 7643 | ZNF90 | HCC1_Meng | Human | Liver | HCC | 7.20e-36 | -7.70e-01 | 0.0246 |
| Page: 1 2 3 4 5 |
| Tissue | Expression Dynamics | Abbreviation |
| Breast |  | IDC: Invasive ductal carcinoma |
| DCIS: Ductal carcinoma in situ | ||
| Precancer(BRCA1-mut): Precancerous lesion from BRCA1 mutation carriers | ||
| Endometrium | 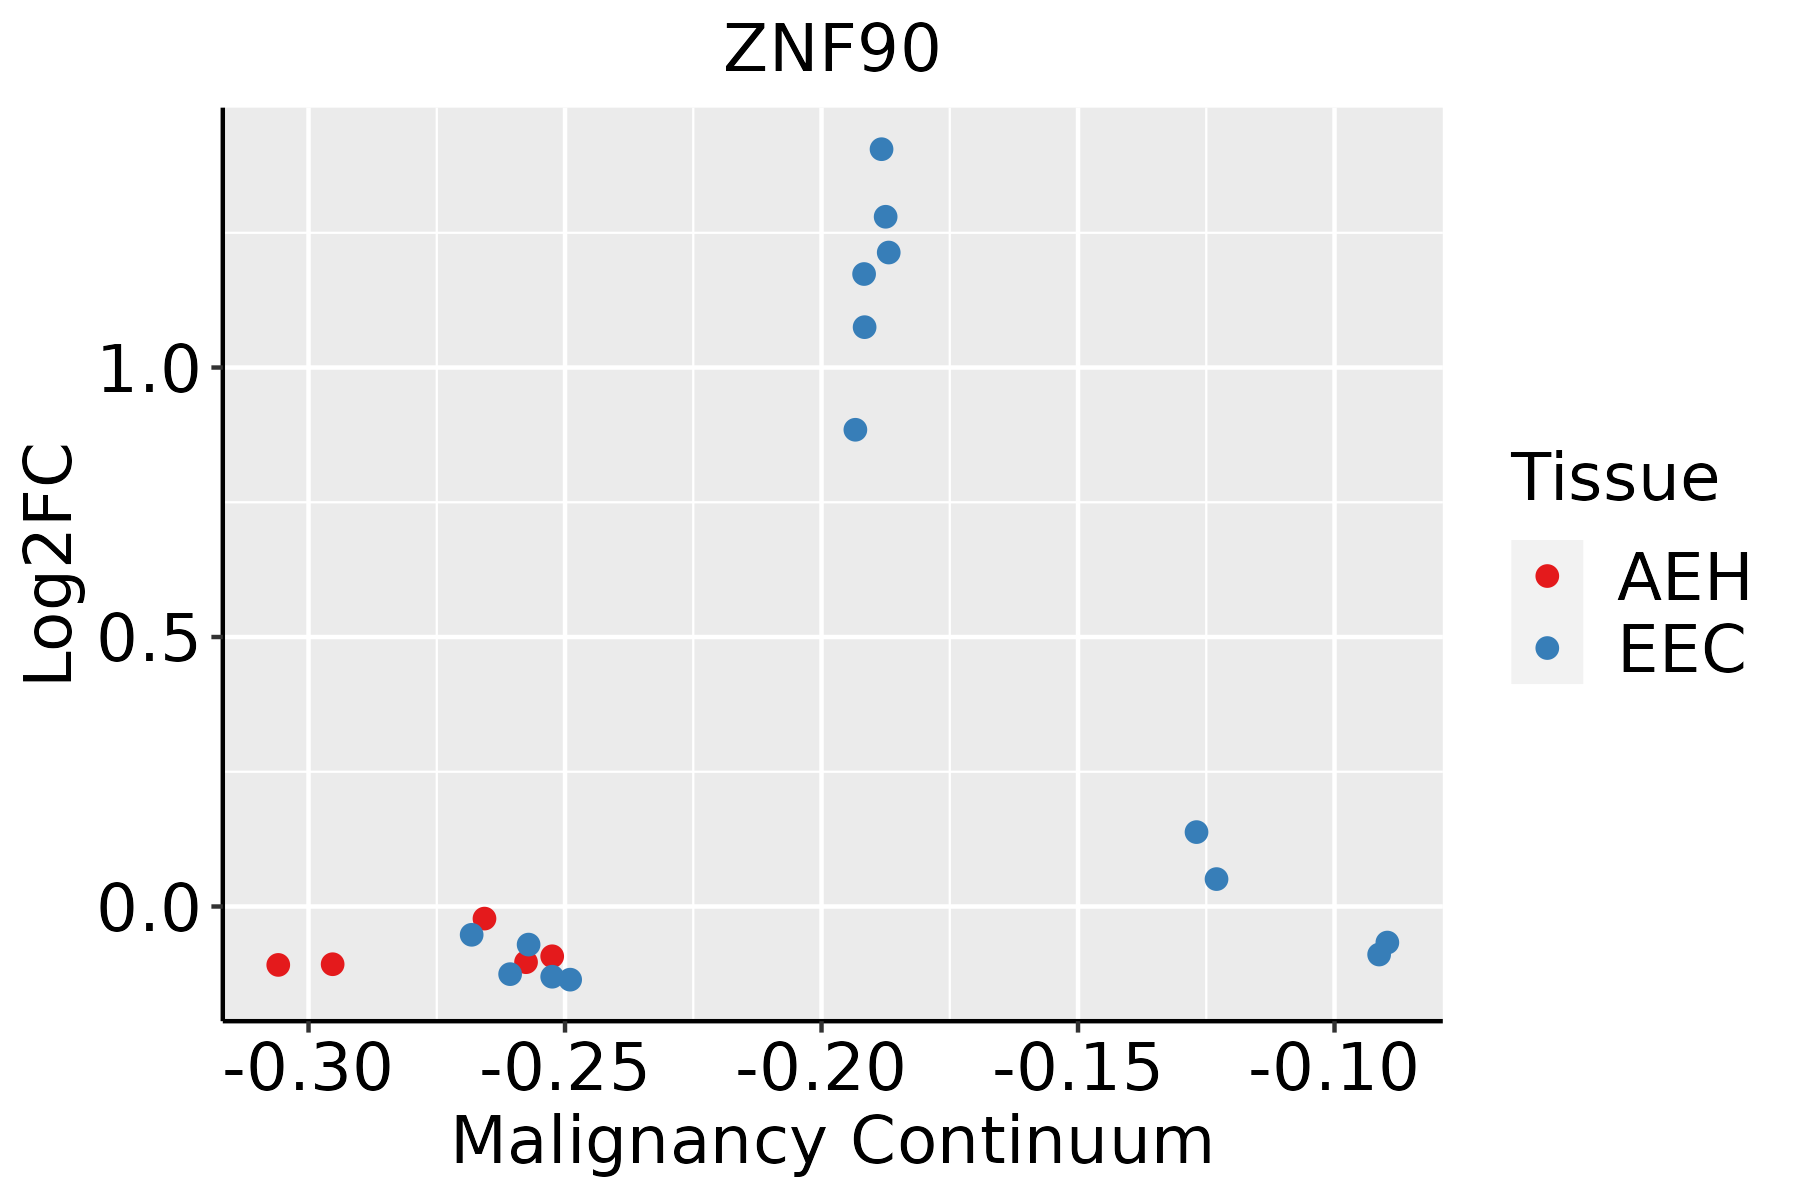 | AEH: Atypical endometrial hyperplasia |
| EEC: Endometrioid Cancer | ||
| Liver |  | HCC: Hepatocellular carcinoma |
| NAFLD: Non-alcoholic fatty liver disease | ||
| Oral Cavity | 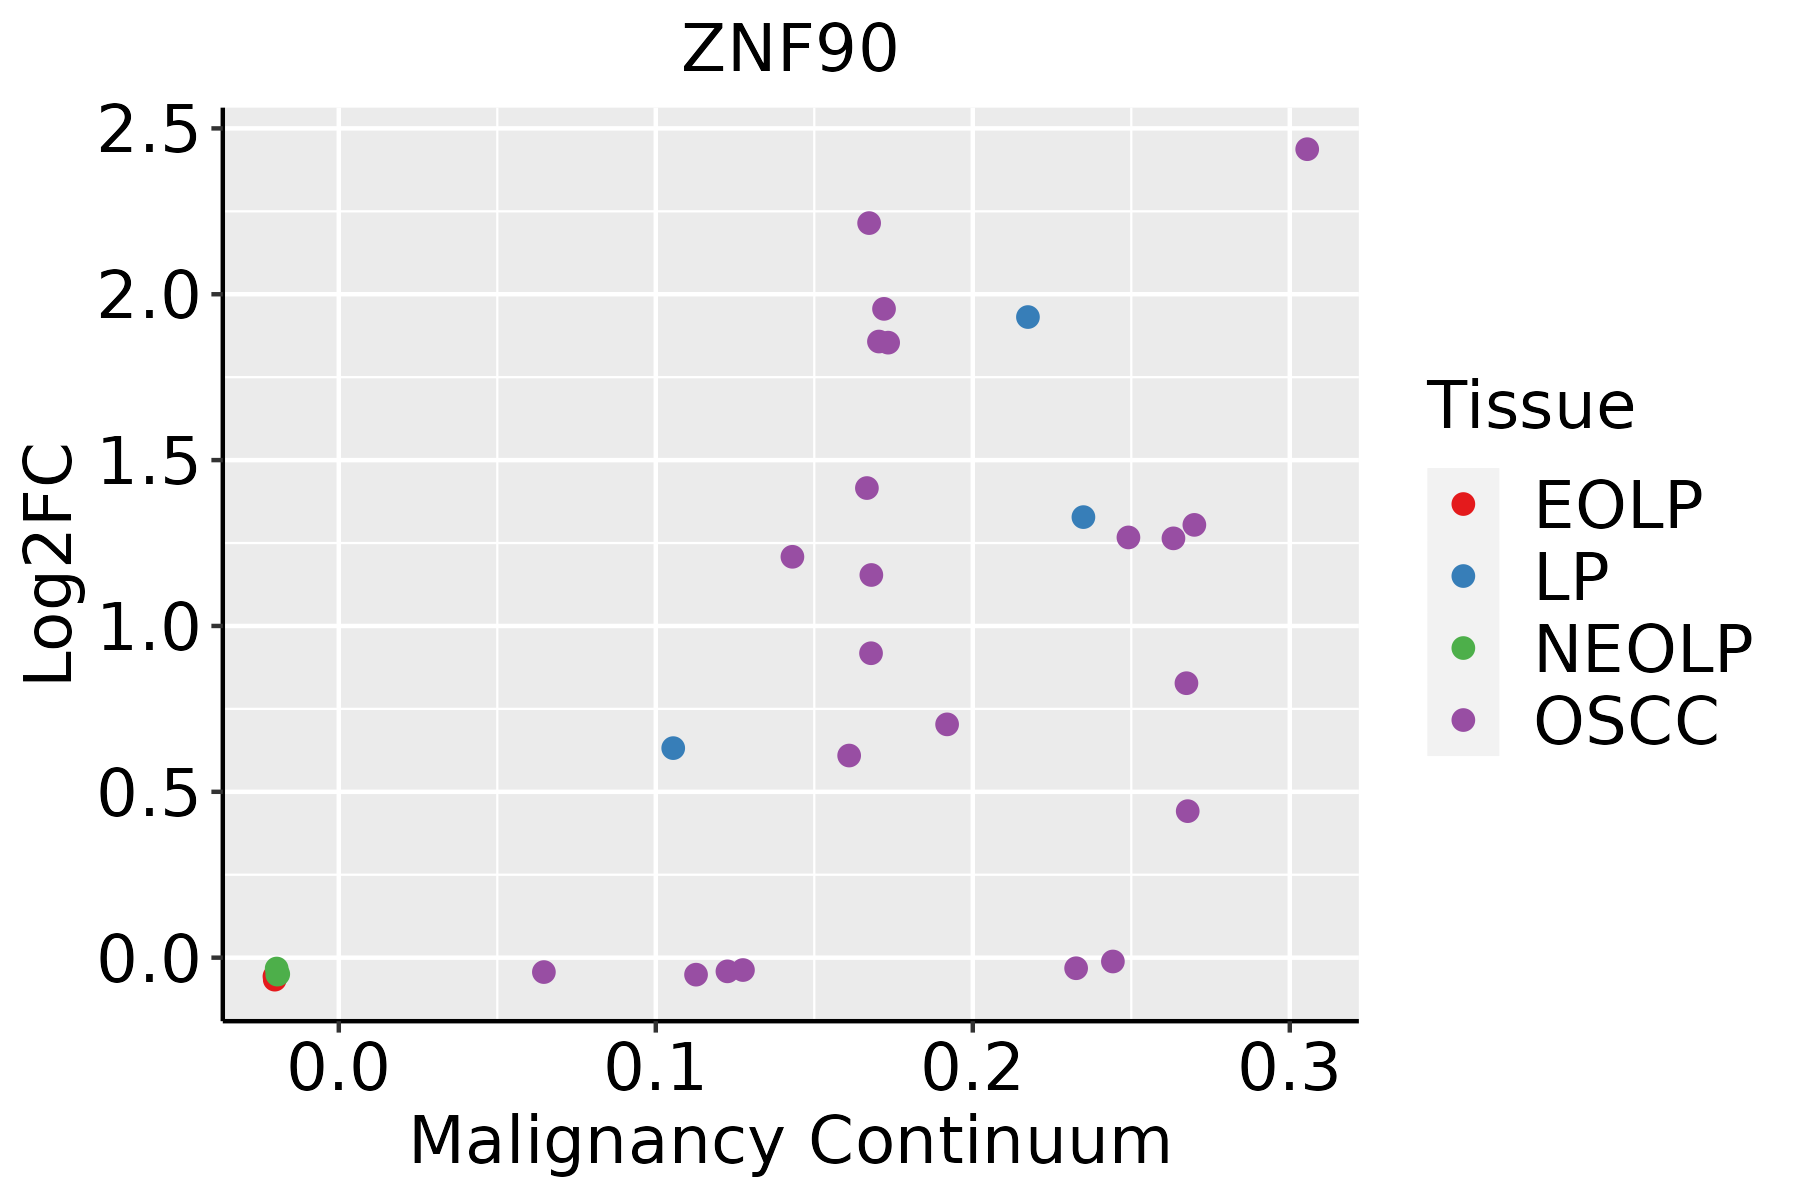 | EOLP: Erosive Oral lichen planus |
| LP: leukoplakia | ||
| NEOLP: Non-erosive oral lichen planus | ||
| OSCC: Oral squamous cell carcinoma | ||
| Skin | 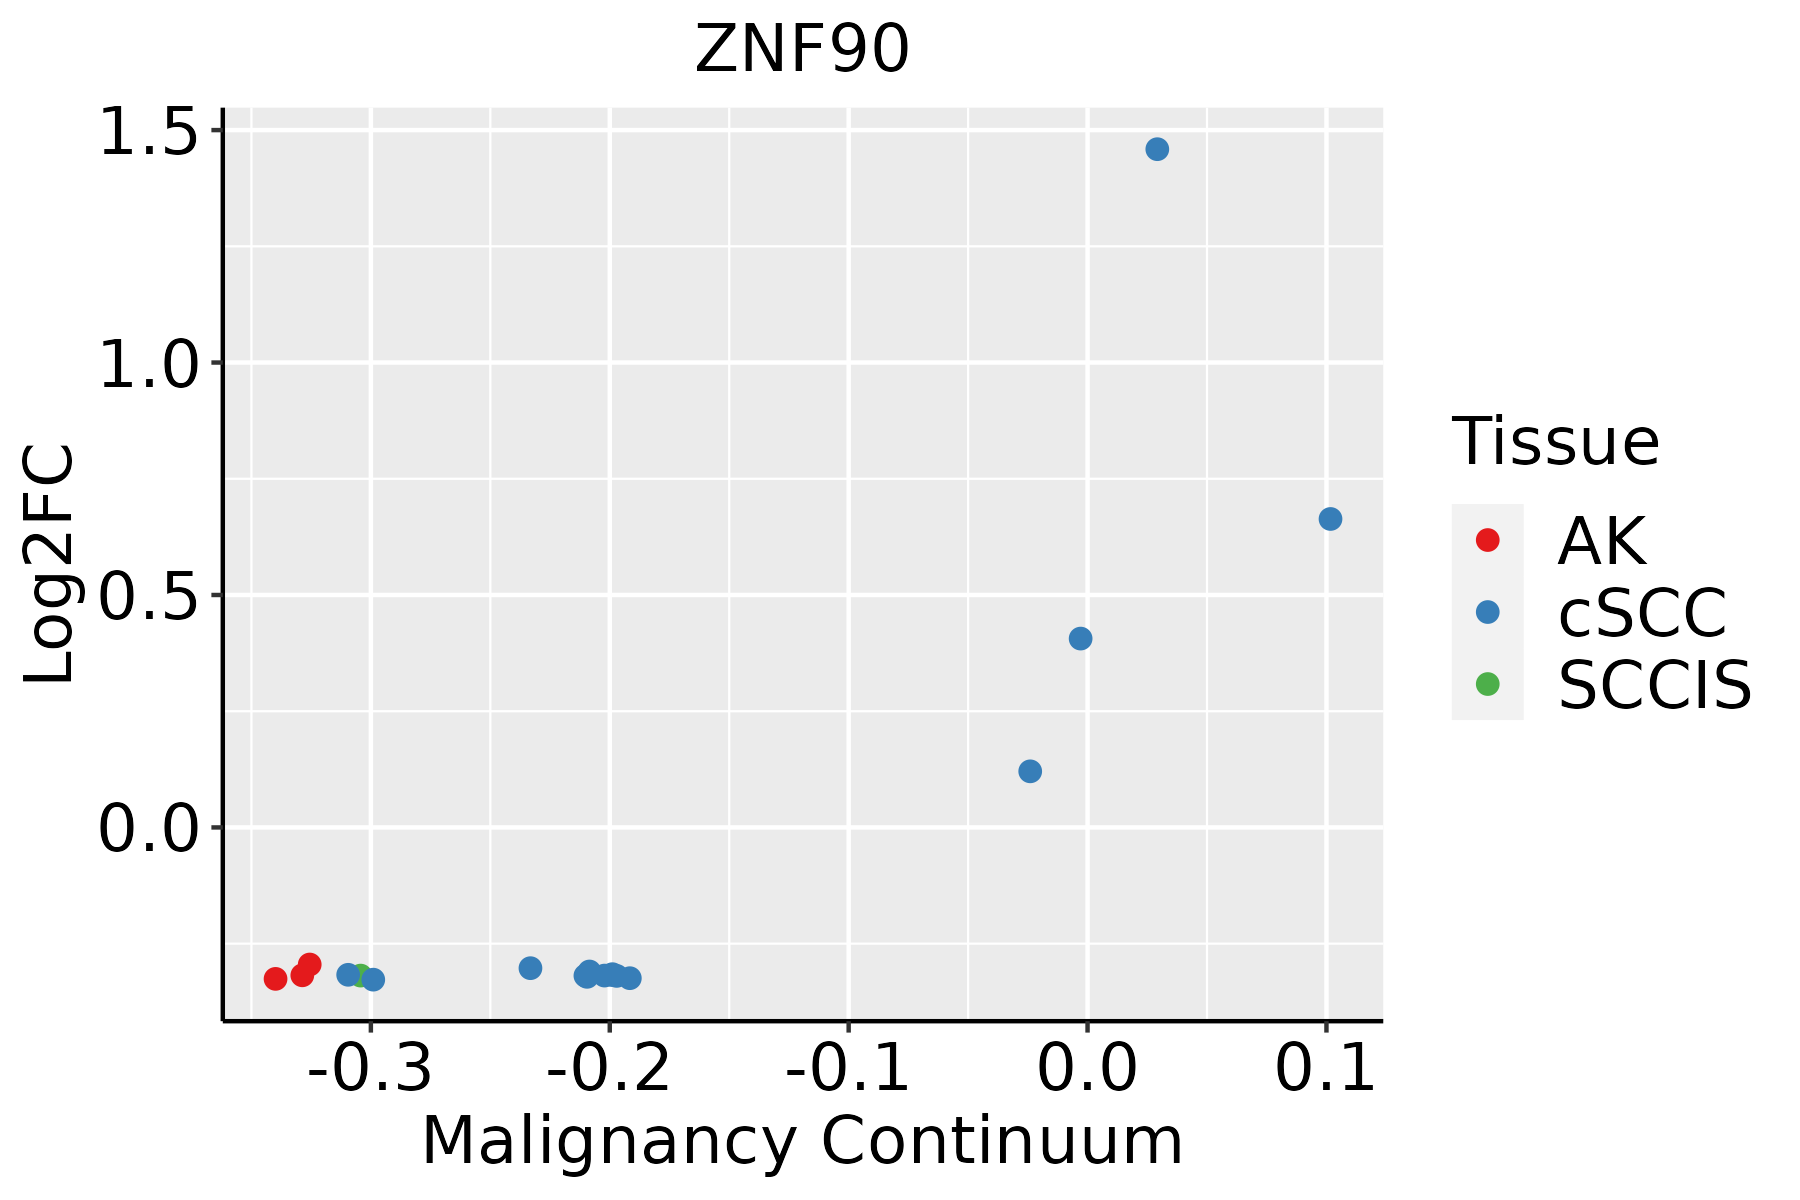 | AK: Actinic keratosis |
| cSCC: Cutaneous squamous cell carcinoma | ||
| SCCIS:squamous cell carcinoma in situ | ||
| Thyroid | 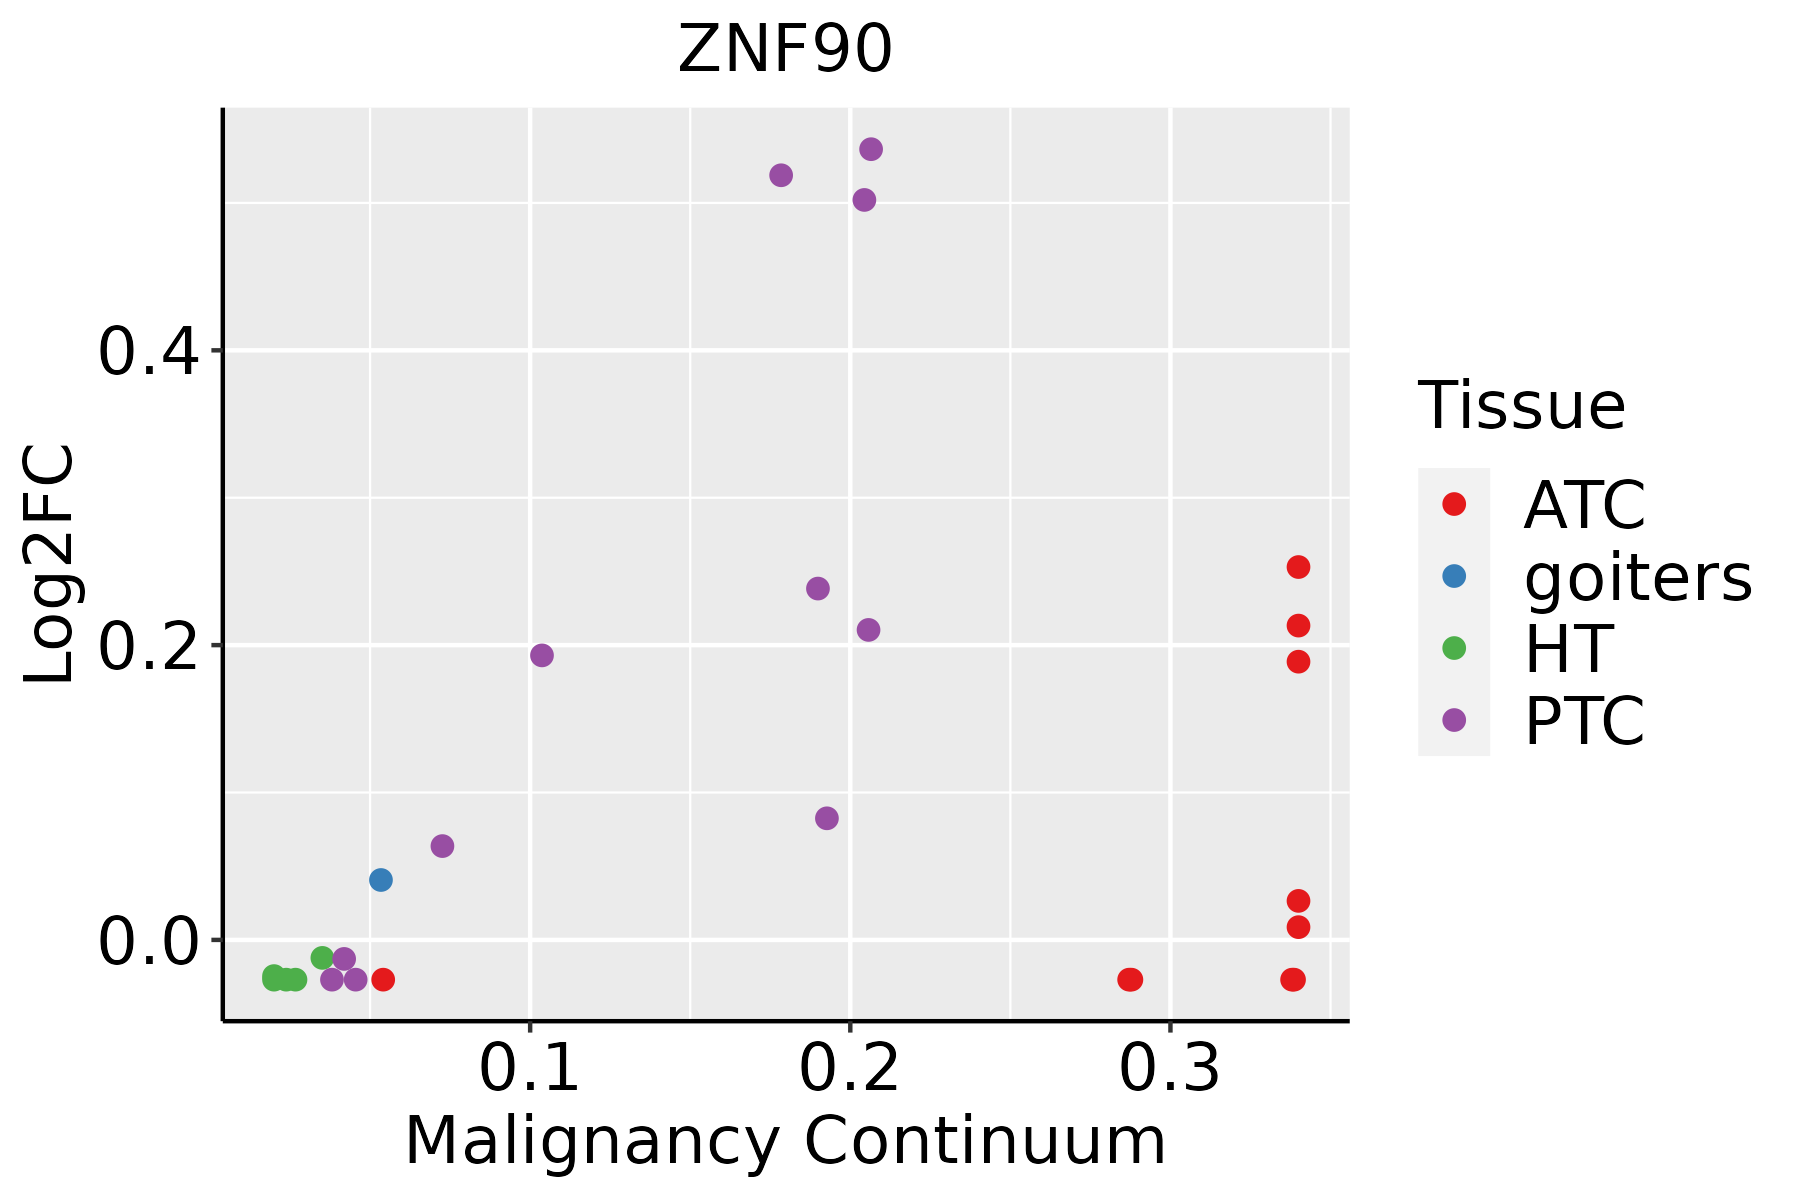 | ATC: Anaplastic thyroid cancer |
| HT: Hashimoto's thyroiditis | ||
| PTC: Papillary thyroid cancer |
| ∗log2FC in expression of this searched gene in stem-like cells from each diseased tissue sample relative to stem-like cells in normal samples in each tissue plotted against the malignancy continuum. Samples are colored based on if they are from different disease stage. |
Top |
Malignant transformation related pathway analysis |
| Find out the enriched GO biological processes and KEGG pathways involved in transition from healthy to precancer to cancer |
| Tissue | Disease Stage | Enriched GO biological Processes |
| Colorectum | AD |  |
| Colorectum | SER |  |
| Colorectum | MSS |  |
| Colorectum | MSI-H |  |
| Colorectum | FAP |  |
| ∗Top 15 enriched GO BP terms are showed in the bar plot of each disease state in each tissue. Each row represents a significant GO biological process which is colored according to the -log10(p.adjust). |
| Page: 1 2 3 4 5 6 7 8 9 |
| GO ID | Tissue | Disease Stage | Description | Gene Ratio | Bg Ratio | pvalue | p.adjust | Count |
| Page: 1 |
| Pathway ID | Tissue | Disease Stage | Description | Gene Ratio | Bg Ratio | pvalue | p.adjust | qvalue | Count |
| Page: 1 |
Top |
Cell-cell communication analysis |
| Identification of potential cell-cell interactions between two cell types and their ligand-receptor pairs for different disease states |
| Ligand | Receptor | LRpair | Pathway | Tissue | Disease Stage |
| Page: 1 |
Top |
Single-cell gene regulatory network inference analysis |
| Find out the significant the regulons (TFs) and the target genes of each regulon across cell types for different disease states |
| TF | Cell Type | Tissue | Disease Stage | Target Gene | RSS | Regulon Activity |
| ZNF90 | CAF | Breast | Healthy | GNB2L1,RPS17,ATP5E, etc. | 3.88e-01 |  |
| ZNF90 | MSC | Breast | Precancer | GNB2L1,RPS17,ATP5E, etc. | 3.30e-01 |  |
| ZNF90 | TH1 | Lung | IAC | RARRES3,FAM65B,GLTSCR2, etc. | 2.30e-01 |  |
| ZNF90 | ALVMAC | Lung | IAC | RARRES3,FAM65B,GLTSCR2, etc. | 9.93e-02 | |
| ZNF90 | GC | Lung | IAC | RARRES3,FAM65B,GLTSCR2, etc. | 6.66e-02 | |
| ZNF90 | MMC | Lung | IAC | RARRES3,FAM65B,GLTSCR2, etc. | 2.85e-02 | |
| ∗The dot plots of a searched regulon are shown for all cell subpopulations in each disease state of each tissue based on the regulon specific score inferred using pySCENIC and by calculating the average expression. |
| Page: 1 |
Top |
Somatic mutation of malignant transformation related genes |
| Annotation of somatic variants for genes involved in malignant transformation |
| Hugo Symbol | Variant Class | Variant Classification | dbSNP RS | HGVSc | HGVSp | HGVSp Short | SWISSPROT | BIOTYPE | SIFT | PolyPhen | Tumor Sample Barcode | Tissue | Histology | Sex | Age | Stage | Therapy Types | Drugs | Outcome |
| ZNF90 | insertion | In_Frame_Ins | novel | c.518_519insTTTTAA | p.Phe173_Lys174insPheAsn | p.F173_K174insFN | Q03938 | protein_coding | TCGA-DJ-A3VL-01 | Thyroid | thyroid carcinoma | Male | <65 | I/II | Unknown | Unknown | PD | ||
| ZNF90 | insertion | In_Frame_Ins | novel | c.518_519insTTTTAA | p.Phe173_Lys174insPheAsn | p.F173_K174insFN | Q03938 | protein_coding | TCGA-EL-A3ZM-01 | Thyroid | thyroid carcinoma | Male | <65 | I/II | Unknown | Unknown | SD | ||
| ZNF90 | insertion | Frame_Shift_Ins | novel | c.518_519insTTTTAACTCTAAATTGC | p.Lys174PhefsTer9 | p.K174Ffs*9 | Q03938 | protein_coding | TCGA-FY-A4B0-01 | Thyroid | thyroid carcinoma | Male | >=65 | I/II | Hormone Therapy | synthroid | SD |
| Page: 1 2 3 4 5 6 7 8 9 10 11 |
Top |
Related drugs of malignant transformation related genes |
| Identification of chemicals and drugs interact with genes involved in malignant transfromation |
| (DGIdb 4.0) |
| Entrez ID | Symbol | Category | Interaction Types | Drug Claim Name | Drug Name | PMIDs |
| Page: 1 |

Copyright 2023-Present -The University of Texas Health Science Center at Houston |