
|
|||||
|
 | |
| |
| |
| |
| |
| |
|
Gene: SAMD9 |
Gene summary for SAMD9 |
| Gene information | Species | Human | Gene symbol | SAMD9 | Gene ID | 54809 |
| Gene name | sterile alpha motif domain containing 9 | |
| Gene Alias | C7orf5 | |
| Cytomap | 7q21.2 | |
| Gene Type | protein-coding | GO ID | GO:0006810 | UniProtAcc | Q5K651 |
Top |
Malignant transformation analysis |
| Identification of the aberrant gene expression in precancerous and cancerous lesions by comparing the gene expression of stem-like cells in diseased tissues with normal stem cells |
| Entrez ID | Symbol | Replicates | Species | Organ | Tissue | Adj P-value | Log2FC | Malignancy |
| 54809 | SAMD9 | LZE4T | Human | Esophagus | ESCC | 1.28e-09 | 3.24e-01 | 0.0811 |
| 54809 | SAMD9 | LZE20T | Human | Esophagus | ESCC | 2.60e-09 | 6.52e-01 | 0.0662 |
| 54809 | SAMD9 | LZE24T | Human | Esophagus | ESCC | 1.12e-13 | 8.47e-01 | 0.0596 |
| 54809 | SAMD9 | P1T-E | Human | Esophagus | ESCC | 9.94e-05 | 4.34e-01 | 0.0875 |
| 54809 | SAMD9 | P2T-E | Human | Esophagus | ESCC | 5.88e-35 | 5.57e-01 | 0.1177 |
| 54809 | SAMD9 | P4T-E | Human | Esophagus | ESCC | 2.17e-11 | 3.57e-01 | 0.1323 |
| 54809 | SAMD9 | P5T-E | Human | Esophagus | ESCC | 2.73e-26 | 4.88e-01 | 0.1327 |
| 54809 | SAMD9 | P8T-E | Human | Esophagus | ESCC | 2.51e-33 | 6.65e-01 | 0.0889 |
| 54809 | SAMD9 | P9T-E | Human | Esophagus | ESCC | 1.67e-17 | 6.11e-01 | 0.1131 |
| 54809 | SAMD9 | P11T-E | Human | Esophagus | ESCC | 3.40e-21 | 1.04e+00 | 0.1426 |
| 54809 | SAMD9 | P12T-E | Human | Esophagus | ESCC | 1.88e-04 | 1.11e-01 | 0.1122 |
| 54809 | SAMD9 | P15T-E | Human | Esophagus | ESCC | 1.44e-08 | 2.86e-01 | 0.1149 |
| 54809 | SAMD9 | P17T-E | Human | Esophagus | ESCC | 4.47e-15 | 1.05e+00 | 0.1278 |
| 54809 | SAMD9 | P20T-E | Human | Esophagus | ESCC | 1.37e-23 | 8.73e-01 | 0.1124 |
| 54809 | SAMD9 | P21T-E | Human | Esophagus | ESCC | 8.99e-32 | 7.27e-01 | 0.1617 |
| 54809 | SAMD9 | P22T-E | Human | Esophagus | ESCC | 2.48e-06 | 1.36e-01 | 0.1236 |
| 54809 | SAMD9 | P23T-E | Human | Esophagus | ESCC | 2.18e-19 | 7.14e-01 | 0.108 |
| 54809 | SAMD9 | P24T-E | Human | Esophagus | ESCC | 1.23e-19 | 4.54e-01 | 0.1287 |
| 54809 | SAMD9 | P26T-E | Human | Esophagus | ESCC | 1.14e-26 | 5.12e-01 | 0.1276 |
| 54809 | SAMD9 | P27T-E | Human | Esophagus | ESCC | 1.11e-12 | 3.28e-01 | 0.1055 |
| Page: 1 2 3 4 5 |
| Tissue | Expression Dynamics | Abbreviation |
| Esophagus | 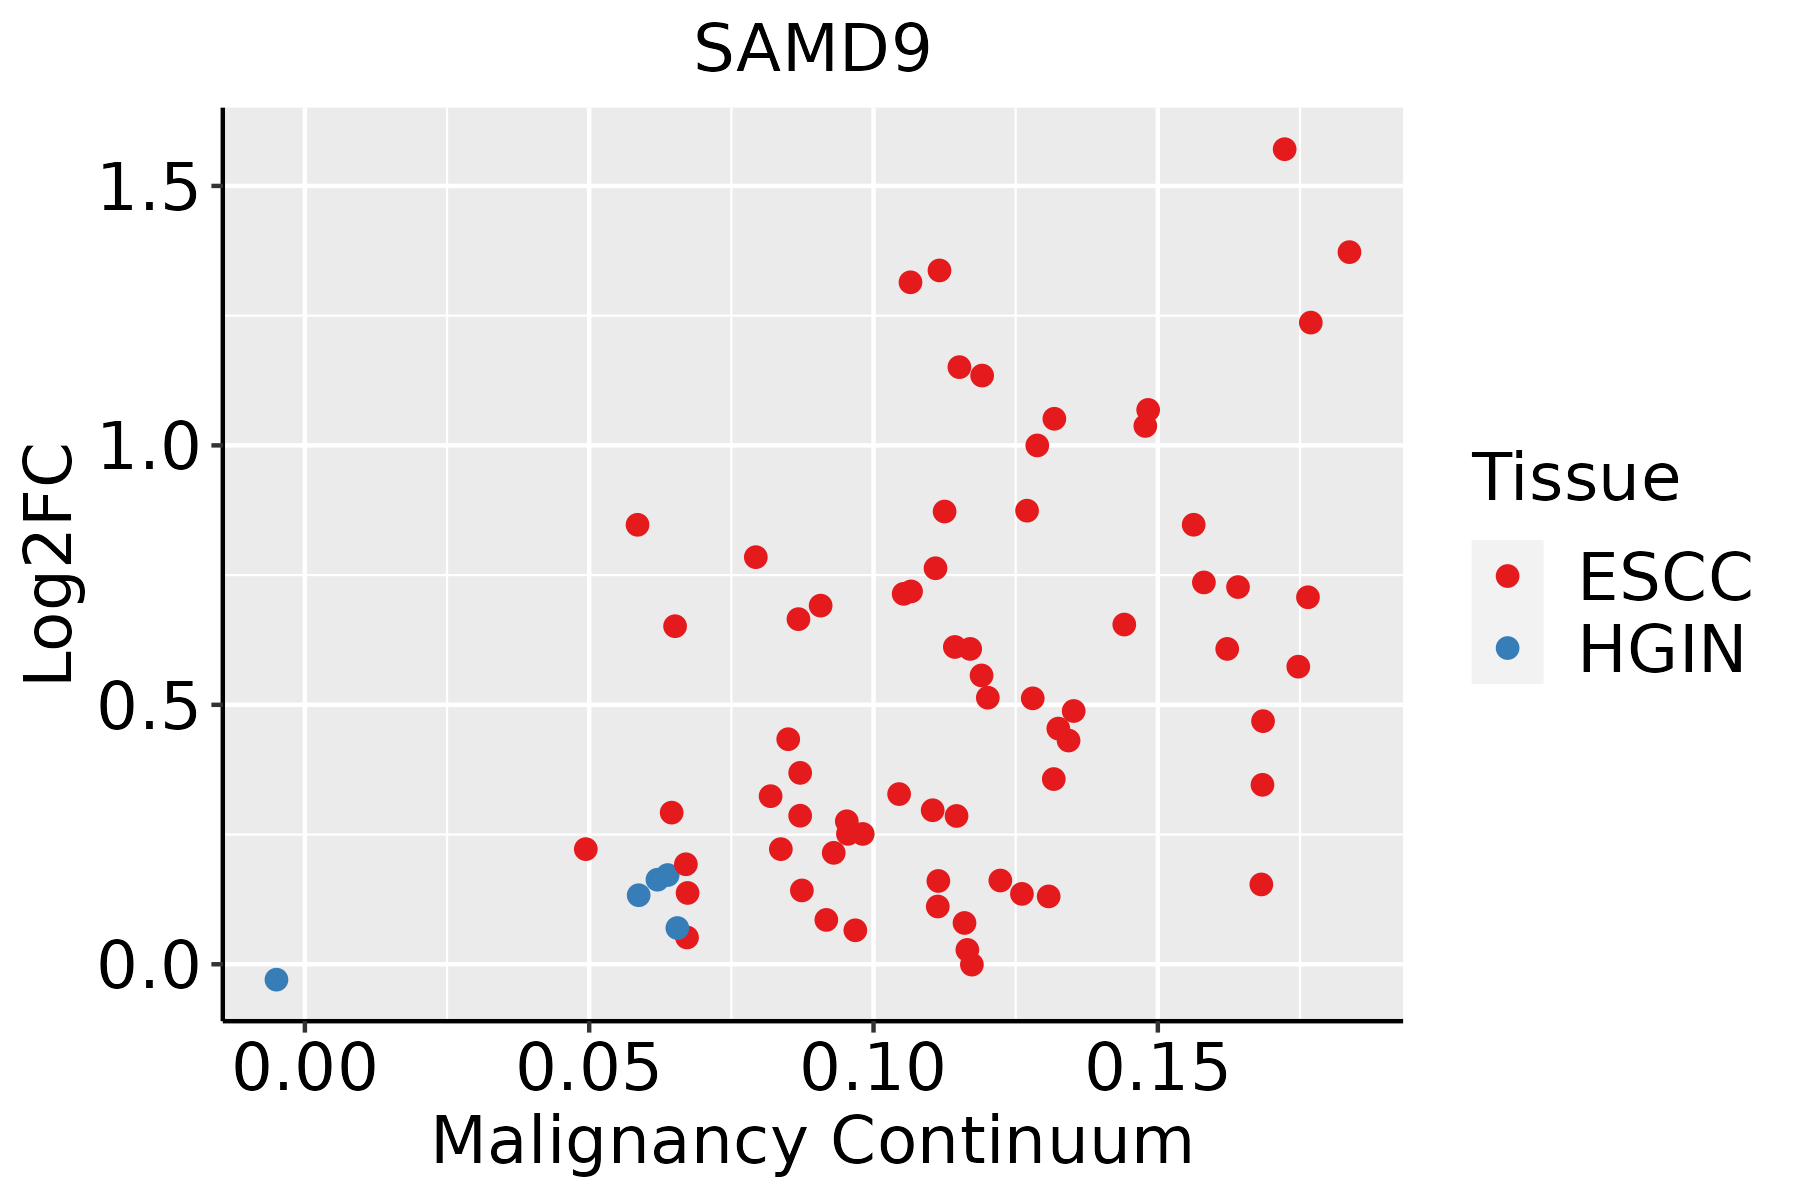 | ESCC: Esophageal squamous cell carcinoma |
| HGIN: High-grade intraepithelial neoplasias | ||
| LGIN: Low-grade intraepithelial neoplasias | ||
| Liver |  | HCC: Hepatocellular carcinoma |
| NAFLD: Non-alcoholic fatty liver disease | ||
| Oral Cavity |  | EOLP: Erosive Oral lichen planus |
| LP: leukoplakia | ||
| NEOLP: Non-erosive oral lichen planus | ||
| OSCC: Oral squamous cell carcinoma | ||
| Skin | 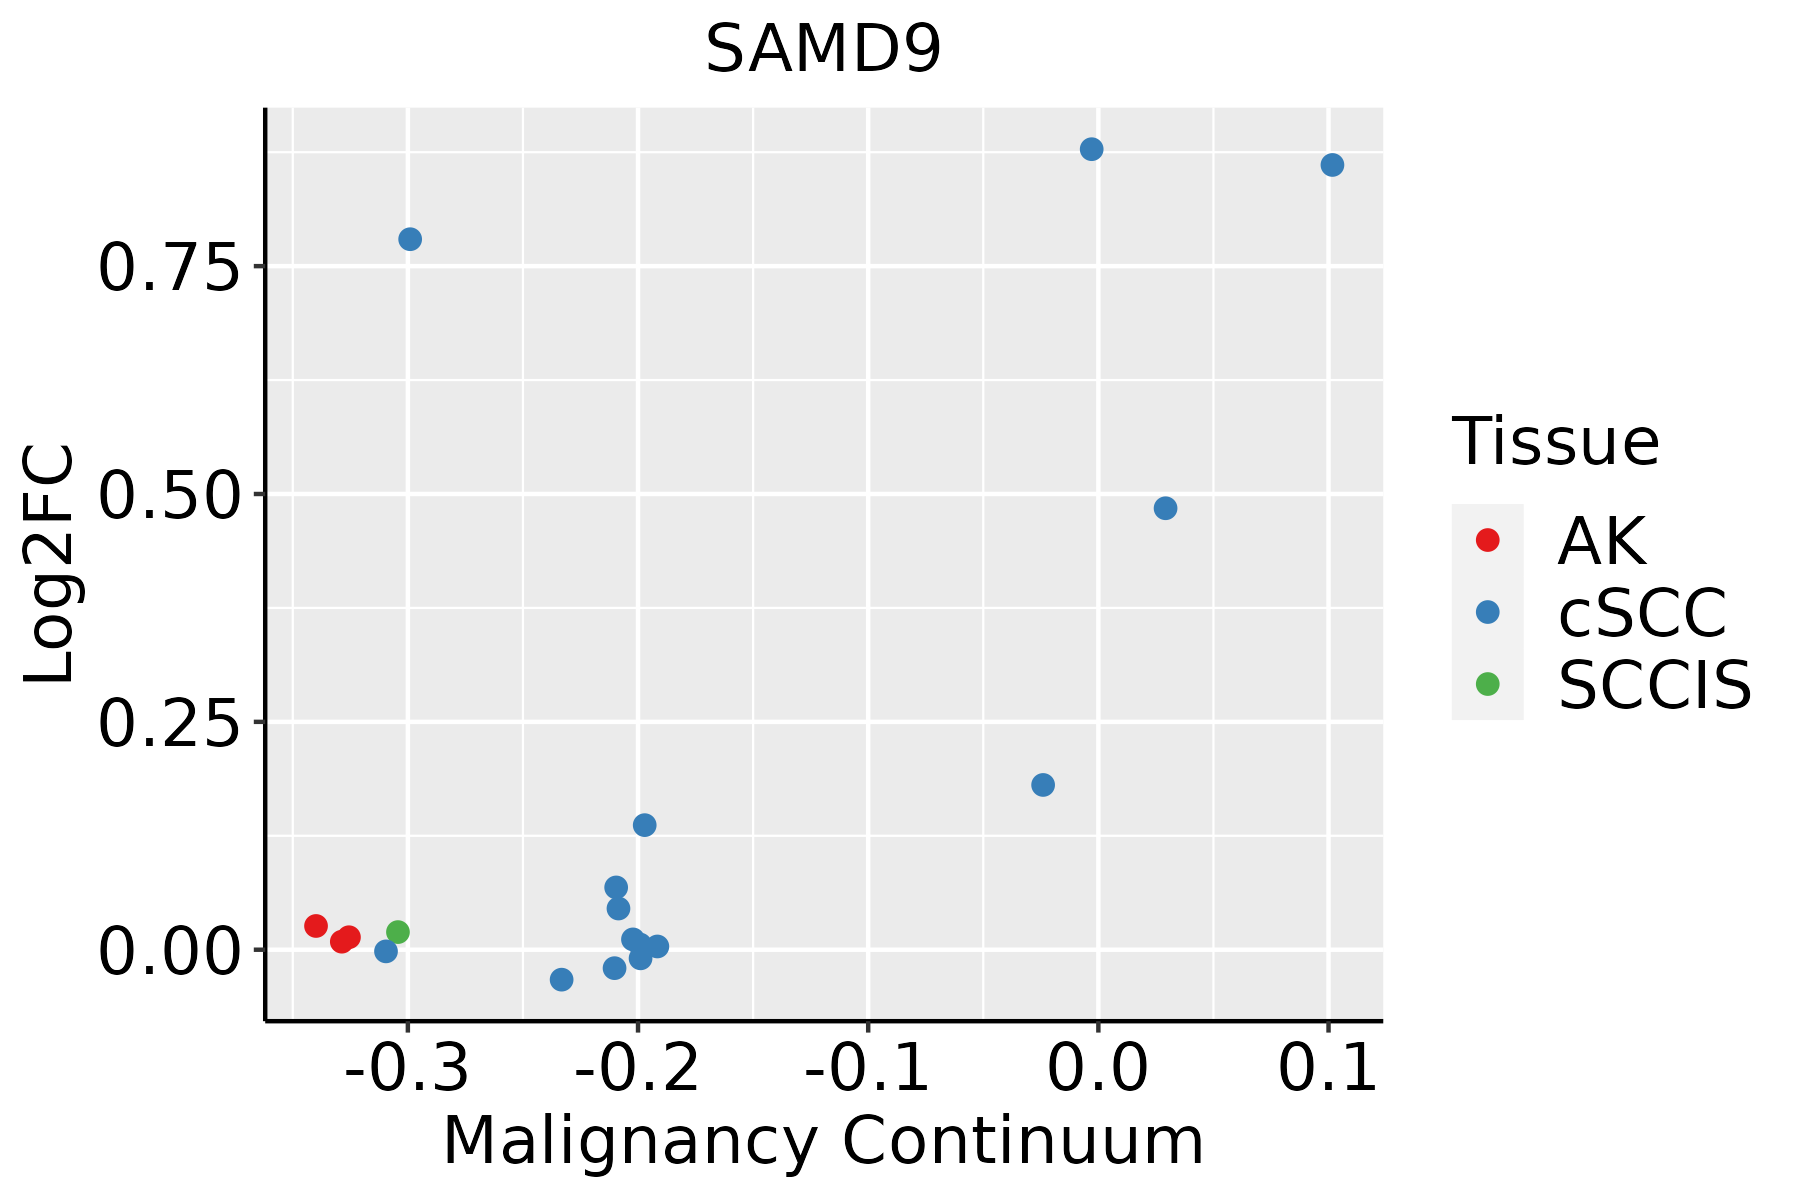 | AK: Actinic keratosis |
| cSCC: Cutaneous squamous cell carcinoma | ||
| SCCIS:squamous cell carcinoma in situ | ||
| Thyroid | 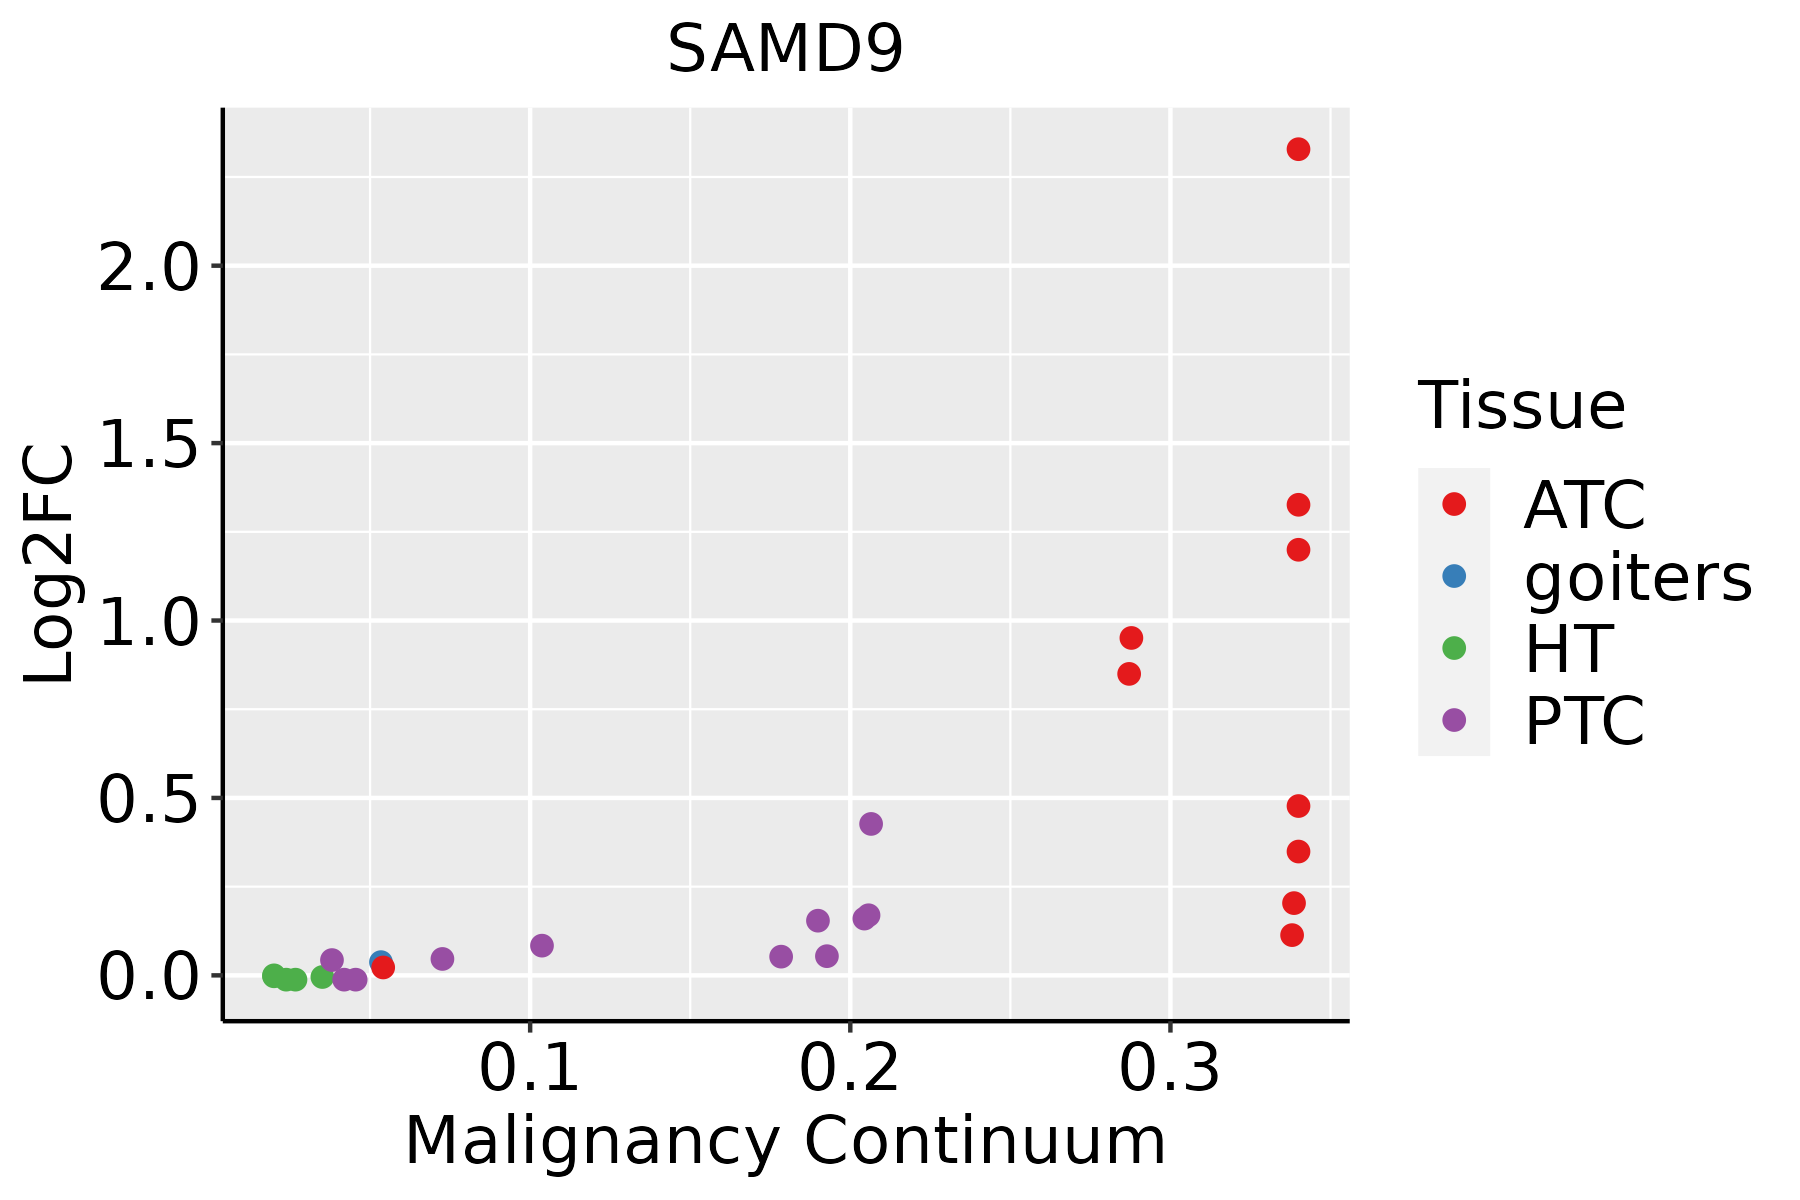 | ATC: Anaplastic thyroid cancer |
| HT: Hashimoto's thyroiditis | ||
| PTC: Papillary thyroid cancer |
| ∗log2FC in expression of this searched gene in stem-like cells from each diseased tissue sample relative to stem-like cells in normal samples in each tissue plotted against the malignancy continuum. Samples are colored based on if they are from different disease stage. |
Top |
Malignant transformation related pathway analysis |
| Find out the enriched GO biological processes and KEGG pathways involved in transition from healthy to precancer to cancer |
| Tissue | Disease Stage | Enriched GO biological Processes |
| Colorectum | AD |  |
| Colorectum | SER |  |
| Colorectum | MSS |  |
| Colorectum | MSI-H |  |
| Colorectum | FAP |  |
| ∗Top 15 enriched GO BP terms are showed in the bar plot of each disease state in each tissue. Each row represents a significant GO biological process which is colored according to the -log10(p.adjust). |
| Page: 1 2 3 4 5 6 7 8 9 |
| GO ID | Tissue | Disease Stage | Description | Gene Ratio | Bg Ratio | pvalue | p.adjust | Count |
| GO:001605014 | Esophagus | ESCC | vesicle organization | 211/8552 | 300/18723 | 2.85e-18 | 2.87e-16 | 211 |
| GO:00482844 | Esophagus | ESCC | organelle fusion | 94/8552 | 141/18723 | 3.72e-07 | 5.16e-06 | 94 |
| GO:00901743 | Esophagus | ESCC | organelle membrane fusion | 73/8552 | 110/18723 | 9.29e-06 | 8.88e-05 | 73 |
| GO:00069063 | Esophagus | ESCC | vesicle fusion | 70/8552 | 106/18723 | 1.82e-05 | 1.60e-04 | 70 |
| GO:00610254 | Esophagus | ESCC | membrane fusion | 98/8552 | 163/18723 | 1.39e-04 | 9.41e-04 | 98 |
| GO:001605021 | Liver | HCC | vesicle organization | 194/7958 | 300/18723 | 5.58e-15 | 3.97e-13 | 194 |
| GO:004828411 | Liver | HCC | organelle fusion | 84/7958 | 141/18723 | 3.13e-05 | 3.20e-04 | 84 |
| GO:00901741 | Liver | HCC | organelle membrane fusion | 63/7958 | 110/18723 | 1.24e-03 | 6.85e-03 | 63 |
| GO:00069061 | Liver | HCC | vesicle fusion | 61/7958 | 106/18723 | 1.25e-03 | 6.90e-03 | 61 |
| GO:0061025 | Liver | HCC | membrane fusion | 88/7958 | 163/18723 | 1.98e-03 | 1.00e-02 | 88 |
| GO:00160508 | Oral cavity | OSCC | vesicle organization | 189/7305 | 300/18723 | 2.40e-17 | 2.14e-15 | 189 |
| GO:00482843 | Oral cavity | OSCC | organelle fusion | 82/7305 | 141/18723 | 3.08e-06 | 3.72e-05 | 82 |
| GO:00901742 | Oral cavity | OSCC | organelle membrane fusion | 63/7305 | 110/18723 | 7.75e-05 | 6.01e-04 | 63 |
| GO:00069062 | Oral cavity | OSCC | vesicle fusion | 61/7305 | 106/18723 | 8.28e-05 | 6.35e-04 | 61 |
| GO:00610253 | Oral cavity | OSCC | membrane fusion | 84/7305 | 163/18723 | 7.56e-04 | 4.12e-03 | 84 |
| GO:001605015 | Skin | cSCC | vesicle organization | 135/4864 | 300/18723 | 5.98e-13 | 3.44e-11 | 135 |
| GO:00482845 | Skin | cSCC | organelle fusion | 60/4864 | 141/18723 | 1.32e-05 | 1.67e-04 | 60 |
| GO:00610255 | Skin | cSCC | membrane fusion | 63/4864 | 163/18723 | 2.49e-04 | 2.03e-03 | 63 |
| GO:00069064 | Skin | cSCC | vesicle fusion | 43/4864 | 106/18723 | 7.14e-04 | 5.03e-03 | 43 |
| GO:00901744 | Skin | cSCC | organelle membrane fusion | 44/4864 | 110/18723 | 8.82e-04 | 6.07e-03 | 44 |
| Page: 1 2 |
| Pathway ID | Tissue | Disease Stage | Description | Gene Ratio | Bg Ratio | pvalue | p.adjust | qvalue | Count |
| Page: 1 |
Top |
Cell-cell communication analysis |
| Identification of potential cell-cell interactions between two cell types and their ligand-receptor pairs for different disease states |
| Ligand | Receptor | LRpair | Pathway | Tissue | Disease Stage |
| Page: 1 |
Top |
Single-cell gene regulatory network inference analysis |
| Find out the significant the regulons (TFs) and the target genes of each regulon across cell types for different disease states |
| TF | Cell Type | Tissue | Disease Stage | Target Gene | RSS | Regulon Activity |
| ∗The dot plots of a searched regulon are shown for all cell subpopulations in each disease state of each tissue based on the regulon specific score inferred using pySCENIC and by calculating the average expression. |
| Page: 1 |
Top |
Somatic mutation of malignant transformation related genes |
| Annotation of somatic variants for genes involved in malignant transformation |
| Hugo Symbol | Variant Class | Variant Classification | dbSNP RS | HGVSc | HGVSp | HGVSp Short | SWISSPROT | BIOTYPE | SIFT | PolyPhen | Tumor Sample Barcode | Tissue | Histology | Sex | Age | Stage | Therapy Types | Drugs | Outcome |
| SAMD9 | SNV | Missense_Mutation | novel | c.1919N>C | p.Val640Ala | p.V640A | Q5K651 | protein_coding | deleterious(0) | possibly_damaging(0.714) | TCGA-AP-A1DV-01 | Endometrium | uterine corpus endometrioid carcinoma | Female | <65 | I/II | Unknown | Unknown | SD |
| SAMD9 | SNV | Missense_Mutation | novel | c.776N>T | p.Ala259Val | p.A259V | Q5K651 | protein_coding | tolerated(0.15) | benign(0.007) | TCGA-AP-A1DV-01 | Endometrium | uterine corpus endometrioid carcinoma | Female | <65 | I/II | Unknown | Unknown | SD |
| SAMD9 | SNV | Missense_Mutation | rs762323380 | c.4585N>T | p.Arg1529Cys | p.R1529C | Q5K651 | protein_coding | deleterious(0) | probably_damaging(0.94) | TCGA-AP-A1E0-01 | Endometrium | uterine corpus endometrioid carcinoma | Female | <65 | III/IV | Chemotherapy | paclitaxel | SD |
| SAMD9 | SNV | Missense_Mutation | novel | c.2812N>C | p.Cys938Arg | p.C938R | Q5K651 | protein_coding | deleterious(0) | probably_damaging(0.997) | TCGA-AP-A1E0-01 | Endometrium | uterine corpus endometrioid carcinoma | Female | <65 | III/IV | Chemotherapy | paclitaxel | SD |
| SAMD9 | SNV | Missense_Mutation | c.3788C>A | p.Ser1263Tyr | p.S1263Y | Q5K651 | protein_coding | deleterious(0.03) | benign(0.326) | TCGA-AX-A05Z-01 | Endometrium | uterine corpus endometrioid carcinoma | Female | <65 | III/IV | Chemotherapy | adriamycin | SD | |
| SAMD9 | SNV | Missense_Mutation | c.3051C>A | p.Phe1017Leu | p.F1017L | Q5K651 | protein_coding | tolerated(0.24) | benign(0.057) | TCGA-AX-A05Z-01 | Endometrium | uterine corpus endometrioid carcinoma | Female | <65 | III/IV | Chemotherapy | adriamycin | SD | |
| SAMD9 | SNV | Missense_Mutation | c.617N>T | p.Ala206Val | p.A206V | Q5K651 | protein_coding | deleterious(0.02) | benign(0.094) | TCGA-AX-A0J1-01 | Endometrium | uterine corpus endometrioid carcinoma | Female | >=65 | I/II | Unknown | Unknown | SD | |
| SAMD9 | SNV | Missense_Mutation | rs199922969 | c.2645N>G | p.Phe882Cys | p.F882C | Q5K651 | protein_coding | deleterious(0) | probably_damaging(0.968) | TCGA-AX-A1CE-01 | Endometrium | uterine corpus endometrioid carcinoma | Female | <65 | I/II | Unspecific | Paclitaxel | SD |
| SAMD9 | SNV | Missense_Mutation | rs753744139 | c.3055G>A | p.Asp1019Asn | p.D1019N | Q5K651 | protein_coding | tolerated(0.15) | benign(0.166) | TCGA-AX-A2HC-01 | Endometrium | uterine corpus endometrioid carcinoma | Female | <65 | III/IV | Chemotherapy | paclitaxel | PD |
| SAMD9 | SNV | Missense_Mutation | novel | c.2093C>A | p.Ser698Tyr | p.S698Y | Q5K651 | protein_coding | deleterious(0.03) | possibly_damaging(0.88) | TCGA-AX-A2HC-01 | Endometrium | uterine corpus endometrioid carcinoma | Female | <65 | III/IV | Chemotherapy | paclitaxel | PD |
| Page: 1 2 3 4 5 6 7 8 9 10 11 12 13 14 15 16 17 18 19 20 21 22 23 24 25 26 |
Top |
Related drugs of malignant transformation related genes |
| Identification of chemicals and drugs interact with genes involved in malignant transfromation |
| (DGIdb 4.0) |
| Entrez ID | Symbol | Category | Interaction Types | Drug Claim Name | Drug Name | PMIDs |
| Page: 1 |

Copyright 2023-Present -The University of Texas Health Science Center at Houston |