
|
|||||
|
 | |
| |
| |
| |
| |
| |
|
Gene: MASP1 |
Gene summary for MASP1 |
| Gene information | Species | Human | Gene symbol | MASP1 | Gene ID | 5648 |
| Gene name | MBL associated serine protease 1 | |
| Gene Alias | 3MC1 | |
| Cytomap | 3q27.3 | |
| Gene Type | protein-coding | GO ID | GO:0001867 | UniProtAcc | P48740 |
Top |
Malignant transformation analysis |
| Identification of the aberrant gene expression in precancerous and cancerous lesions by comparing the gene expression of stem-like cells in diseased tissues with normal stem cells |
| Entrez ID | Symbol | Replicates | Species | Organ | Tissue | Adj P-value | Log2FC | Malignancy |
| 5648 | MASP1 | NAFLD1 | Human | Liver | NAFLD | 8.81e-05 | 6.21e-01 | -0.04 |
| 5648 | MASP1 | S41 | Human | Liver | Cirrhotic | 4.33e-06 | 7.06e-01 | -0.0343 |
| 5648 | MASP1 | S43 | Human | Liver | Cirrhotic | 4.65e-07 | -1.51e-01 | -0.0187 |
| 5648 | MASP1 | HCC1_Meng | Human | Liver | HCC | 3.66e-76 | 1.84e-01 | 0.0246 |
| 5648 | MASP1 | HCC2_Meng | Human | Liver | HCC | 4.90e-08 | -3.00e-01 | 0.0107 |
| 5648 | MASP1 | cirrhotic2 | Human | Liver | Cirrhotic | 1.89e-02 | -1.09e-01 | 0.0201 |
| 5648 | MASP1 | HCC2 | Human | Liver | HCC | 4.17e-10 | 3.42e+00 | 0.5341 |
| 5648 | MASP1 | HCC5 | Human | Liver | HCC | 1.91e-04 | 6.64e-01 | 0.4932 |
| 5648 | MASP1 | Pt13.a | Human | Liver | HCC | 4.45e-08 | -2.84e-01 | 0.021 |
| 5648 | MASP1 | S014 | Human | Liver | HCC | 4.76e-05 | -3.20e-01 | 0.2254 |
| 5648 | MASP1 | S016 | Human | Liver | HCC | 7.86e-04 | -3.08e-01 | 0.2243 |
| 5648 | MASP1 | S028 | Human | Liver | HCC | 2.57e-02 | 3.43e-01 | 0.2503 |
| 5648 | MASP1 | S029 | Human | Liver | HCC | 1.20e-05 | 4.86e-01 | 0.2581 |
| Page: 1 |
| Tissue | Expression Dynamics | Abbreviation |
| Liver | 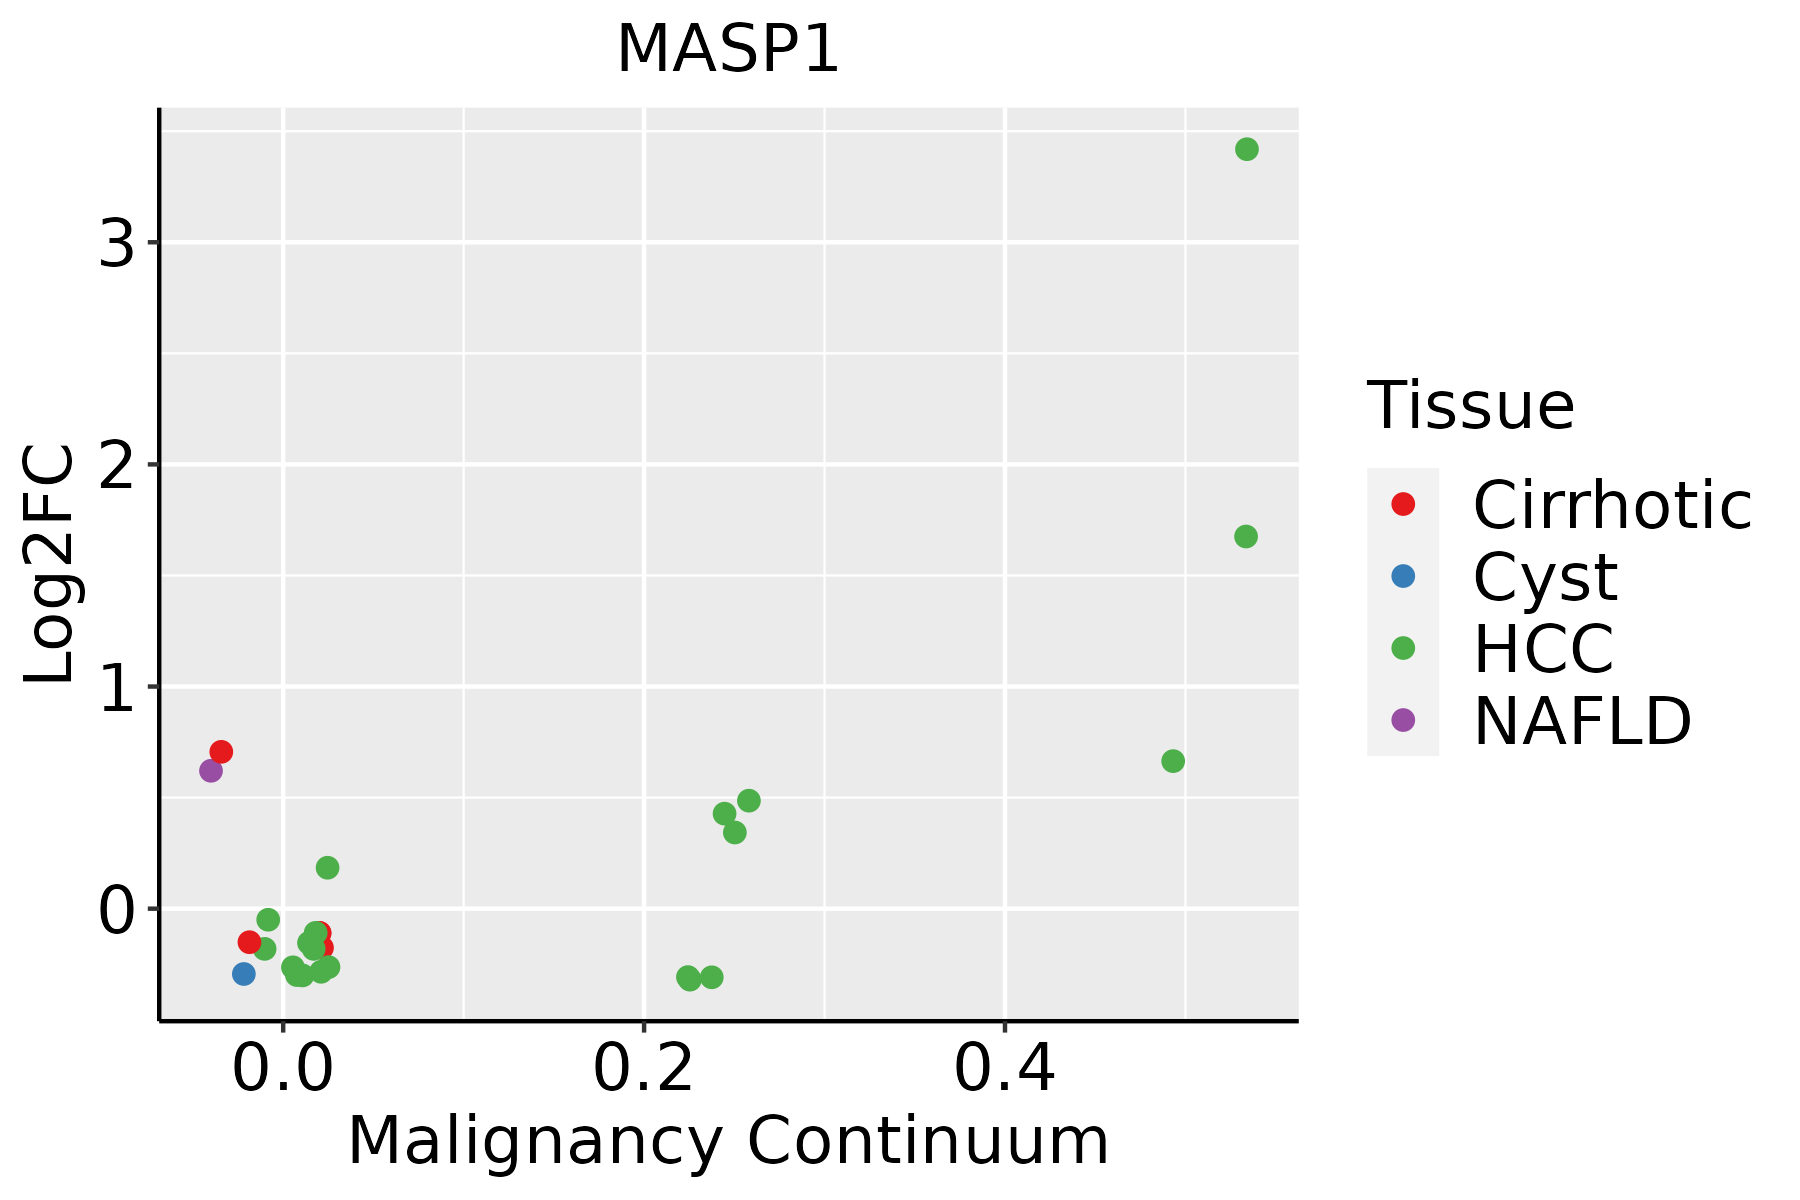 | HCC: Hepatocellular carcinoma |
| NAFLD: Non-alcoholic fatty liver disease |
| ∗log2FC in expression of this searched gene in stem-like cells from each diseased tissue sample relative to stem-like cells in normal samples in each tissue plotted against the malignancy continuum. Samples are colored based on if they are from different disease stage. |
Top |
Malignant transformation related pathway analysis |
| Find out the enriched GO biological processes and KEGG pathways involved in transition from healthy to precancer to cancer |
| Tissue | Disease Stage | Enriched GO biological Processes |
| Colorectum | AD |  |
| Colorectum | SER |  |
| Colorectum | MSS |  |
| Colorectum | MSI-H |  |
| Colorectum | FAP |  |
| ∗Top 15 enriched GO BP terms are showed in the bar plot of each disease state in each tissue. Each row represents a significant GO biological process which is colored according to the -log10(p.adjust). |
| Page: 1 2 3 4 5 6 7 8 9 |
| GO ID | Tissue | Disease Stage | Description | Gene Ratio | Bg Ratio | pvalue | p.adjust | Count |
| Page: 1 |
| Pathway ID | Tissue | Disease Stage | Description | Gene Ratio | Bg Ratio | pvalue | p.adjust | qvalue | Count |
| hsa0517114 | Liver | NAFLD | Coronavirus disease - COVID-19 | 111/1043 | 232/8465 | 1.01e-41 | 3.32e-39 | 2.67e-39 | 111 |
| hsa04610 | Liver | NAFLD | Complement and coagulation cascades | 35/1043 | 86/8465 | 2.48e-11 | 2.04e-09 | 1.64e-09 | 35 |
| hsa0517115 | Liver | NAFLD | Coronavirus disease - COVID-19 | 111/1043 | 232/8465 | 1.01e-41 | 3.32e-39 | 2.67e-39 | 111 |
| hsa046101 | Liver | NAFLD | Complement and coagulation cascades | 35/1043 | 86/8465 | 2.48e-11 | 2.04e-09 | 1.64e-09 | 35 |
| hsa0517122 | Liver | Cirrhotic | Coronavirus disease - COVID-19 | 136/2530 | 232/8465 | 3.28e-20 | 1.82e-18 | 1.12e-18 | 136 |
| hsa046102 | Liver | Cirrhotic | Complement and coagulation cascades | 48/2530 | 86/8465 | 4.41e-07 | 5.44e-06 | 3.35e-06 | 48 |
| hsa0517132 | Liver | Cirrhotic | Coronavirus disease - COVID-19 | 136/2530 | 232/8465 | 3.28e-20 | 1.82e-18 | 1.12e-18 | 136 |
| hsa046103 | Liver | Cirrhotic | Complement and coagulation cascades | 48/2530 | 86/8465 | 4.41e-07 | 5.44e-06 | 3.35e-06 | 48 |
| hsa0517142 | Liver | HCC | Coronavirus disease - COVID-19 | 167/4020 | 232/8465 | 1.50e-14 | 4.19e-13 | 2.33e-13 | 167 |
| hsa046104 | Liver | HCC | Complement and coagulation cascades | 57/4020 | 86/8465 | 3.19e-04 | 1.45e-03 | 8.04e-04 | 57 |
| hsa0517152 | Liver | HCC | Coronavirus disease - COVID-19 | 167/4020 | 232/8465 | 1.50e-14 | 4.19e-13 | 2.33e-13 | 167 |
| hsa046105 | Liver | HCC | Complement and coagulation cascades | 57/4020 | 86/8465 | 3.19e-04 | 1.45e-03 | 8.04e-04 | 57 |
| Page: 1 |
Top |
Cell-cell communication analysis |
| Identification of potential cell-cell interactions between two cell types and their ligand-receptor pairs for different disease states |
| Ligand | Receptor | LRpair | Pathway | Tissue | Disease Stage |
| Page: 1 |
Top |
Single-cell gene regulatory network inference analysis |
| Find out the significant the regulons (TFs) and the target genes of each regulon across cell types for different disease states |
| TF | Cell Type | Tissue | Disease Stage | Target Gene | RSS | Regulon Activity |
| ∗The dot plots of a searched regulon are shown for all cell subpopulations in each disease state of each tissue based on the regulon specific score inferred using pySCENIC and by calculating the average expression. |
| Page: 1 |
Top |
Somatic mutation of malignant transformation related genes |
| Annotation of somatic variants for genes involved in malignant transformation |
| Hugo Symbol | Variant Class | Variant Classification | dbSNP RS | HGVSc | HGVSp | HGVSp Short | SWISSPROT | BIOTYPE | SIFT | PolyPhen | Tumor Sample Barcode | Tissue | Histology | Sex | Age | Stage | Therapy Types | Drugs | Outcome |
| MASP1 | SNV | Missense_Mutation | c.1483N>C | p.Ala495Pro | p.A495P | P48740 | protein_coding | deleterious(0) | probably_damaging(1) | TCGA-55-8094-01 | Lung | lung adenocarcinoma | Male | <65 | III/IV | Unknown | Unknown | SD | |
| MASP1 | SNV | Missense_Mutation | c.898G>A | p.Glu300Lys | p.E300K | P48740 | protein_coding | tolerated(0.19) | benign(0.006) | TCGA-69-7980-01 | Lung | lung adenocarcinoma | Female | >=65 | I/II | Unknown | Unknown | SD | |
| MASP1 | SNV | Missense_Mutation | c.940N>T | p.Pro314Ser | p.P314S | P48740 | protein_coding | deleterious(0.02) | probably_damaging(1) | TCGA-86-A4JF-01 | Lung | lung adenocarcinoma | Male | <65 | I/II | Chemotherapy | unknown | PD | |
| MASP1 | SNV | Missense_Mutation | c.2002N>C | p.Trp668Arg | p.W668R | P48740 | protein_coding | deleterious(0) | probably_damaging(1) | TCGA-91-6848-01 | Lung | lung adenocarcinoma | Male | <65 | III/IV | Chemotherapy | cisplatin | CR | |
| MASP1 | SNV | Missense_Mutation | c.1623N>A | p.His541Gln | p.H541Q | P48740 | protein_coding | deleterious(0) | probably_damaging(0.995) | TCGA-97-7554-01 | Lung | lung adenocarcinoma | Female | >=65 | III/IV | Chemotherapy | alimta | SD | |
| MASP1 | SNV | Missense_Mutation | novel | c.963C>G | p.Phe321Leu | p.F321L | P48740 | protein_coding | tolerated(0.4) | benign(0.078) | TCGA-MN-A4N1-01 | Lung | lung adenocarcinoma | Male | <65 | I/II | Unknown | Unknown | SD |
| MASP1 | SNV | Missense_Mutation | novel | c.578G>T | p.Arg193Met | p.R193M | P48740 | protein_coding | deleterious(0) | probably_damaging(0.969) | TCGA-21-1079-01 | Lung | lung squamous cell carcinoma | Male | >=65 | III/IV | Unknown | Unknown | PD |
| MASP1 | SNV | Missense_Mutation | novel | c.1465N>C | p.Ala489Pro | p.A489P | P48740 | protein_coding | deleterious(0) | probably_damaging(1) | TCGA-21-1080-01 | Lung | lung squamous cell carcinoma | Male | >=65 | I/II | Unknown | Unknown | SD |
| MASP1 | SNV | Missense_Mutation | rs768987275 | c.1788N>T | p.Arg596Ser | p.R596S | P48740 | protein_coding | tolerated(0.68) | benign(0.013) | TCGA-21-5782-01 | Lung | lung squamous cell carcinoma | Female | >=65 | I/II | Unknown | Unknown | SD |
| MASP1 | SNV | Missense_Mutation | novel | c.1466C>A | p.Ala489Glu | p.A489E | P48740 | protein_coding | tolerated(0.75) | benign(0) | TCGA-22-4604-01 | Lung | lung squamous cell carcinoma | Male | >=65 | I/II | Targeted Molecular therapy | iressa | PD |
| Page: 1 2 3 4 5 6 7 8 9 10 11 12 13 14 15 16 |
Top |
Related drugs of malignant transformation related genes |
| Identification of chemicals and drugs interact with genes involved in malignant transfromation |
| (DGIdb 4.0) |
| Entrez ID | Symbol | Category | Interaction Types | Drug Claim Name | Drug Name | PMIDs |
| Page: 1 |

Copyright 2023-Present -The University of Texas Health Science Center at Houston |