
|
|||||
|
 | |
| |
| |
| |
| |
| |
|
Gene: GFPT2 |
Gene summary for GFPT2 |
| Gene information | Species | Human | Gene symbol | GFPT2 | Gene ID | 9945 |
| Gene name | glutamine-fructose-6-phosphate transaminase 2 | |
| Gene Alias | GFAT | |
| Cytomap | 5q35.3 | |
| Gene Type | protein-coding | GO ID | GO:0006002 | UniProtAcc | A0A0S2Z4X9 |
Top |
Malignant transformation analysis |
| Identification of the aberrant gene expression in precancerous and cancerous lesions by comparing the gene expression of stem-like cells in diseased tissues with normal stem cells |
| Entrez ID | Symbol | Replicates | Species | Organ | Tissue | Adj P-value | Log2FC | Malignancy |
| 9945 | GFPT2 | P5T-E | Human | Esophagus | ESCC | 6.26e-18 | 3.65e-01 | 0.1327 |
| 9945 | GFPT2 | P11T-E | Human | Esophagus | ESCC | 1.21e-05 | 2.17e-01 | 0.1426 |
| 9945 | GFPT2 | P22T-E | Human | Esophagus | ESCC | 4.54e-02 | 3.08e-02 | 0.1236 |
| 9945 | GFPT2 | P24T-E | Human | Esophagus | ESCC | 2.84e-04 | 2.10e-01 | 0.1287 |
| 9945 | GFPT2 | P28T-E | Human | Esophagus | ESCC | 8.30e-06 | 1.23e-01 | 0.1149 |
| 9945 | GFPT2 | P31T-E | Human | Esophagus | ESCC | 1.46e-07 | 8.83e-02 | 0.1251 |
| 9945 | GFPT2 | P32T-E | Human | Esophagus | ESCC | 6.75e-05 | 1.70e-01 | 0.1666 |
| 9945 | GFPT2 | P37T-E | Human | Esophagus | ESCC | 3.57e-07 | 1.11e-01 | 0.1371 |
| 9945 | GFPT2 | P42T-E | Human | Esophagus | ESCC | 2.08e-04 | 1.31e-01 | 0.1175 |
| 9945 | GFPT2 | P44T-E | Human | Esophagus | ESCC | 7.13e-04 | 2.80e-01 | 0.1096 |
| 9945 | GFPT2 | P52T-E | Human | Esophagus | ESCC | 5.65e-17 | 5.11e-01 | 0.1555 |
| 9945 | GFPT2 | P54T-E | Human | Esophagus | ESCC | 3.45e-05 | 6.70e-02 | 0.0975 |
| 9945 | GFPT2 | P61T-E | Human | Esophagus | ESCC | 3.73e-05 | 2.07e-01 | 0.099 |
| 9945 | GFPT2 | P62T-E | Human | Esophagus | ESCC | 4.65e-02 | 1.06e-01 | 0.1302 |
| 9945 | GFPT2 | P74T-E | Human | Esophagus | ESCC | 2.28e-06 | 6.64e-02 | 0.1479 |
| 9945 | GFPT2 | P76T-E | Human | Esophagus | ESCC | 1.89e-02 | 5.08e-02 | 0.1207 |
| 9945 | GFPT2 | P80T-E | Human | Esophagus | ESCC | 3.04e-04 | 4.97e-01 | 0.155 |
| 9945 | GFPT2 | P83T-E | Human | Esophagus | ESCC | 3.14e-04 | 1.89e-01 | 0.1738 |
| 9945 | GFPT2 | P89T-E | Human | Esophagus | ESCC | 4.44e-02 | 4.40e-01 | 0.1752 |
| 9945 | GFPT2 | P107T-E | Human | Esophagus | ESCC | 2.31e-02 | 7.70e-02 | 0.171 |
| Page: 1 2 |
| Tissue | Expression Dynamics | Abbreviation |
| Esophagus |  | ESCC: Esophageal squamous cell carcinoma |
| HGIN: High-grade intraepithelial neoplasias | ||
| LGIN: Low-grade intraepithelial neoplasias | ||
| Thyroid | 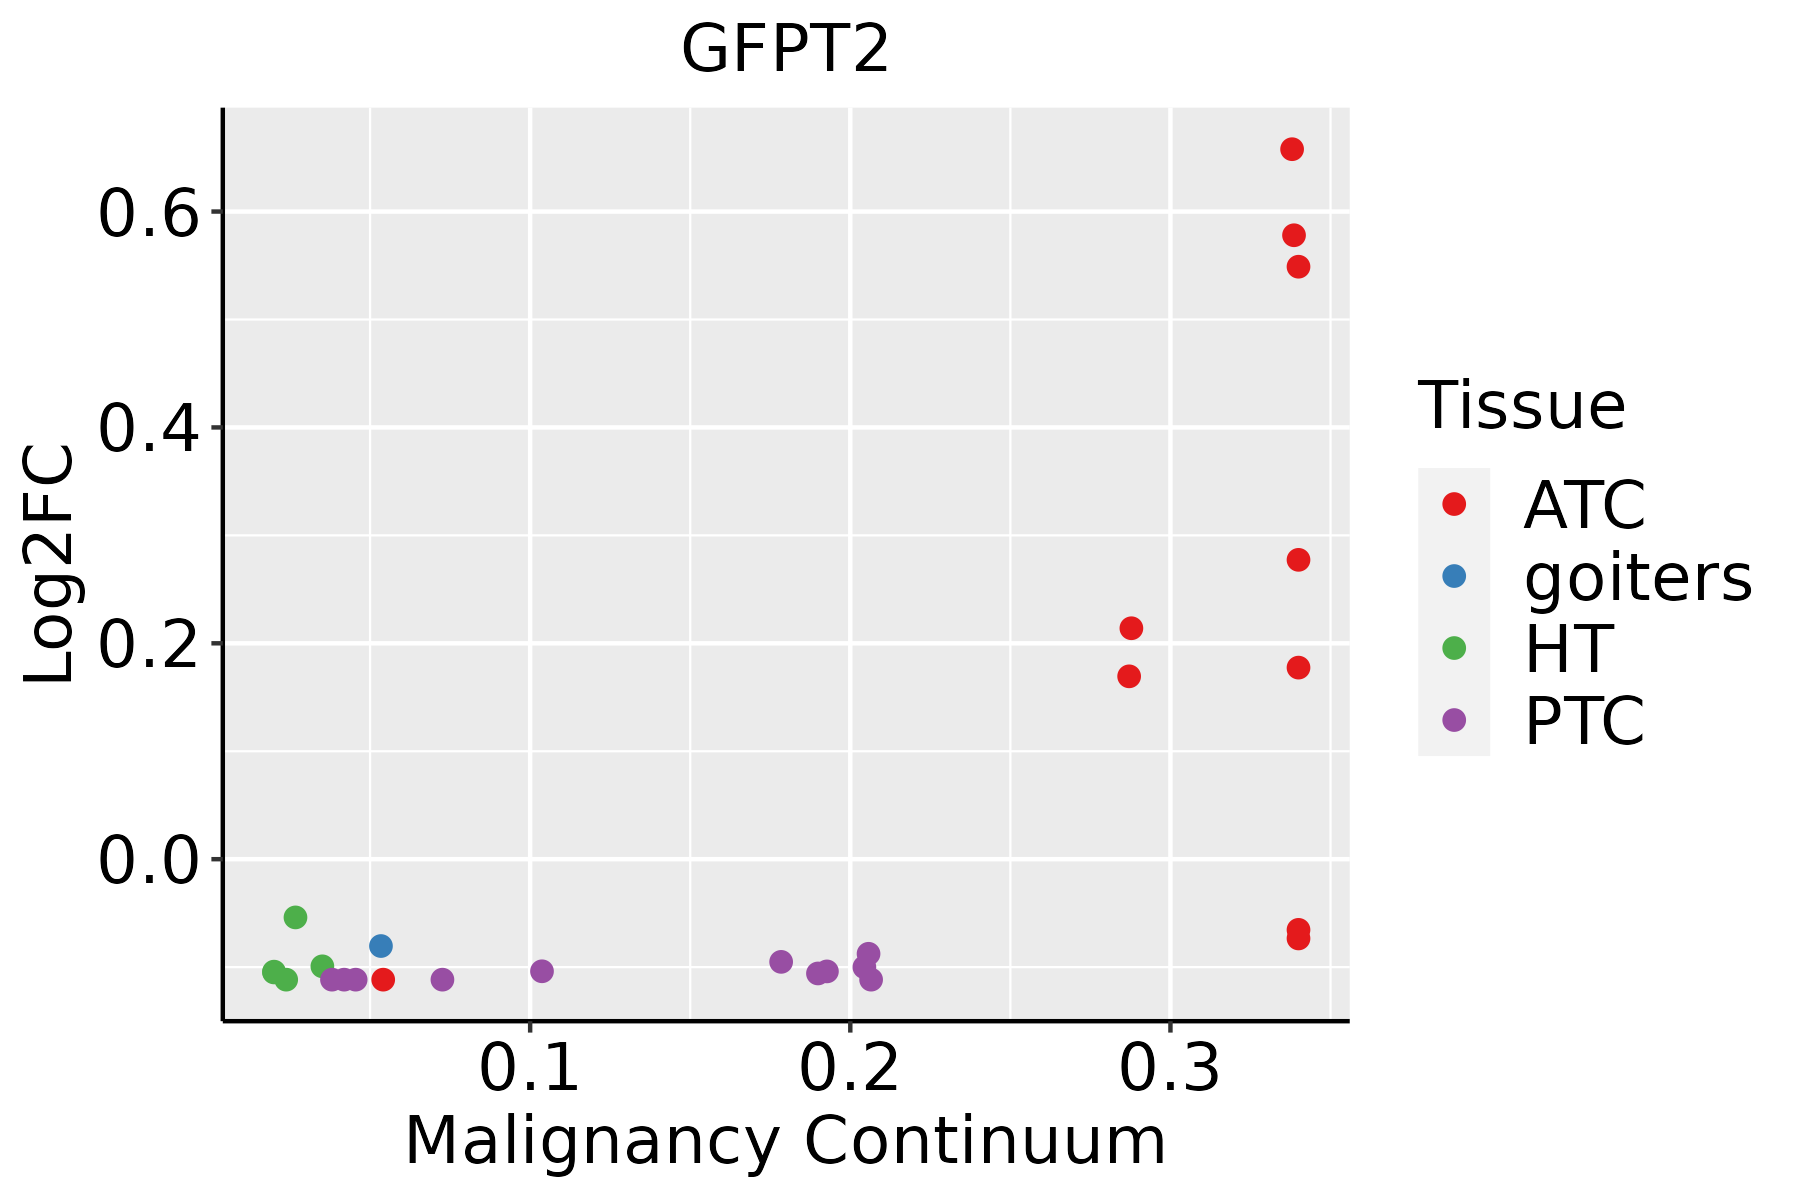 | ATC: Anaplastic thyroid cancer |
| HT: Hashimoto's thyroiditis | ||
| PTC: Papillary thyroid cancer |
| ∗log2FC in expression of this searched gene in stem-like cells from each diseased tissue sample relative to stem-like cells in normal samples in each tissue plotted against the malignancy continuum. Samples are colored based on if they are from different disease stage. |
Top |
Malignant transformation related pathway analysis |
| Find out the enriched GO biological processes and KEGG pathways involved in transition from healthy to precancer to cancer |
| Tissue | Disease Stage | Enriched GO biological Processes |
| Colorectum | AD |  |
| Colorectum | SER |  |
| Colorectum | MSS |  |
| Colorectum | MSI-H |  |
| Colorectum | FAP |  |
| ∗Top 15 enriched GO BP terms are showed in the bar plot of each disease state in each tissue. Each row represents a significant GO biological process which is colored according to the -log10(p.adjust). |
| Page: 1 2 3 4 5 6 7 8 9 |
| GO ID | Tissue | Disease Stage | Description | Gene Ratio | Bg Ratio | pvalue | p.adjust | Count |
| GO:0006091110 | Esophagus | ESCC | generation of precursor metabolites and energy | 331/8552 | 490/18723 | 3.86e-23 | 8.45e-21 | 331 |
| GO:0015980110 | Esophagus | ESCC | energy derivation by oxidation of organic compounds | 220/8552 | 318/18723 | 1.20e-17 | 1.09e-15 | 220 |
| GO:000648714 | Esophagus | ESCC | protein N-linked glycosylation | 51/8552 | 65/18723 | 6.41e-08 | 1.13e-06 | 51 |
| GO:00091002 | Esophagus | ESCC | glycoprotein metabolic process | 226/8552 | 387/18723 | 2.64e-07 | 3.94e-06 | 226 |
| GO:00700854 | Esophagus | ESCC | glycosylation | 144/8552 | 240/18723 | 5.12e-06 | 5.38e-05 | 144 |
| GO:00064865 | Esophagus | ESCC | protein glycosylation | 135/8552 | 226/18723 | 1.36e-05 | 1.24e-04 | 135 |
| GO:00434135 | Esophagus | ESCC | macromolecule glycosylation | 135/8552 | 226/18723 | 1.36e-05 | 1.24e-04 | 135 |
| GO:00092256 | Esophagus | ESCC | nucleotide-sugar metabolic process | 29/8552 | 36/18723 | 1.91e-05 | 1.67e-04 | 29 |
| GO:00091012 | Esophagus | ESCC | glycoprotein biosynthetic process | 181/8552 | 317/18723 | 2.54e-05 | 2.15e-04 | 181 |
| GO:199082316 | Esophagus | ESCC | response to leukemia inhibitory factor | 60/8552 | 95/18723 | 4.41e-04 | 2.48e-03 | 60 |
| GO:199083015 | Esophagus | ESCC | cellular response to leukemia inhibitory factor | 59/8552 | 94/18723 | 6.19e-04 | 3.32e-03 | 59 |
| GO:00092262 | Esophagus | ESCC | nucleotide-sugar biosynthetic process | 14/8552 | 19/18723 | 1.27e-02 | 4.21e-02 | 14 |
| GO:000609134 | Thyroid | ATC | generation of precursor metabolites and energy | 256/6293 | 490/18723 | 6.55e-18 | 7.69e-16 | 256 |
| GO:001598034 | Thyroid | ATC | energy derivation by oxidation of organic compounds | 177/6293 | 318/18723 | 3.60e-16 | 2.92e-14 | 177 |
| GO:000648715 | Thyroid | ATC | protein N-linked glycosylation | 38/6293 | 65/18723 | 3.39e-05 | 2.80e-04 | 38 |
| GO:000922511 | Thyroid | ATC | nucleotide-sugar metabolic process | 24/6293 | 36/18723 | 5.10e-05 | 3.99e-04 | 24 |
| GO:00060471 | Thyroid | ATC | UDP-N-acetylglucosamine metabolic process | 10/6293 | 14/18723 | 4.31e-03 | 1.80e-02 | 10 |
| GO:199082318 | Thyroid | ATC | response to leukemia inhibitory factor | 44/6293 | 95/18723 | 6.74e-03 | 2.68e-02 | 44 |
| GO:000648612 | Thyroid | ATC | protein glycosylation | 94/6293 | 226/18723 | 7.11e-03 | 2.82e-02 | 94 |
| GO:004341312 | Thyroid | ATC | macromolecule glycosylation | 94/6293 | 226/18723 | 7.11e-03 | 2.82e-02 | 94 |
| Page: 1 2 |
| Pathway ID | Tissue | Disease Stage | Description | Gene Ratio | Bg Ratio | pvalue | p.adjust | qvalue | Count |
| hsa05415211 | Esophagus | ESCC | Diabetic cardiomyopathy | 146/4205 | 203/8465 | 5.81e-11 | 7.78e-10 | 3.99e-10 | 146 |
| hsa049318 | Esophagus | ESCC | Insulin resistance | 69/4205 | 108/8465 | 1.92e-03 | 5.54e-03 | 2.84e-03 | 69 |
| hsa0541538 | Esophagus | ESCC | Diabetic cardiomyopathy | 146/4205 | 203/8465 | 5.81e-11 | 7.78e-10 | 3.99e-10 | 146 |
| hsa0493113 | Esophagus | ESCC | Insulin resistance | 69/4205 | 108/8465 | 1.92e-03 | 5.54e-03 | 2.84e-03 | 69 |
| Page: 1 |
Top |
Cell-cell communication analysis |
| Identification of potential cell-cell interactions between two cell types and their ligand-receptor pairs for different disease states |
| Ligand | Receptor | LRpair | Pathway | Tissue | Disease Stage |
| Page: 1 |
Top |
Single-cell gene regulatory network inference analysis |
| Find out the significant the regulons (TFs) and the target genes of each regulon across cell types for different disease states |
| TF | Cell Type | Tissue | Disease Stage | Target Gene | RSS | Regulon Activity |
| ∗The dot plots of a searched regulon are shown for all cell subpopulations in each disease state of each tissue based on the regulon specific score inferred using pySCENIC and by calculating the average expression. |
| Page: 1 |
Top |
Somatic mutation of malignant transformation related genes |
| Annotation of somatic variants for genes involved in malignant transformation |
| Hugo Symbol | Variant Class | Variant Classification | dbSNP RS | HGVSc | HGVSp | HGVSp Short | SWISSPROT | BIOTYPE | SIFT | PolyPhen | Tumor Sample Barcode | Tissue | Histology | Sex | Age | Stage | Therapy Types | Drugs | Outcome |
| GFPT2 | SNV | Missense_Mutation | novel | c.44N>T | p.Thr15Met | p.T15M | O94808 | protein_coding | deleterious(0.01) | probably_damaging(0.954) | TCGA-ZA-A8F6-01 | Stomach | stomach adenocarcinoma | Male | >=65 | I/II | Unknown | Unknown | SD |
| GFPT2 | insertion | In_Frame_Ins | novel | c.1696_1697insAGTGTG | p.Met566delinsLysCysVal | p.M566delinsKCV | O94808 | protein_coding | TCGA-FY-A4B0-01 | Thyroid | thyroid carcinoma | Male | >=65 | I/II | Hormone Therapy | synthroid | SD |
| Page: 1 2 3 4 5 6 7 8 9 10 11 |
Top |
Related drugs of malignant transformation related genes |
| Identification of chemicals and drugs interact with genes involved in malignant transfromation |
| (DGIdb 4.0) |
| Entrez ID | Symbol | Category | Interaction Types | Drug Claim Name | Drug Name | PMIDs |
| Page: 1 |

Copyright 2023-Present -The University of Texas Health Science Center at Houston |