
|
|||||
|
 | |
| |
| |
| |
| |
| |
|
Gene: EMILIN2 |
Gene summary for EMILIN2 |
| Gene information | Species | Human | Gene symbol | EMILIN2 | Gene ID | 84034 |
| Gene name | elastin microfibril interfacer 2 | |
| Gene Alias | EMILIN-2 | |
| Cytomap | 18p11.32-p11.31 | |
| Gene Type | protein-coding | GO ID | GO:0007155 | UniProtAcc | Q9BXX0 |
Top |
Malignant transformation analysis |
| Identification of the aberrant gene expression in precancerous and cancerous lesions by comparing the gene expression of stem-like cells in diseased tissues with normal stem cells |
| Entrez ID | Symbol | Replicates | Species | Organ | Tissue | Adj P-value | Log2FC | Malignancy |
| 84034 | EMILIN2 | male-WTA | Human | Thyroid | PTC | 2.98e-06 | 1.32e-01 | 0.1037 |
| 84034 | EMILIN2 | PTC01 | Human | Thyroid | PTC | 5.49e-12 | 2.54e-01 | 0.1899 |
| 84034 | EMILIN2 | PTC04 | Human | Thyroid | PTC | 1.31e-23 | 5.03e-01 | 0.1927 |
| 84034 | EMILIN2 | PTC05 | Human | Thyroid | PTC | 2.04e-16 | 4.86e-01 | 0.2065 |
| 84034 | EMILIN2 | PTC06 | Human | Thyroid | PTC | 8.65e-12 | 3.19e-01 | 0.2057 |
| 84034 | EMILIN2 | PTC07 | Human | Thyroid | PTC | 1.89e-24 | 4.55e-01 | 0.2044 |
| 84034 | EMILIN2 | ATC11 | Human | Thyroid | ATC | 2.77e-02 | 2.44e-01 | 0.3386 |
| 84034 | EMILIN2 | ATC12 | Human | Thyroid | ATC | 1.18e-03 | 2.18e-01 | 0.34 |
| 84034 | EMILIN2 | ATC13 | Human | Thyroid | ATC | 2.26e-33 | 6.38e-01 | 0.34 |
| 84034 | EMILIN2 | ATC2 | Human | Thyroid | ATC | 2.68e-07 | 5.90e-01 | 0.34 |
| 84034 | EMILIN2 | ATC4 | Human | Thyroid | ATC | 5.04e-06 | 2.84e-01 | 0.34 |
| 84034 | EMILIN2 | ATC5 | Human | Thyroid | ATC | 6.41e-40 | 6.98e-01 | 0.34 |
| Page: 1 |
| Tissue | Expression Dynamics | Abbreviation |
| Thyroid | 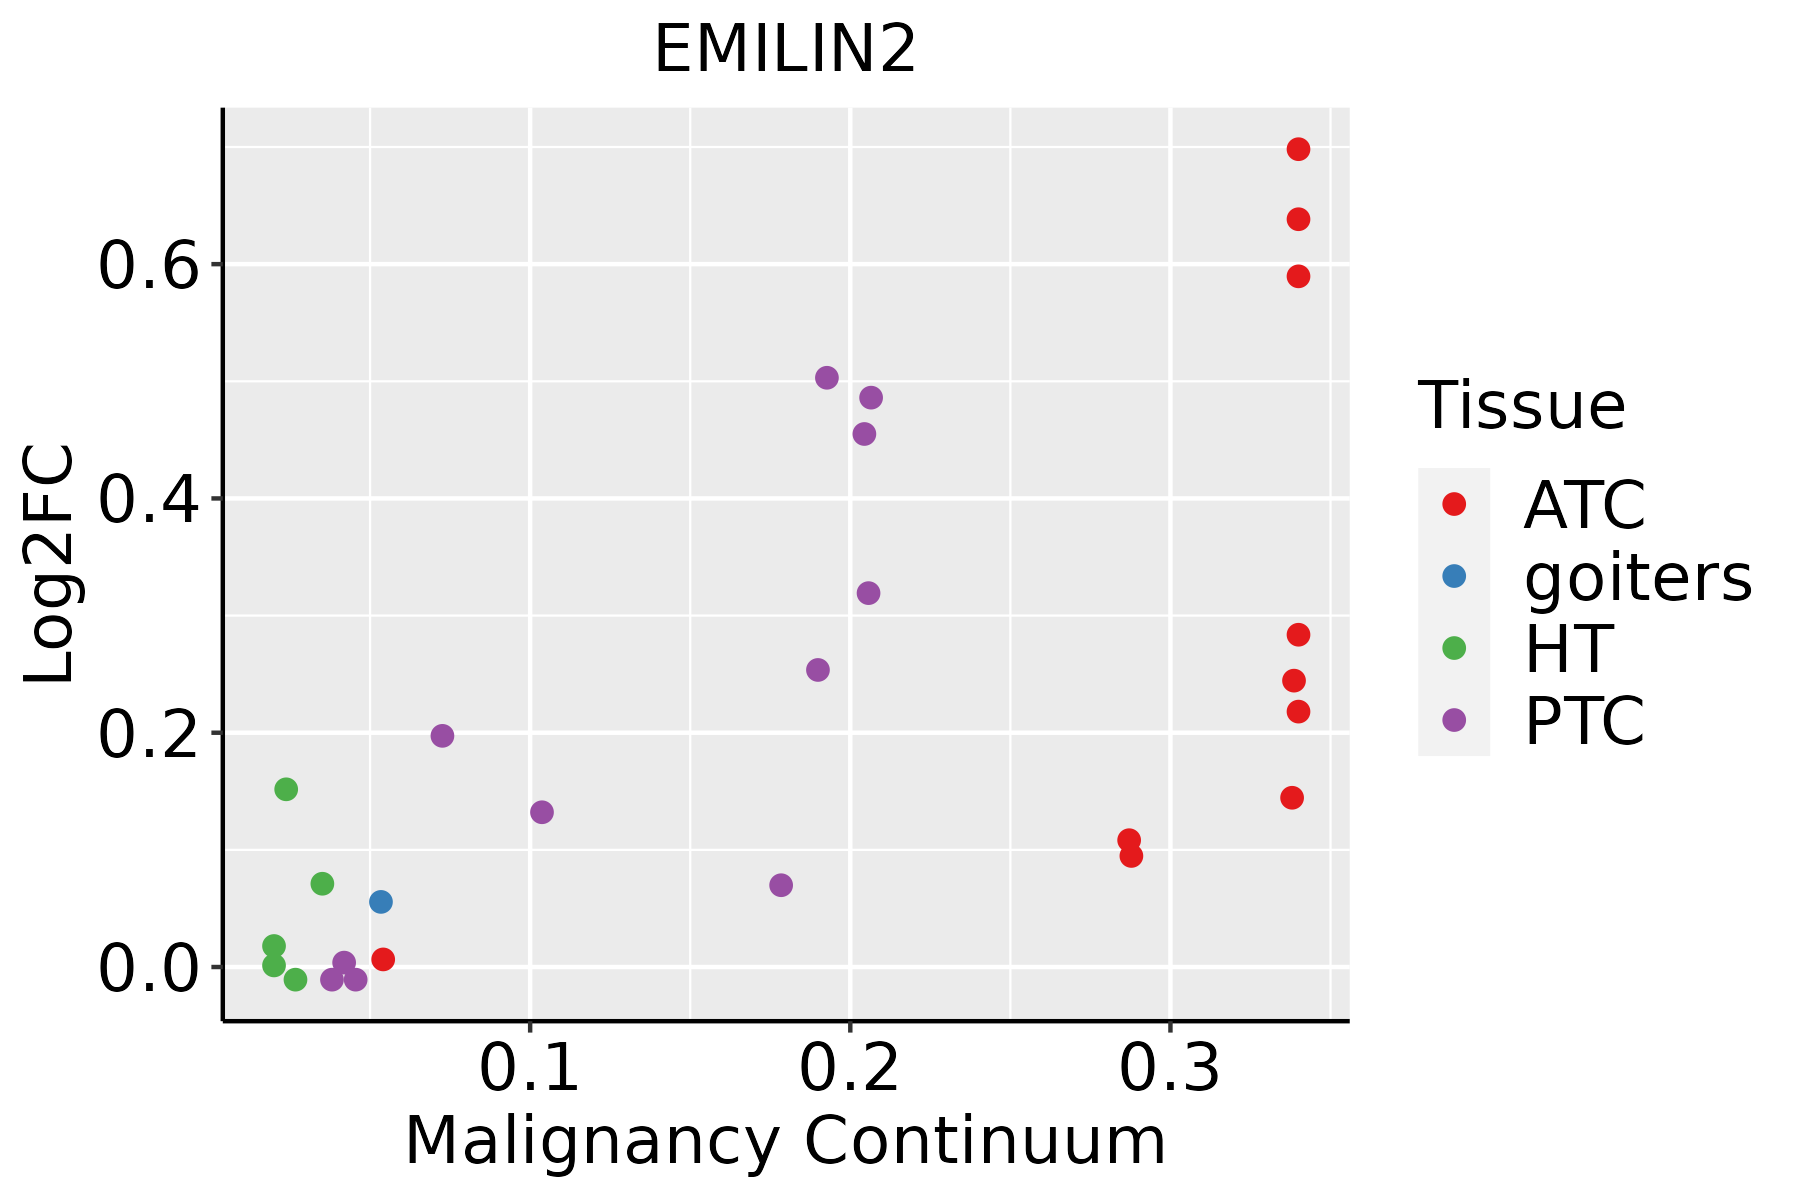 | ATC: Anaplastic thyroid cancer |
| HT: Hashimoto's thyroiditis | ||
| PTC: Papillary thyroid cancer |
| ∗log2FC in expression of this searched gene in stem-like cells from each diseased tissue sample relative to stem-like cells in normal samples in each tissue plotted against the malignancy continuum. Samples are colored based on if they are from different disease stage. |
Top |
Malignant transformation related pathway analysis |
| Find out the enriched GO biological processes and KEGG pathways involved in transition from healthy to precancer to cancer |
| Tissue | Disease Stage | Enriched GO biological Processes |
| Colorectum | AD |  |
| Colorectum | SER |  |
| Colorectum | MSS |  |
| Colorectum | MSI-H |  |
| Colorectum | FAP |  |
| ∗Top 15 enriched GO BP terms are showed in the bar plot of each disease state in each tissue. Each row represents a significant GO biological process which is colored according to the -log10(p.adjust). |
| Page: 1 2 3 4 5 6 7 8 9 |
| GO ID | Tissue | Disease Stage | Description | Gene Ratio | Bg Ratio | pvalue | p.adjust | Count |
| Page: 1 |
| Pathway ID | Tissue | Disease Stage | Description | Gene Ratio | Bg Ratio | pvalue | p.adjust | qvalue | Count |
| Page: 1 |
Top |
Cell-cell communication analysis |
| Identification of potential cell-cell interactions between two cell types and their ligand-receptor pairs for different disease states |
| Ligand | Receptor | LRpair | Pathway | Tissue | Disease Stage |
| Page: 1 |
Top |
Single-cell gene regulatory network inference analysis |
| Find out the significant the regulons (TFs) and the target genes of each regulon across cell types for different disease states |
| TF | Cell Type | Tissue | Disease Stage | Target Gene | RSS | Regulon Activity |
| ∗The dot plots of a searched regulon are shown for all cell subpopulations in each disease state of each tissue based on the regulon specific score inferred using pySCENIC and by calculating the average expression. |
| Page: 1 |
Top |
Somatic mutation of malignant transformation related genes |
| Annotation of somatic variants for genes involved in malignant transformation |
| Hugo Symbol | Variant Class | Variant Classification | dbSNP RS | HGVSc | HGVSp | HGVSp Short | SWISSPROT | BIOTYPE | SIFT | PolyPhen | Tumor Sample Barcode | Tissue | Histology | Sex | Age | Stage | Therapy Types | Drugs | Outcome |
| EMILIN2 | SNV | Missense_Mutation | c.2195N>C | p.Lys732Thr | p.K732T | Q9BXX0 | protein_coding | deleterious(0.02) | possibly_damaging(0.54) | TCGA-HU-A4GH-01 | Stomach | stomach adenocarcinoma | Male | >=65 | I/II | Unknown | Unknown | SD | |
| EMILIN2 | SNV | Missense_Mutation | novel | c.464N>T | p.Arg155Met | p.R155M | Q9BXX0 | protein_coding | deleterious(0.02) | benign(0.396) | TCGA-IN-A6RR-01 | Stomach | stomach adenocarcinoma | Male | >=65 | III/IV | Chemotherapy | unkown | SD |
| EMILIN2 | SNV | Missense_Mutation | novel | c.1964C>T | p.Thr655Ile | p.T655I | Q9BXX0 | protein_coding | deleterious(0.04) | benign(0.035) | TCGA-MX-A666-01 | Stomach | stomach adenocarcinoma | Male | <65 | I/II | Chemotherapy | epirubicin | SD |
| EMILIN2 | SNV | Missense_Mutation | novel | c.1696G>A | p.Gly566Ser | p.G566S | Q9BXX0 | protein_coding | tolerated(0.76) | benign(0.003) | TCGA-SW-A7EB-01 | Stomach | stomach adenocarcinoma | Male | <65 | III/IV | Chemotherapy | fluorouracil | SD |
| EMILIN2 | SNV | Missense_Mutation | rs749622305 | c.1729N>T | p.Arg577Cys | p.R577C | Q9BXX0 | protein_coding | tolerated(0.05) | benign(0.443) | TCGA-VQ-A91D-01 | Stomach | stomach adenocarcinoma | Male | >=65 | III/IV | Chemotherapy | fluorouracil | PD |
| EMILIN2 | SNV | Missense_Mutation | rs763050616 | c.2729N>T | p.Ala910Val | p.A910V | Q9BXX0 | protein_coding | tolerated(0.17) | benign(0.299) | TCGA-VQ-A91E-01 | Stomach | stomach adenocarcinoma | Female | >=65 | III/IV | Chemotherapy | fluorouracil | CR |
| EMILIN2 | deletion | Frame_Shift_Del | novel | c.3080delG | p.Gly1027AlafsTer38 | p.G1027Afs*38 | Q9BXX0 | protein_coding | TCGA-BR-4361-01 | Stomach | stomach adenocarcinoma | Female | >=65 | III/IV | Unknown | Unknown | SD | ||
| EMILIN2 | SNV | Missense_Mutation | novel | c.2669C>A | p.Pro890Gln | p.P890Q | Q9BXX0 | protein_coding | deleterious(0) | possibly_damaging(0.635) | TCGA-E8-A2EA-01 | Thyroid | thyroid carcinoma | Female | <65 | I/II | Unknown | Unknown | SD |
| EMILIN2 | insertion | In_Frame_Ins | novel | c.2205_2206insTCCGAG | p.Ser736_Leu737insGluSer | p.S736_L737insES | Q9BXX0 | protein_coding | TCGA-E8-A436-01 | Thyroid | thyroid carcinoma | Female | <65 | I/II | Unknown | Unknown | SD |
| Page: 1 2 3 4 5 6 7 8 9 10 11 |
Top |
Related drugs of malignant transformation related genes |
| Identification of chemicals and drugs interact with genes involved in malignant transfromation |
| (DGIdb 4.0) |
| Entrez ID | Symbol | Category | Interaction Types | Drug Claim Name | Drug Name | PMIDs |
| Page: 1 |

Copyright 2023-Present -The University of Texas Health Science Center at Houston |