
|
|||||
|
 | |
| |
| |
| |
| |
| |
|
Gene: TSPYL2 |
Gene summary for TSPYL2 |
| Gene information | Species | Human | Gene symbol | TSPYL2 | Gene ID | 64061 |
| Gene name | TSPY like 2 | |
| Gene Alias | CDA1 | |
| Cytomap | Xp11.22 | |
| Gene Type | protein-coding | GO ID | GO:0001558 | UniProtAcc | Q9H2G4 |
Top |
Malignant transformation analysis |
| Identification of the aberrant gene expression in precancerous and cancerous lesions by comparing the gene expression of stem-like cells in diseased tissues with normal stem cells |
| Entrez ID | Symbol | Replicates | Species | Organ | Tissue | Adj P-value | Log2FC | Malignancy |
| 64061 | TSPYL2 | GSM4909277 | Human | Breast | Precancer | 3.67e-05 | 7.34e-01 | 0.0177 |
| 64061 | TSPYL2 | GSM4909280 | Human | Breast | Precancer | 1.08e-04 | 5.93e-01 | 0.0305 |
| 64061 | TSPYL2 | GSM4909296 | Human | Breast | IDC | 5.10e-04 | -1.73e-01 | 0.1524 |
| 64061 | TSPYL2 | GSM4909311 | Human | Breast | IDC | 1.91e-05 | -1.94e-01 | 0.1534 |
| 64061 | TSPYL2 | GSM4909312 | Human | Breast | IDC | 7.95e-05 | -2.03e-01 | 0.1552 |
| 64061 | TSPYL2 | GSM4909319 | Human | Breast | IDC | 1.24e-08 | -1.19e-01 | 0.1563 |
| 64061 | TSPYL2 | NCCBC14 | Human | Breast | DCIS | 1.81e-05 | -2.19e-01 | 0.2021 |
| 64061 | TSPYL2 | NCCBC5 | Human | Breast | DCIS | 1.04e-02 | -2.00e-01 | 0.2046 |
| 64061 | TSPYL2 | P1 | Human | Breast | IDC | 1.86e-04 | -1.14e-01 | 0.1527 |
| 64061 | TSPYL2 | DCIS2 | Human | Breast | DCIS | 1.51e-40 | 1.66e-01 | 0.0085 |
| 64061 | TSPYL2 | LZE4T | Human | Esophagus | ESCC | 1.08e-07 | 4.50e-01 | 0.0811 |
| 64061 | TSPYL2 | LZE7T | Human | Esophagus | ESCC | 2.30e-05 | 4.33e-01 | 0.0667 |
| 64061 | TSPYL2 | LZE24T | Human | Esophagus | ESCC | 2.73e-23 | 7.75e-01 | 0.0596 |
| 64061 | TSPYL2 | LZE21T | Human | Esophagus | ESCC | 2.09e-05 | 5.86e-01 | 0.0655 |
| 64061 | TSPYL2 | LZE6T | Human | Esophagus | ESCC | 4.88e-03 | 2.52e-01 | 0.0845 |
| 64061 | TSPYL2 | P1T-E | Human | Esophagus | ESCC | 1.46e-08 | 7.37e-01 | 0.0875 |
| 64061 | TSPYL2 | P2T-E | Human | Esophagus | ESCC | 6.55e-28 | 6.20e-01 | 0.1177 |
| 64061 | TSPYL2 | P4T-E | Human | Esophagus | ESCC | 1.96e-35 | 9.32e-01 | 0.1323 |
| 64061 | TSPYL2 | P5T-E | Human | Esophagus | ESCC | 1.74e-11 | 2.89e-01 | 0.1327 |
| 64061 | TSPYL2 | P8T-E | Human | Esophagus | ESCC | 3.96e-10 | 1.54e-01 | 0.0889 |
| Page: 1 2 3 4 5 6 |
| Tissue | Expression Dynamics | Abbreviation |
| Breast | 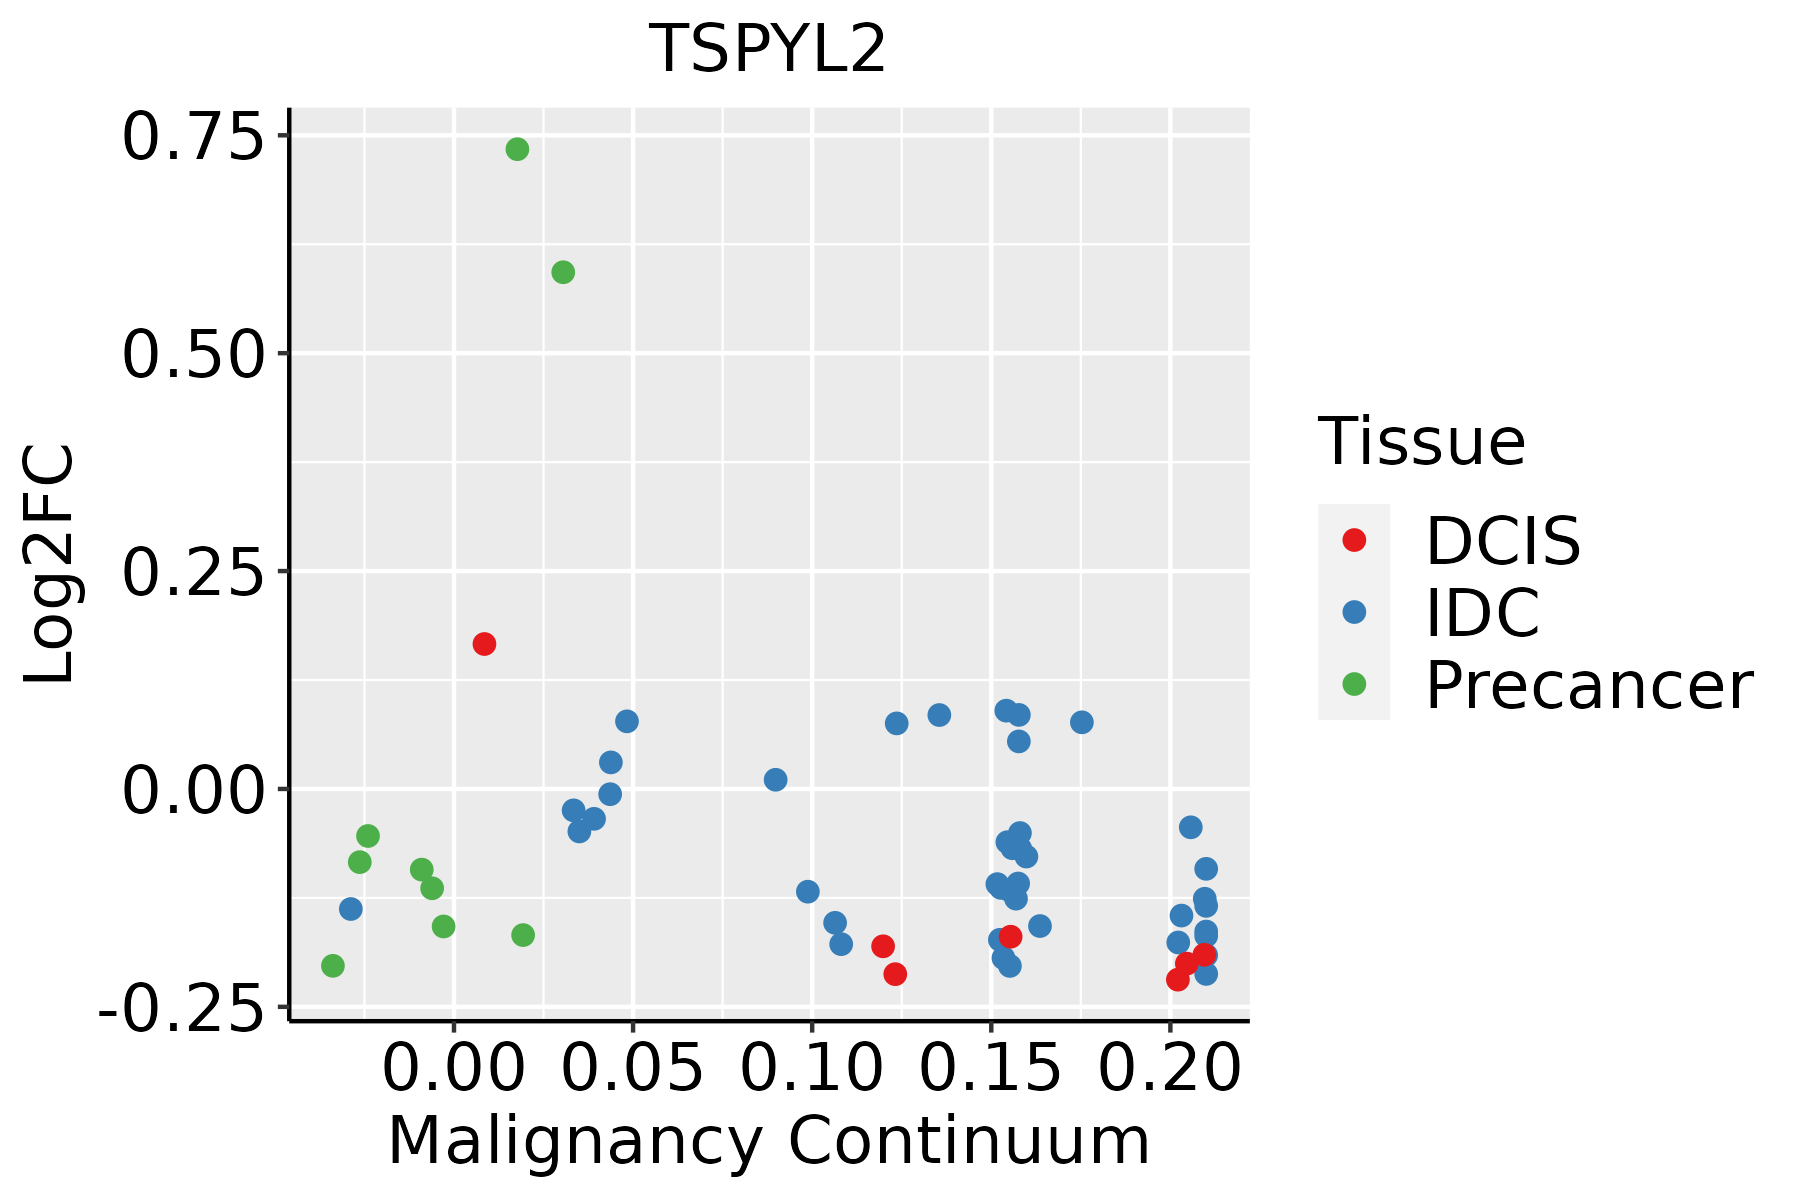 | IDC: Invasive ductal carcinoma |
| DCIS: Ductal carcinoma in situ | ||
| Precancer(BRCA1-mut): Precancerous lesion from BRCA1 mutation carriers | ||
| Esophagus |  | ESCC: Esophageal squamous cell carcinoma |
| HGIN: High-grade intraepithelial neoplasias | ||
| LGIN: Low-grade intraepithelial neoplasias | ||
| Liver | 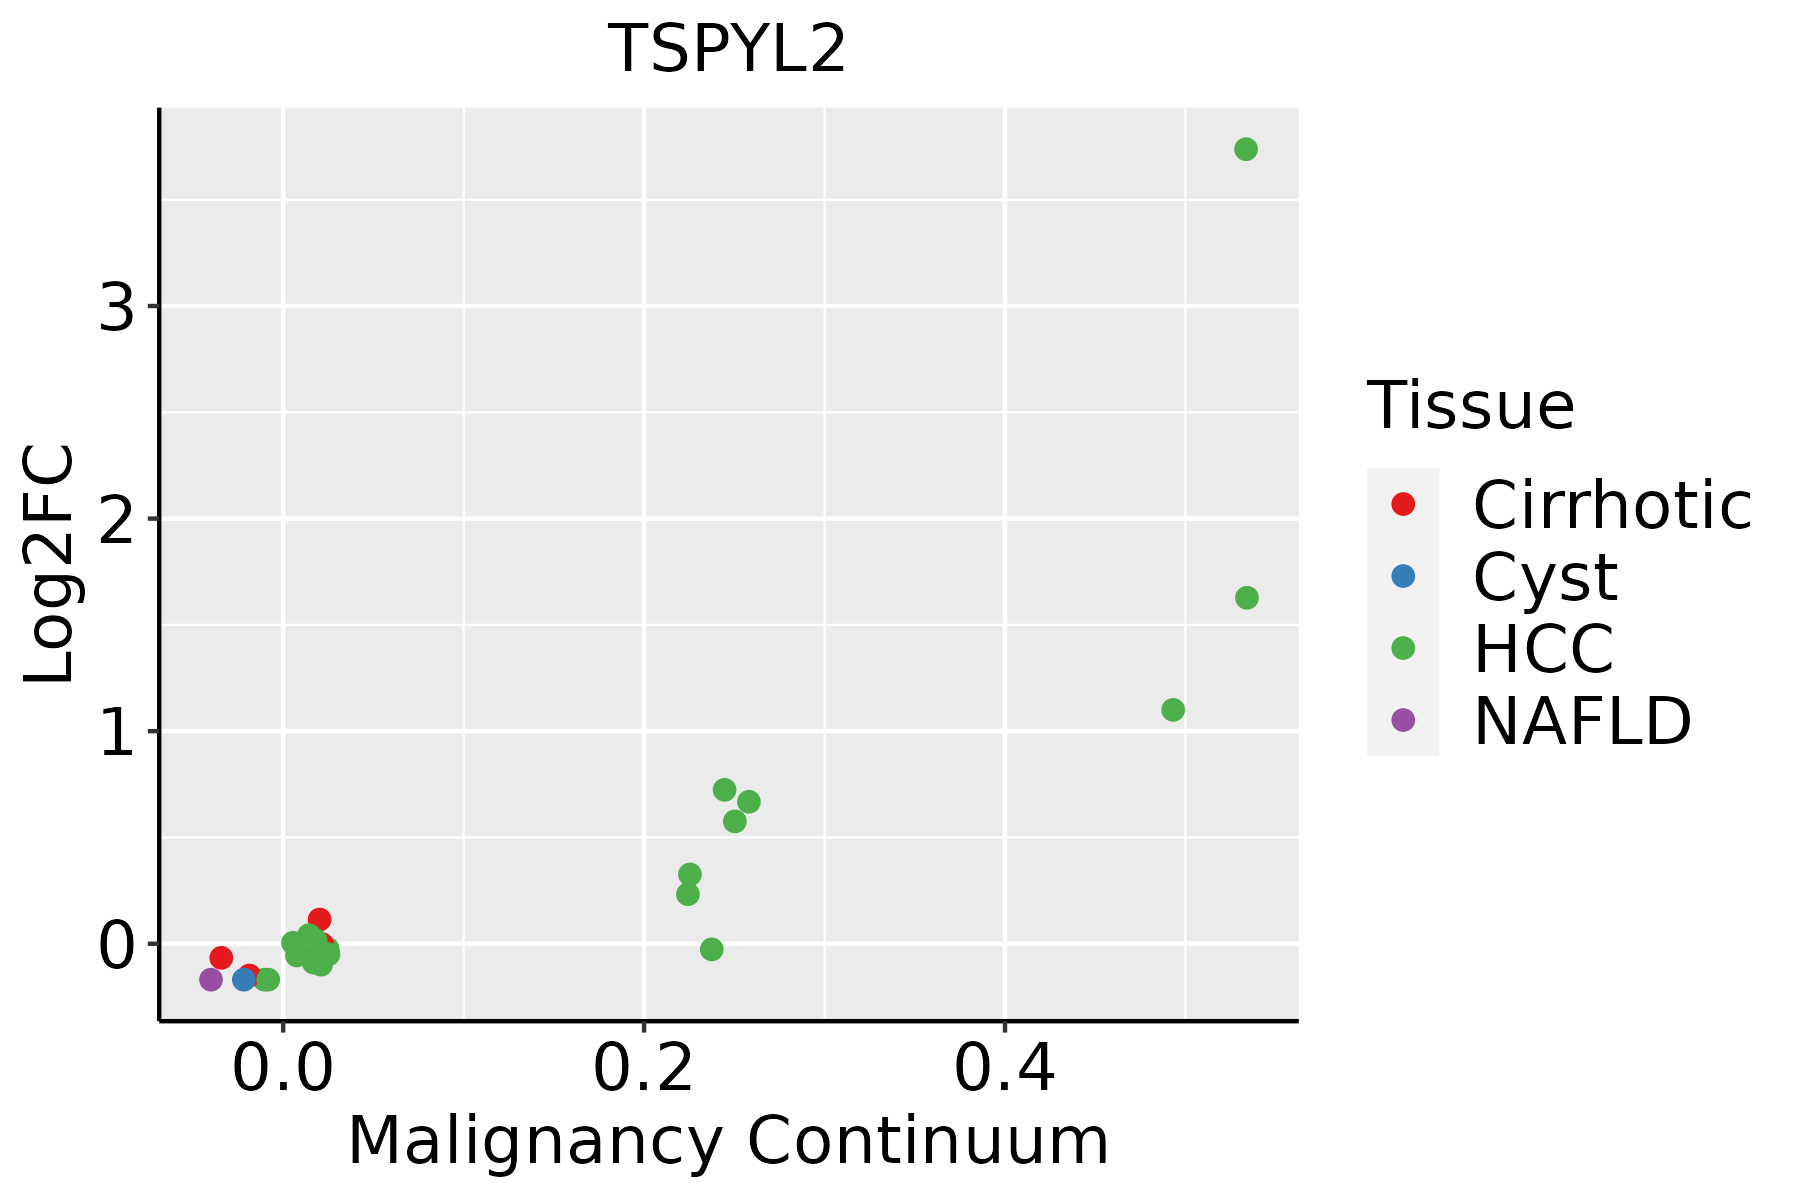 | HCC: Hepatocellular carcinoma |
| NAFLD: Non-alcoholic fatty liver disease | ||
| Lung |  | AAH: Atypical adenomatous hyperplasia |
| AIS: Adenocarcinoma in situ | ||
| IAC: Invasive lung adenocarcinoma | ||
| MIA: Minimally invasive adenocarcinoma | ||
| Oral Cavity |  | EOLP: Erosive Oral lichen planus |
| LP: leukoplakia | ||
| NEOLP: Non-erosive oral lichen planus | ||
| OSCC: Oral squamous cell carcinoma | ||
| Prostate | 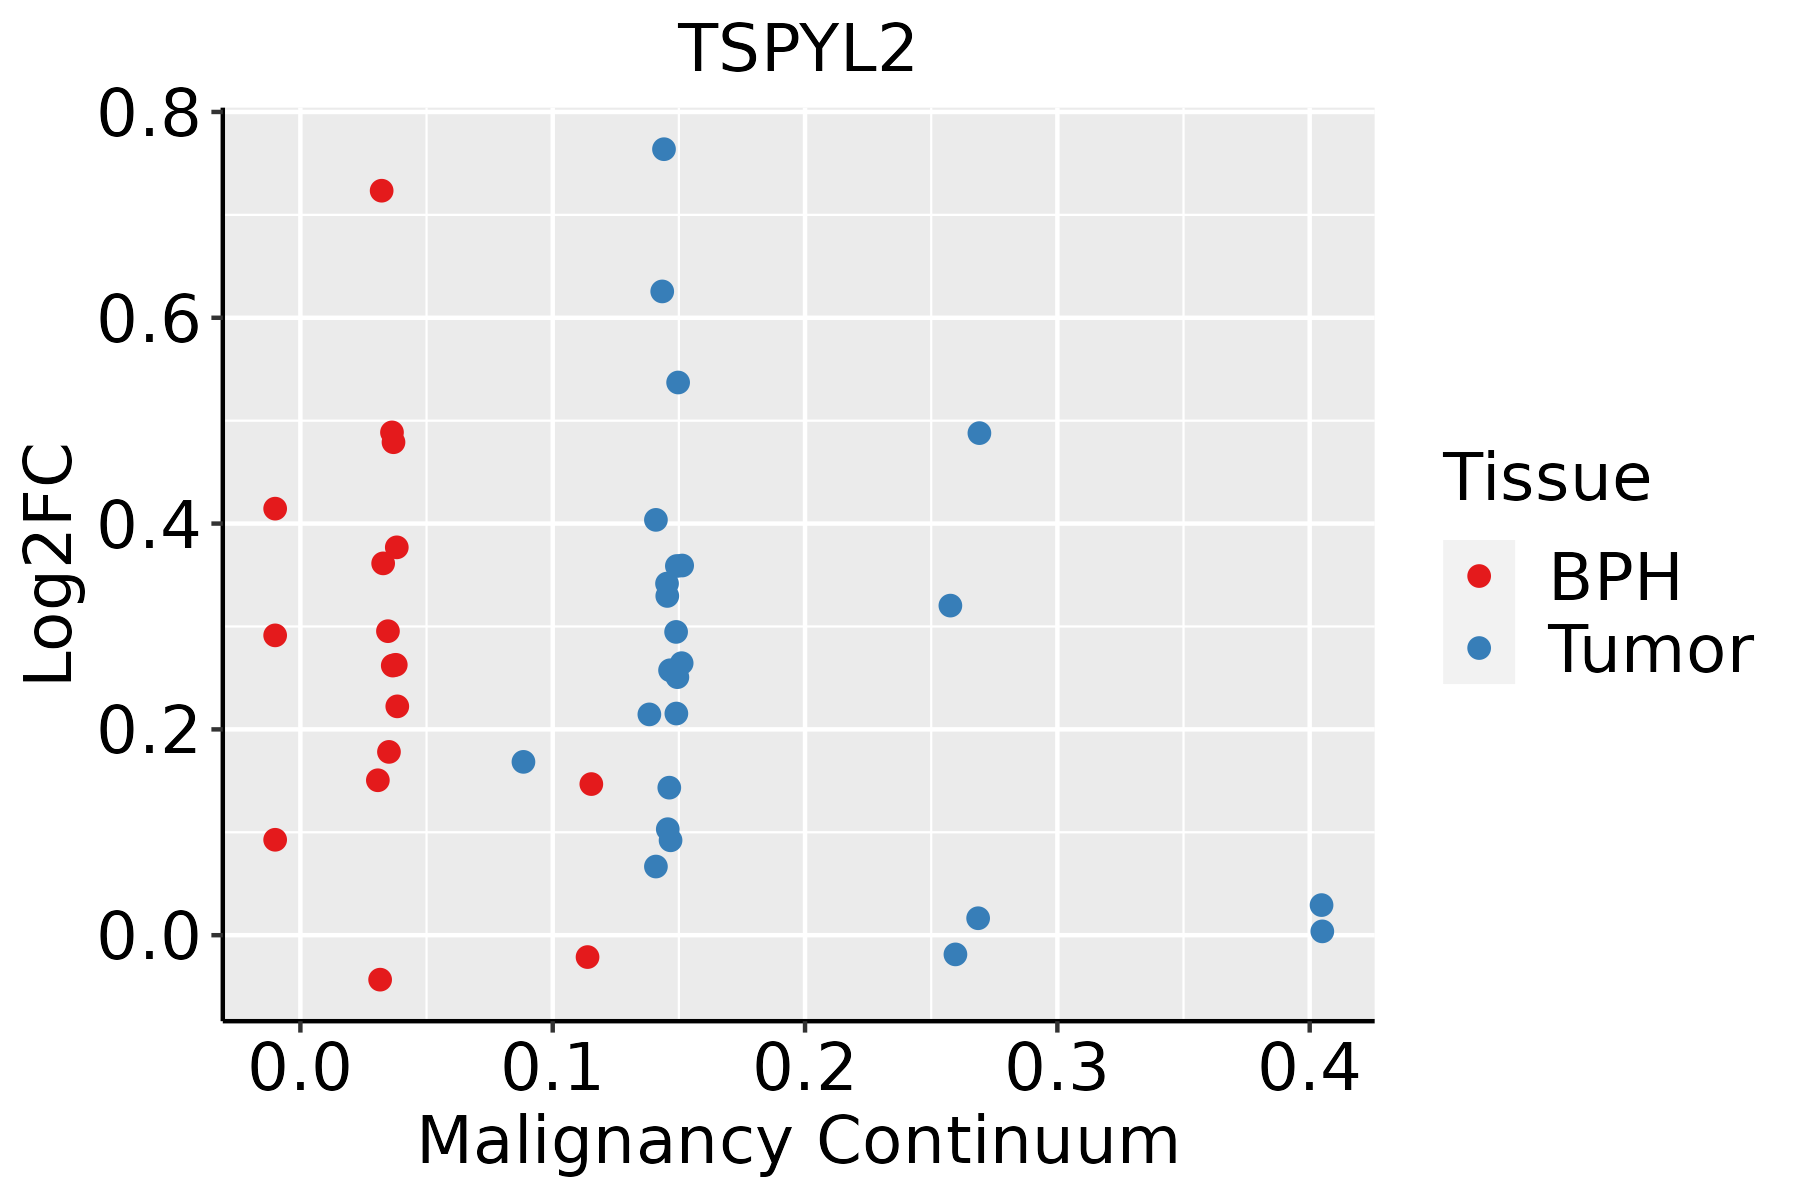 | BPH: Benign Prostatic Hyperplasia |
| Thyroid | 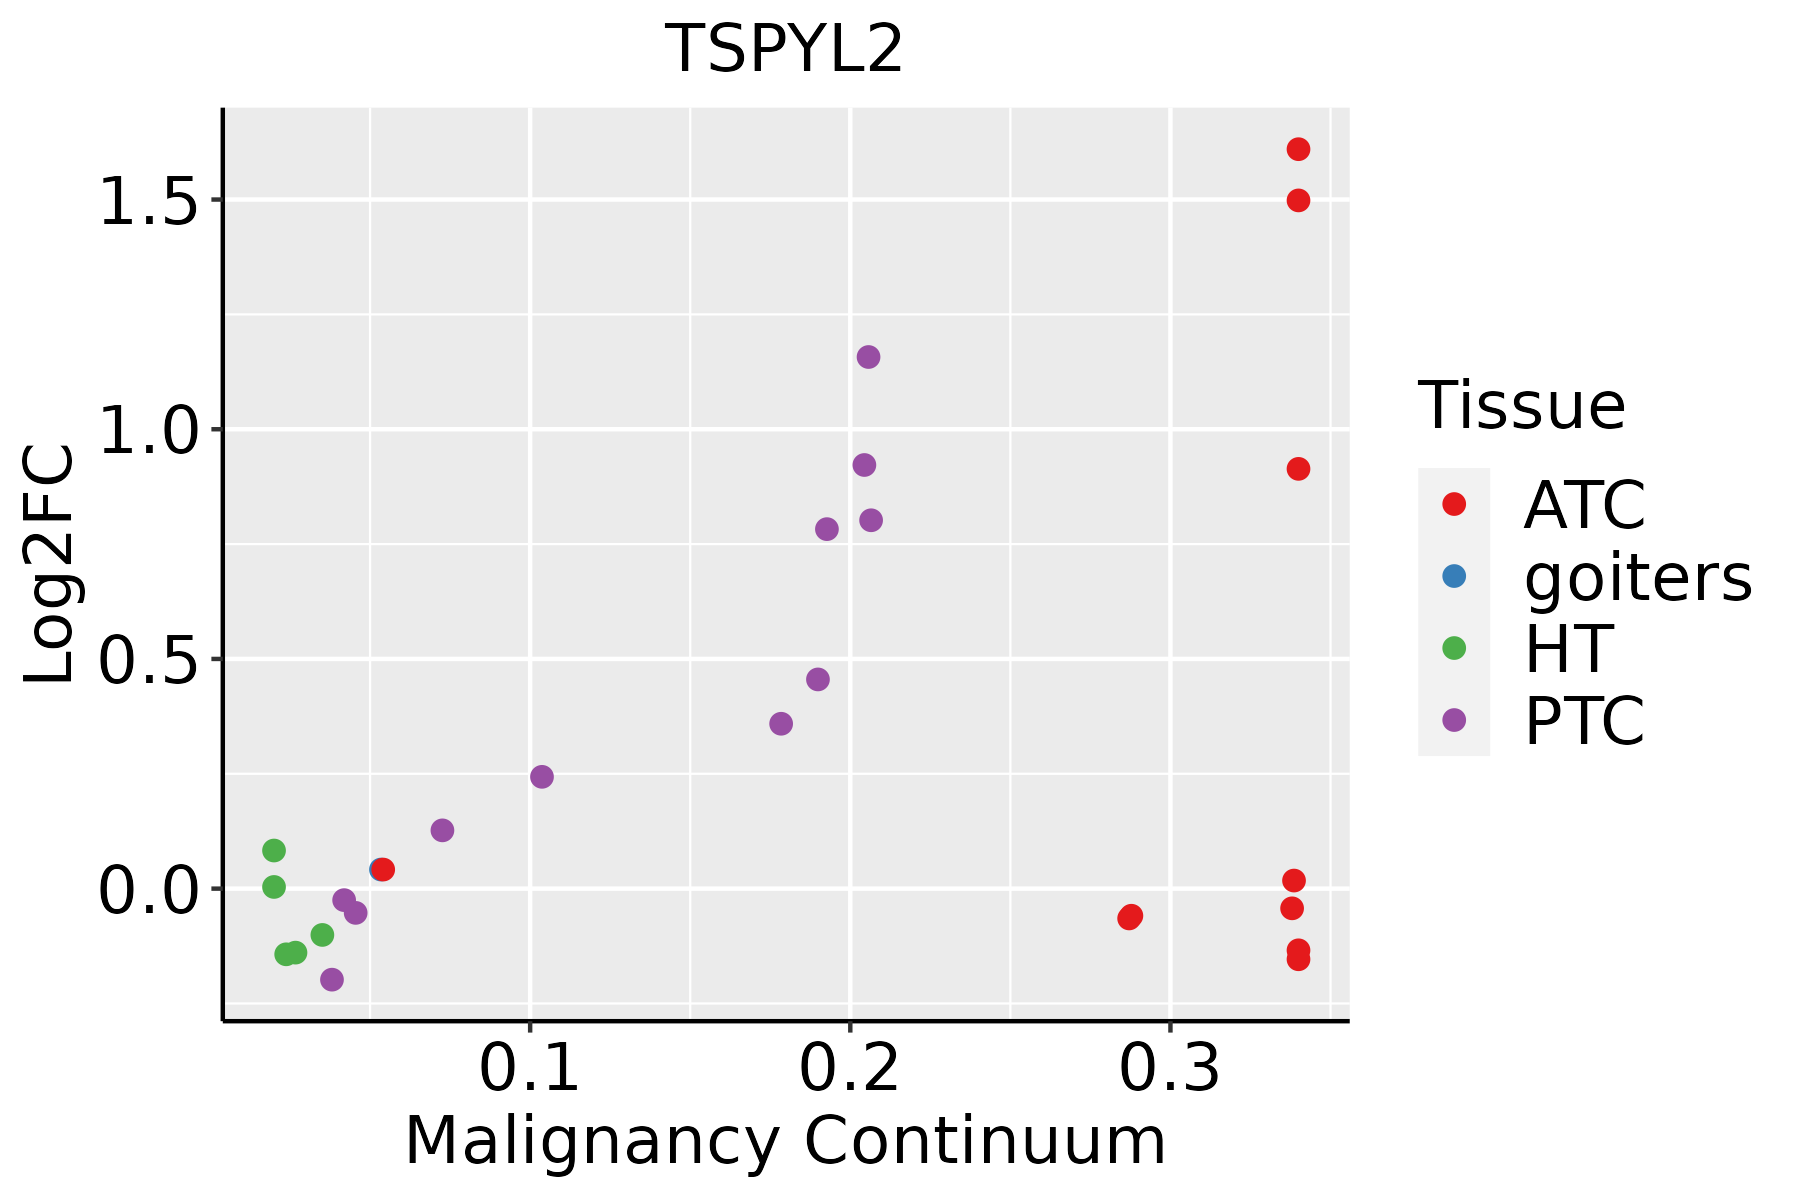 | ATC: Anaplastic thyroid cancer |
| HT: Hashimoto's thyroiditis | ||
| PTC: Papillary thyroid cancer |
| ∗log2FC in expression of this searched gene in stem-like cells from each diseased tissue sample relative to stem-like cells in normal samples in each tissue plotted against the malignancy continuum. Samples are colored based on if they are from different disease stage. |
Top |
Malignant transformation related pathway analysis |
| Find out the enriched GO biological processes and KEGG pathways involved in transition from healthy to precancer to cancer |
| Tissue | Disease Stage | Enriched GO biological Processes |
| Colorectum | AD |  |
| Colorectum | SER |  |
| Colorectum | MSS |  |
| Colorectum | MSI-H |  |
| Colorectum | FAP |  |
| ∗Top 15 enriched GO BP terms are showed in the bar plot of each disease state in each tissue. Each row represents a significant GO biological process which is colored according to the -log10(p.adjust). |
| Page: 1 2 3 4 5 6 7 8 9 |
| GO ID | Tissue | Disease Stage | Description | Gene Ratio | Bg Ratio | pvalue | p.adjust | Count |
| GO:00160497 | Breast | Precancer | cell growth | 46/1080 | 482/18723 | 5.63e-04 | 7.16e-03 | 46 |
| GO:00015587 | Breast | Precancer | regulation of cell growth | 39/1080 | 414/18723 | 1.81e-03 | 1.78e-02 | 39 |
| GO:001604913 | Breast | IDC | cell growth | 56/1434 | 482/18723 | 1.16e-03 | 1.26e-02 | 56 |
| GO:000155813 | Breast | IDC | regulation of cell growth | 49/1434 | 414/18723 | 1.55e-03 | 1.55e-02 | 49 |
| GO:001604923 | Breast | DCIS | cell growth | 54/1390 | 482/18723 | 1.60e-03 | 1.59e-02 | 54 |
| GO:000155822 | Breast | DCIS | regulation of cell growth | 47/1390 | 414/18723 | 2.39e-03 | 2.16e-02 | 47 |
| GO:00062604 | Esophagus | ESCC | DNA replication | 181/8552 | 260/18723 | 3.55e-15 | 2.05e-13 | 181 |
| GO:0016049110 | Esophagus | ESCC | cell growth | 289/8552 | 482/18723 | 1.29e-10 | 3.77e-09 | 289 |
| GO:00457865 | Esophagus | ESCC | negative regulation of cell cycle | 236/8552 | 385/18723 | 3.62e-10 | 9.93e-09 | 236 |
| GO:000155819 | Esophagus | ESCC | regulation of cell growth | 248/8552 | 414/18723 | 2.97e-09 | 6.45e-08 | 248 |
| GO:000632517 | Esophagus | ESCC | chromatin organization | 240/8552 | 409/18723 | 6.52e-08 | 1.14e-06 | 240 |
| GO:00062754 | Esophagus | ESCC | regulation of DNA replication | 73/8552 | 107/18723 | 1.97e-06 | 2.28e-05 | 73 |
| GO:00459267 | Esophagus | ESCC | negative regulation of growth | 148/8552 | 249/18723 | 7.88e-06 | 7.73e-05 | 148 |
| GO:00303085 | Esophagus | ESCC | negative regulation of cell growth | 108/8552 | 188/18723 | 7.46e-04 | 3.87e-03 | 108 |
| GO:001604911 | Liver | Cirrhotic | cell growth | 160/4634 | 482/18723 | 1.50e-05 | 2.07e-04 | 160 |
| GO:000155811 | Liver | Cirrhotic | regulation of cell growth | 132/4634 | 414/18723 | 5.53e-04 | 4.36e-03 | 132 |
| GO:001604921 | Liver | HCC | cell growth | 269/7958 | 482/18723 | 1.84e-09 | 5.35e-08 | 269 |
| GO:000155821 | Liver | HCC | regulation of cell growth | 228/7958 | 414/18723 | 1.34e-07 | 2.55e-06 | 228 |
| GO:00062601 | Liver | HCC | DNA replication | 146/7958 | 260/18723 | 5.68e-06 | 7.02e-05 | 146 |
| GO:0045786 | Liver | HCC | negative regulation of cell cycle | 204/7958 | 385/18723 | 1.84e-05 | 1.99e-04 | 204 |
| Page: 1 2 3 4 |
| Pathway ID | Tissue | Disease Stage | Description | Gene Ratio | Bg Ratio | pvalue | p.adjust | qvalue | Count |
| Page: 1 |
Top |
Cell-cell communication analysis |
| Identification of potential cell-cell interactions between two cell types and their ligand-receptor pairs for different disease states |
| Ligand | Receptor | LRpair | Pathway | Tissue | Disease Stage |
| Page: 1 |
Top |
Single-cell gene regulatory network inference analysis |
| Find out the significant the regulons (TFs) and the target genes of each regulon across cell types for different disease states |
| TF | Cell Type | Tissue | Disease Stage | Target Gene | RSS | Regulon Activity |
| ∗The dot plots of a searched regulon are shown for all cell subpopulations in each disease state of each tissue based on the regulon specific score inferred using pySCENIC and by calculating the average expression. |
| Page: 1 |
Top |
Somatic mutation of malignant transformation related genes |
| Annotation of somatic variants for genes involved in malignant transformation |
| Hugo Symbol | Variant Class | Variant Classification | dbSNP RS | HGVSc | HGVSp | HGVSp Short | SWISSPROT | BIOTYPE | SIFT | PolyPhen | Tumor Sample Barcode | Tissue | Histology | Sex | Age | Stage | Therapy Types | Drugs | Outcome |
| TSPYL2 | deletion | Frame_Shift_Del | c.378delG | p.Ser127AlafsTer20 | p.S127Afs*20 | Q9H2G4 | protein_coding | TCGA-BR-8078-01 | Stomach | stomach adenocarcinoma | Female | >=65 | I/II | Unknown | Unknown | SD | |||
| TSPYL2 | deletion | Frame_Shift_Del | novel | c.2074delA | p.Thr692ProfsTer27 | p.T692Pfs*27 | Q9H2G4 | protein_coding | TCGA-D7-A6EY-01 | Stomach | stomach adenocarcinoma | Female | >=65 | III/IV | Unknown | Unknown | PD | ||
| TSPYL2 | deletion | Frame_Shift_Del | c.243delN | p.Ile84SerfsTer63 | p.I84Sfs*63 | Q9H2G4 | protein_coding | TCGA-HJ-7597-01 | Stomach | stomach adenocarcinoma | Female | >=65 | I/II | Chemotherapy | fluorouracil | CR | |||
| TSPYL2 | SNV | Missense_Mutation | rs369549099 | c.1058N>A | p.Arg353His | p.R353H | Q9H2G4 | protein_coding | tolerated(1) | benign(0.003) | TCGA-EL-A3CR-01 | Thyroid | thyroid carcinoma | Female | >=65 | III/IV | Unknown | Unknown | SD |
| TSPYL2 | insertion | Frame_Shift_Ins | novel | c.1582_1583insTGAATTGTCTC | p.Asn528MetfsTer100 | p.N528Mfs*100 | Q9H2G4 | protein_coding | TCGA-FY-A4B0-01 | Thyroid | thyroid carcinoma | Male | >=65 | I/II | Hormone Therapy | synthroid | SD |
| Page: 1 2 3 4 5 6 7 8 9 10 |
Top |
Related drugs of malignant transformation related genes |
| Identification of chemicals and drugs interact with genes involved in malignant transfromation |
| (DGIdb 4.0) |
| Entrez ID | Symbol | Category | Interaction Types | Drug Claim Name | Drug Name | PMIDs |
| 64061 | TSPYL2 | NA | BROMODEOXYURIDINE | 11395479 | ||
| 64061 | TSPYL2 | NA | RETINOIC ACID | 15823505 | ||
| 64061 | TSPYL2 | NA | TGFBETA1 | 15823505 | ||
| 64061 | TSPYL2 | NA | SODIUM BUTYRATE | 12619135 |
| Page: 1 |

Copyright 2023-Present -The University of Texas Health Science Center at Houston |