
|
|||||
|
 | |
| |
| |
| |
| |
| |
|
Gene: INTS7 |
Gene summary for INTS7 |
| Gene information | Species | Human | Gene symbol | INTS7 | Gene ID | 25896 |
| Gene name | integrator complex subunit 7 | |
| Gene Alias | C1orf73 | |
| Cytomap | 1q32.3 | |
| Gene Type | protein-coding | GO ID | GO:0000075 | UniProtAcc | Q9NVH2 |
Top |
Malignant transformation analysis |
| Identification of the aberrant gene expression in precancerous and cancerous lesions by comparing the gene expression of stem-like cells in diseased tissues with normal stem cells |
| Entrez ID | Symbol | Replicates | Species | Organ | Tissue | Adj P-value | Log2FC | Malignancy |
| 25896 | INTS7 | CCI_1 | Human | Cervix | CC | 7.40e-10 | 6.58e-01 | 0.528 |
| 25896 | INTS7 | CCI_2 | Human | Cervix | CC | 4.06e-04 | 5.02e-01 | 0.5249 |
| 25896 | INTS7 | CCI_3 | Human | Cervix | CC | 3.27e-06 | 6.27e-01 | 0.516 |
| 25896 | INTS7 | HCC1_Meng | Human | Liver | HCC | 3.73e-43 | 3.33e-02 | 0.0246 |
| 25896 | INTS7 | HCC2_Meng | Human | Liver | HCC | 4.12e-04 | 4.60e-03 | 0.0107 |
| 25896 | INTS7 | HCC2 | Human | Liver | HCC | 1.59e-05 | 2.95e+00 | 0.5341 |
| 25896 | INTS7 | HCC5 | Human | Liver | HCC | 2.69e-03 | 1.03e+00 | 0.4932 |
| 25896 | INTS7 | S028 | Human | Liver | HCC | 3.40e-03 | 3.52e-01 | 0.2503 |
| 25896 | INTS7 | S029 | Human | Liver | HCC | 3.80e-03 | 3.60e-01 | 0.2581 |
| 25896 | INTS7 | HTA12-23-1 | Human | Pancreas | PDAC | 5.63e-04 | 5.93e-01 | 0.3405 |
| 25896 | INTS7 | HTA12-26-1 | Human | Pancreas | PDAC | 1.95e-08 | 5.14e-01 | 0.3728 |
| 25896 | INTS7 | HTA12-29-1 | Human | Pancreas | PDAC | 3.15e-23 | 5.83e-01 | 0.3722 |
| Page: 1 |
| Tissue | Expression Dynamics | Abbreviation |
| Cervix | 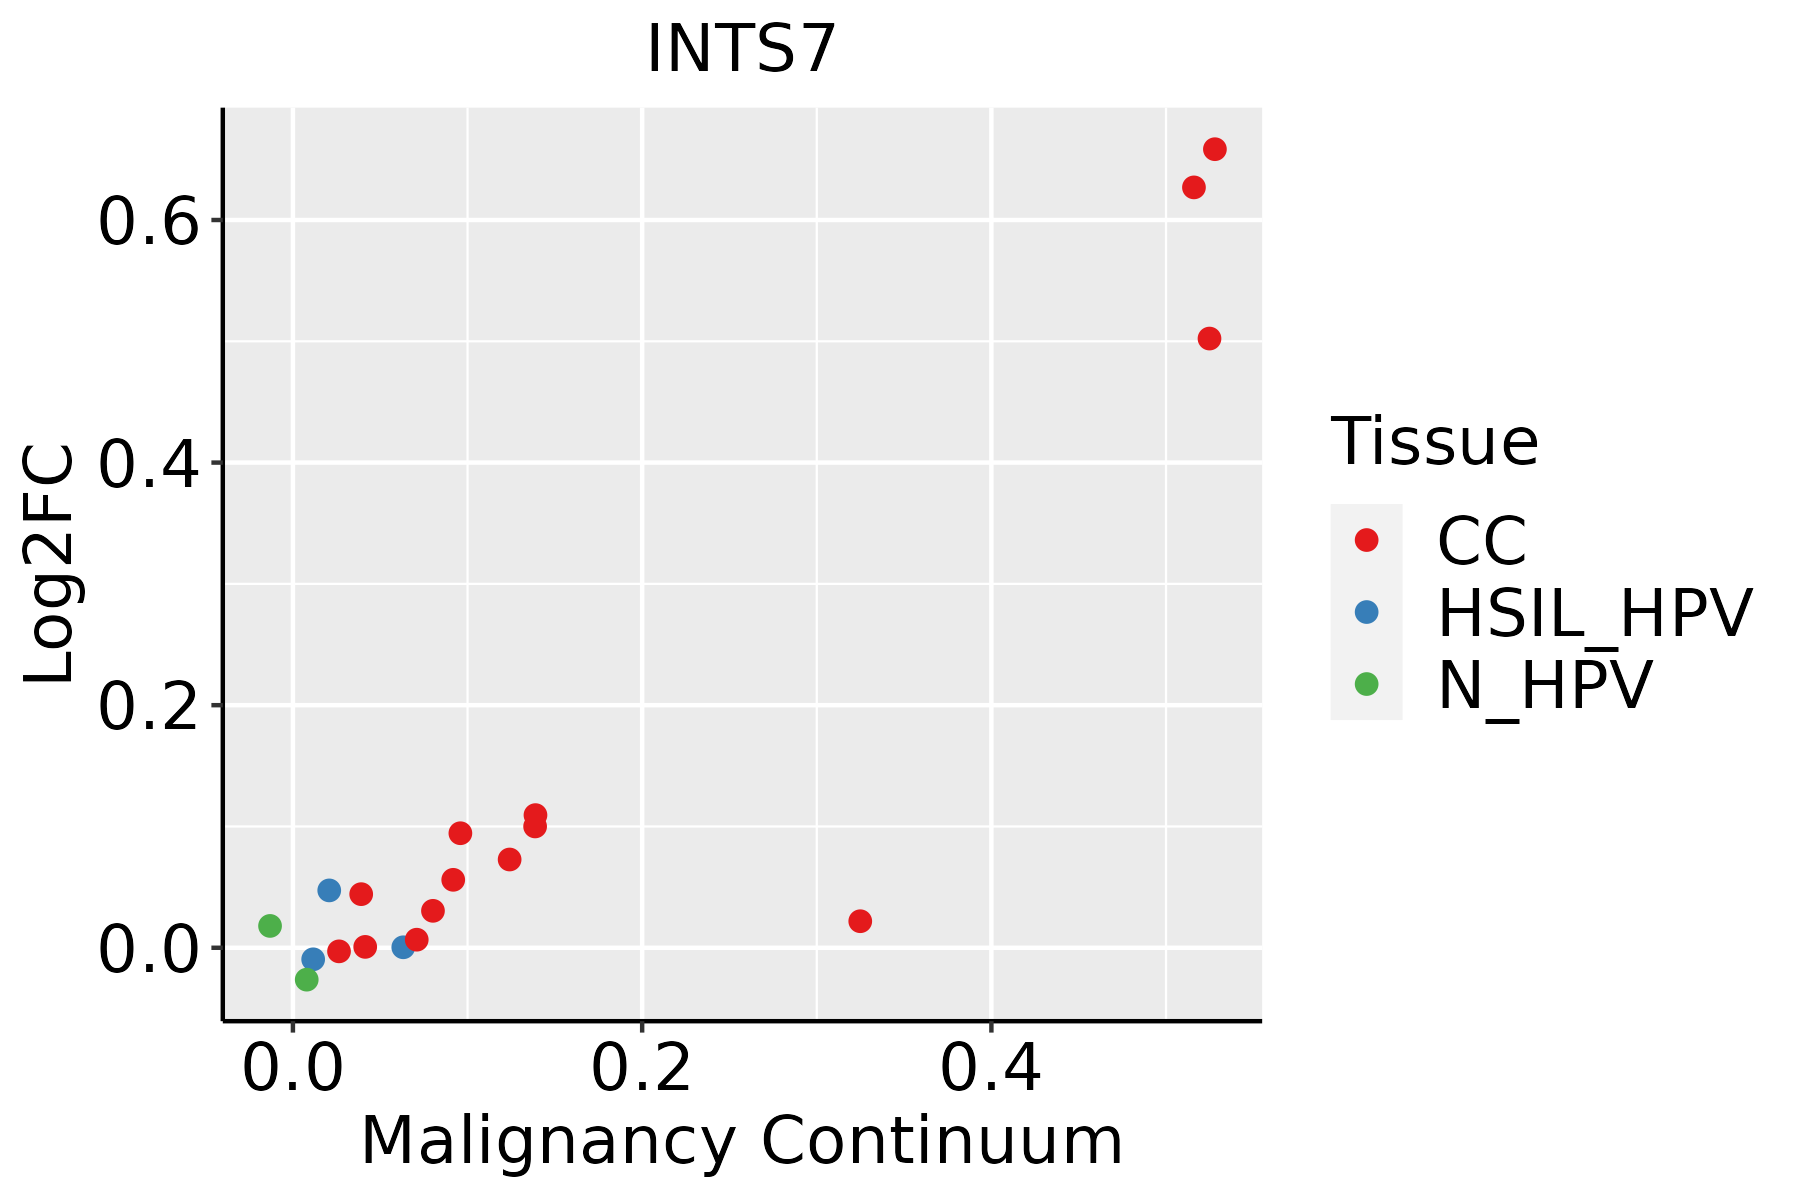 | CC: Cervix cancer |
| HSIL_HPV: HPV-infected high-grade squamous intraepithelial lesions | ||
| N_HPV: HPV-infected normal cervix | ||
| Liver | 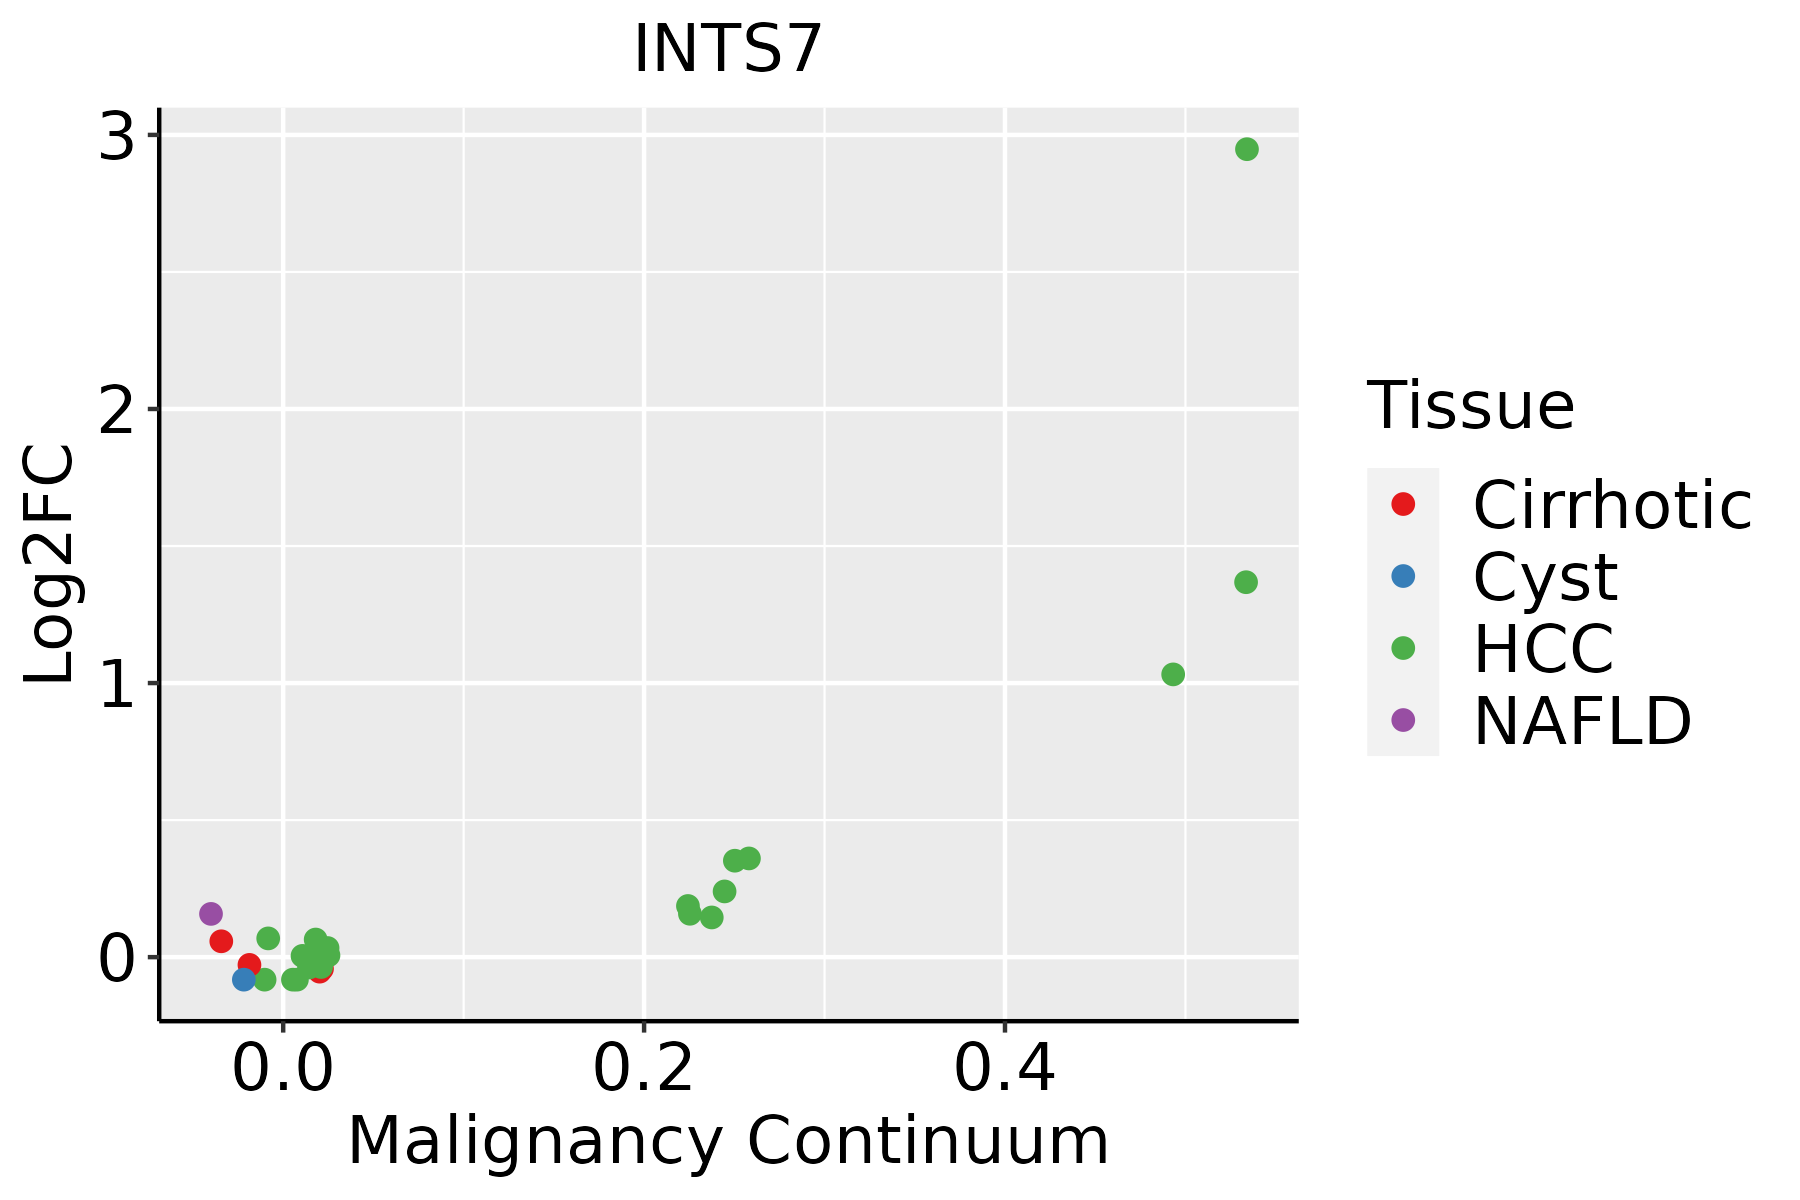 | HCC: Hepatocellular carcinoma |
| NAFLD: Non-alcoholic fatty liver disease |
| ∗log2FC in expression of this searched gene in stem-like cells from each diseased tissue sample relative to stem-like cells in normal samples in each tissue plotted against the malignancy continuum. Samples are colored based on if they are from different disease stage. |
Top |
Malignant transformation related pathway analysis |
| Find out the enriched GO biological processes and KEGG pathways involved in transition from healthy to precancer to cancer |
| Tissue | Disease Stage | Enriched GO biological Processes |
| Colorectum | AD |  |
| Colorectum | SER |  |
| Colorectum | MSS |  |
| Colorectum | MSI-H |  |
| Colorectum | FAP |  |
| ∗Top 15 enriched GO BP terms are showed in the bar plot of each disease state in each tissue. Each row represents a significant GO biological process which is colored according to the -log10(p.adjust). |
| Page: 1 2 3 4 5 6 7 8 9 |
| GO ID | Tissue | Disease Stage | Description | Gene Ratio | Bg Ratio | pvalue | p.adjust | Count |
| GO:00712148 | Cervix | CC | cellular response to abiotic stimulus | 69/2311 | 331/18723 | 7.36e-06 | 1.73e-04 | 69 |
| GO:01040048 | Cervix | CC | cellular response to environmental stimulus | 69/2311 | 331/18723 | 7.36e-06 | 1.73e-04 | 69 |
| GO:00714798 | Cervix | CC | cellular response to ionizing radiation | 22/2311 | 72/18723 | 3.47e-05 | 5.60e-04 | 22 |
| GO:00093149 | Cervix | CC | response to radiation | 86/2311 | 456/18723 | 3.50e-05 | 5.63e-04 | 86 |
| GO:19019873 | Cervix | CC | regulation of cell cycle phase transition | 74/2311 | 390/18723 | 9.80e-05 | 1.27e-03 | 74 |
| GO:00714786 | Cervix | CC | cellular response to radiation | 41/2311 | 186/18723 | 1.41e-04 | 1.71e-03 | 41 |
| GO:00102126 | Cervix | CC | response to ionizing radiation | 34/2311 | 148/18723 | 2.23e-04 | 2.53e-03 | 34 |
| GO:00457862 | Cervix | CC | negative regulation of cell cycle | 67/2311 | 385/18723 | 2.21e-03 | 1.59e-02 | 67 |
| GO:00427705 | Cervix | CC | signal transduction in response to DNA damage | 34/2311 | 172/18723 | 3.52e-03 | 2.27e-02 | 34 |
| GO:00109482 | Cervix | CC | negative regulation of cell cycle process | 51/2311 | 294/18723 | 7.35e-03 | 3.94e-02 | 51 |
| GO:00344702 | Liver | HCC | ncRNA processing | 293/7958 | 395/18723 | 4.26e-38 | 6.76e-35 | 293 |
| GO:00346601 | Liver | HCC | ncRNA metabolic process | 332/7958 | 485/18723 | 1.48e-31 | 7.80e-29 | 332 |
| GO:00311231 | Liver | HCC | RNA 3'-end processing | 81/7958 | 116/18723 | 2.27e-09 | 6.32e-08 | 81 |
| GO:007121421 | Liver | HCC | cellular response to abiotic stimulus | 183/7958 | 331/18723 | 1.59e-06 | 2.26e-05 | 183 |
| GO:010400421 | Liver | HCC | cellular response to environmental stimulus | 183/7958 | 331/18723 | 1.59e-06 | 2.26e-05 | 183 |
| GO:19019871 | Liver | HCC | regulation of cell cycle phase transition | 211/7958 | 390/18723 | 2.11e-06 | 2.89e-05 | 211 |
| GO:00427702 | Liver | HCC | signal transduction in response to DNA damage | 103/7958 | 172/18723 | 3.05e-06 | 4.04e-05 | 103 |
| GO:00000751 | Liver | HCC | cell cycle checkpoint | 100/7958 | 169/18723 | 8.75e-06 | 1.02e-04 | 100 |
| GO:001021221 | Liver | HCC | response to ionizing radiation | 89/7958 | 148/18723 | 1.10e-05 | 1.26e-04 | 89 |
| GO:0045786 | Liver | HCC | negative regulation of cell cycle | 204/7958 | 385/18723 | 1.84e-05 | 1.99e-04 | 204 |
| Page: 1 2 |
| Pathway ID | Tissue | Disease Stage | Description | Gene Ratio | Bg Ratio | pvalue | p.adjust | qvalue | Count |
| Page: 1 |
Top |
Cell-cell communication analysis |
| Identification of potential cell-cell interactions between two cell types and their ligand-receptor pairs for different disease states |
| Ligand | Receptor | LRpair | Pathway | Tissue | Disease Stage |
| Page: 1 |
Top |
Single-cell gene regulatory network inference analysis |
| Find out the significant the regulons (TFs) and the target genes of each regulon across cell types for different disease states |
| TF | Cell Type | Tissue | Disease Stage | Target Gene | RSS | Regulon Activity |
| ∗The dot plots of a searched regulon are shown for all cell subpopulations in each disease state of each tissue based on the regulon specific score inferred using pySCENIC and by calculating the average expression. |
| Page: 1 |
Top |
Somatic mutation of malignant transformation related genes |
| Annotation of somatic variants for genes involved in malignant transformation |
| Hugo Symbol | Variant Class | Variant Classification | dbSNP RS | HGVSc | HGVSp | HGVSp Short | SWISSPROT | BIOTYPE | SIFT | PolyPhen | Tumor Sample Barcode | Tissue | Histology | Sex | Age | Stage | Therapy Types | Drugs | Outcome |
| INTS7 | SNV | Missense_Mutation | novel | c.1171G>A | p.Glu391Lys | p.E391K | Q9NVH2 | protein_coding | deleterious(0) | benign(0.084) | TCGA-MT-A67F-01 | Oral cavity | head & neck squamous cell carcinoma | Female | <65 | I/II | Unknown | Unknown | SD |
| INTS7 | SNV | Missense_Mutation | novel | c.2468N>G | p.Asn823Ser | p.N823S | Q9NVH2 | protein_coding | tolerated(0.81) | benign(0) | TCGA-QK-A6II-01 | Oral cavity | head & neck squamous cell carcinoma | Male | <65 | I/II | Chemotherapy | cisplatin | PD |
| INTS7 | SNV | Missense_Mutation | novel | c.2738C>T | p.Ala913Val | p.A913V | Q9NVH2 | protein_coding | tolerated(0.17) | benign(0.015) | TCGA-XK-AAIW-01 | Prostate | prostate adenocarcinoma | Male | >=65 | 9 | Unknown | Unknown | PD |
| INTS7 | SNV | Missense_Mutation | c.200N>C | p.Lys67Thr | p.K67T | Q9NVH2 | protein_coding | deleterious(0) | possibly_damaging(0.736) | TCGA-BR-4370-01 | Stomach | stomach adenocarcinoma | Female | >=65 | I/II | Unknown | Unknown | SD | |
| INTS7 | SNV | Missense_Mutation | c.1084N>T | p.His362Tyr | p.H362Y | Q9NVH2 | protein_coding | tolerated(0.73) | possibly_damaging(0.542) | TCGA-BR-7901-01 | Stomach | stomach adenocarcinoma | Male | >=65 | I/II | Unknown | Unknown | PD | |
| INTS7 | SNV | Missense_Mutation | rs540765397 | c.1207N>A | p.Pro403Thr | p.P403T | Q9NVH2 | protein_coding | tolerated(0.39) | benign(0.001) | TCGA-VQ-A8P2-01 | Stomach | stomach adenocarcinoma | Male | >=65 | III/IV | Unspecific | Complete Response | |
| INTS7 | SNV | Missense_Mutation | novel | c.421C>T | p.His141Tyr | p.H141Y | Q9NVH2 | protein_coding | deleterious(0.04) | probably_damaging(0.979) | TCGA-ZA-A8F6-01 | Stomach | stomach adenocarcinoma | Male | >=65 | I/II | Unknown | Unknown | SD |
| INTS7 | insertion | Frame_Shift_Ins | novel | c.585_586insGGCAGTTTAAAGA | p.Lys196GlyfsTer16 | p.K196Gfs*16 | Q9NVH2 | protein_coding | TCGA-EL-A3ZM-01 | Thyroid | thyroid carcinoma | Male | <65 | I/II | Unknown | Unknown | SD | ||
| INTS7 | insertion | In_Frame_Ins | novel | c.424_425insCACTTTCCT | p.Ser142delinsThrLeuSerCys | p.S142delinsTLSC | Q9NVH2 | protein_coding | TCGA-FY-A4B0-01 | Thyroid | thyroid carcinoma | Male | >=65 | I/II | Hormone Therapy | synthroid | SD |
| Page: 1 2 3 4 5 6 7 8 9 10 |
Top |
Related drugs of malignant transformation related genes |
| Identification of chemicals and drugs interact with genes involved in malignant transfromation |
| (DGIdb 4.0) |
| Entrez ID | Symbol | Category | Interaction Types | Drug Claim Name | Drug Name | PMIDs |
| Page: 1 |

Copyright 2023-Present -The University of Texas Health Science Center at Houston |