
|
|||||
|
 | |
| |
| |
| |
| |
| |
|
Gene: FCRL5 |
Gene summary for FCRL5 |
| Gene information | Species | Human | Gene symbol | FCRL5 | Gene ID | 83416 |
| Gene name | Fc receptor like 5 | |
| Gene Alias | BXMAS1 | |
| Cytomap | 1q23.1 | |
| Gene Type | protein-coding | GO ID | GO:0007154 | UniProtAcc | Q96RD9 |
Top |
Malignant transformation analysis |
| Identification of the aberrant gene expression in precancerous and cancerous lesions by comparing the gene expression of stem-like cells in diseased tissues with normal stem cells |
| Entrez ID | Symbol | Replicates | Species | Organ | Tissue | Adj P-value | Log2FC | Malignancy |
| 83416 | FCRL5 | GSM5353218_PA_PB1B_Pool_1_2_S74_L003 | Human | Prostate | Tumor | 2.52e-09 | 8.28e-01 | 0.1479 |
| 83416 | FCRL5 | GSM5353220_PA_PB1B_Pool_3_S51_L002 | Human | Prostate | Tumor | 2.22e-03 | 5.26e-01 | 0.1531 |
| 83416 | FCRL5 | GSM5353225_PA_PR5196-1_Pool_1_2_3_S53_L002 | Human | Prostate | Tumor | 3.50e-02 | 4.14e-01 | 0.1619 |
| Page: 1 |
| Tissue | Expression Dynamics | Abbreviation |
| Prostate | 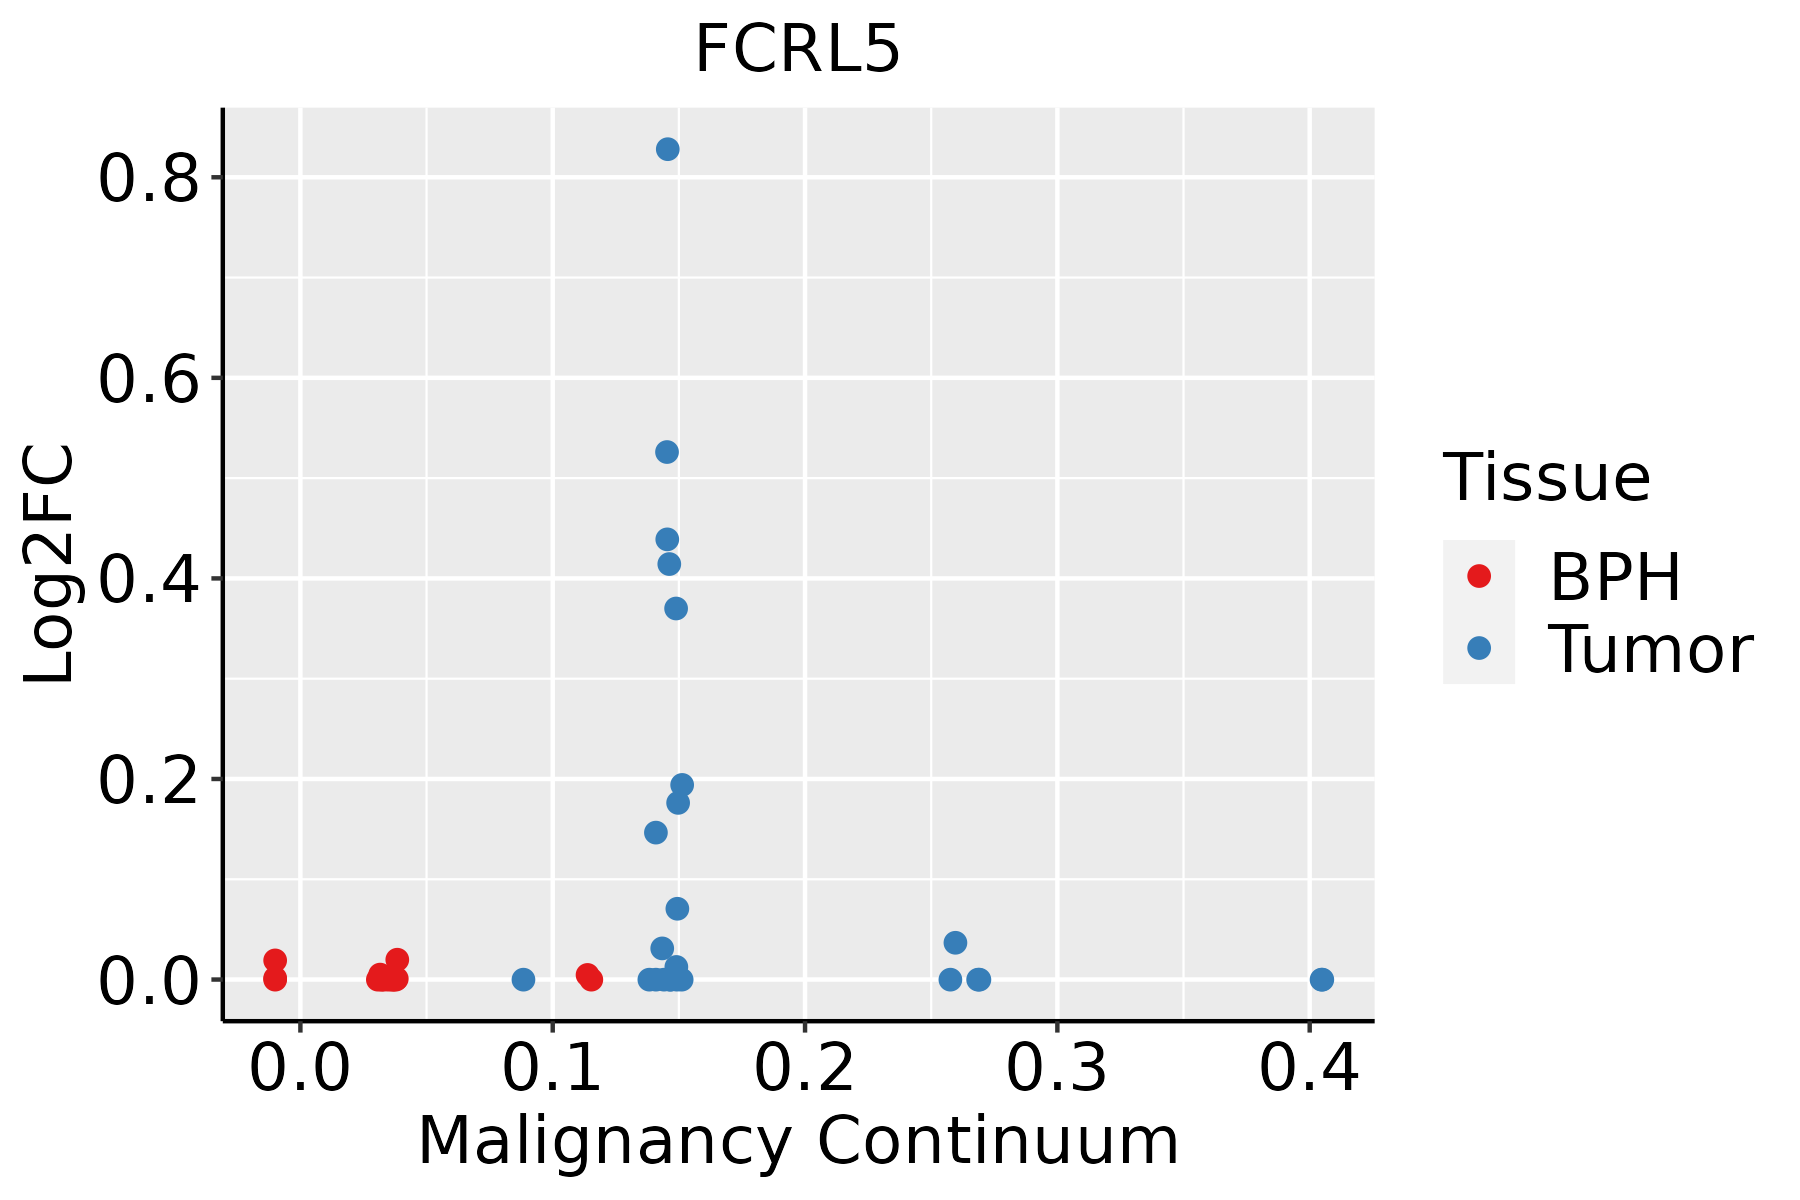 | BPH: Benign Prostatic Hyperplasia |
| ∗log2FC in expression of this searched gene in stem-like cells from each diseased tissue sample relative to stem-like cells in normal samples in each tissue plotted against the malignancy continuum. Samples are colored based on if they are from different disease stage. |
Top |
Malignant transformation related pathway analysis |
| Find out the enriched GO biological processes and KEGG pathways involved in transition from healthy to precancer to cancer |
| Tissue | Disease Stage | Enriched GO biological Processes |
| Colorectum | AD |  |
| Colorectum | SER |  |
| Colorectum | MSS |  |
| Colorectum | MSI-H |  |
| Colorectum | FAP |  |
| ∗Top 15 enriched GO BP terms are showed in the bar plot of each disease state in each tissue. Each row represents a significant GO biological process which is colored according to the -log10(p.adjust). |
| Page: 1 2 3 4 5 6 7 8 9 |
| GO ID | Tissue | Disease Stage | Description | Gene Ratio | Bg Ratio | pvalue | p.adjust | Count |
| Page: 1 |
| Pathway ID | Tissue | Disease Stage | Description | Gene Ratio | Bg Ratio | pvalue | p.adjust | qvalue | Count |
| Page: 1 |
Top |
Cell-cell communication analysis |
| Identification of potential cell-cell interactions between two cell types and their ligand-receptor pairs for different disease states |
| Ligand | Receptor | LRpair | Pathway | Tissue | Disease Stage |
| Page: 1 |
Top |
Single-cell gene regulatory network inference analysis |
| Find out the significant the regulons (TFs) and the target genes of each regulon across cell types for different disease states |
| TF | Cell Type | Tissue | Disease Stage | Target Gene | RSS | Regulon Activity |
| ∗The dot plots of a searched regulon are shown for all cell subpopulations in each disease state of each tissue based on the regulon specific score inferred using pySCENIC and by calculating the average expression. |
| Page: 1 |
Top |
Somatic mutation of malignant transformation related genes |
| Annotation of somatic variants for genes involved in malignant transformation |
| Hugo Symbol | Variant Class | Variant Classification | dbSNP RS | HGVSc | HGVSp | HGVSp Short | SWISSPROT | BIOTYPE | SIFT | PolyPhen | Tumor Sample Barcode | Tissue | Histology | Sex | Age | Stage | Therapy Types | Drugs | Outcome |
| FCRL5 | SNV | Missense_Mutation | c.1982N>A | p.Leu661His | p.L661H | Q96RD9 | protein_coding | deleterious(0) | probably_damaging(0.995) | TCGA-DD-A4NI-01 | Liver | liver hepatocellular carcinoma | Male | >=65 | I/II | Unknown | Unknown | SD | |
| FCRL5 | SNV | Missense_Mutation | novel | c.1230C>G | p.Ile410Met | p.I410M | Q96RD9 | protein_coding | deleterious(0) | probably_damaging(0.997) | TCGA-DD-AACD-01 | Liver | liver hepatocellular carcinoma | Male | <65 | I/II | Unknown | Unknown | PD |
| FCRL5 | SNV | Missense_Mutation | novel | c.560A>G | p.Glu187Gly | p.E187G | Q96RD9 | protein_coding | deleterious(0.02) | probably_damaging(0.937) | TCGA-G3-A3CG-01 | Liver | liver hepatocellular carcinoma | Male | >=65 | I/II | Targeted Molecular therapy | sorafenib | SD |
| FCRL5 | SNV | Missense_Mutation | novel | c.2771N>G | p.Tyr924Cys | p.Y924C | Q96RD9 | protein_coding | deleterious(0) | probably_damaging(0.997) | TCGA-NI-A8LF-01 | Liver | liver hepatocellular carcinoma | Male | >=65 | I/II | Unknown | Unknown | SD |
| FCRL5 | SNV | Missense_Mutation | c.136N>A | p.Gly46Arg | p.G46R | Q96RD9 | protein_coding | tolerated(0.07) | benign(0.158) | TCGA-RG-A7D4-01 | Liver | liver hepatocellular carcinoma | Male | >=65 | I/II | Unknown | Unknown | SD | |
| FCRL5 | SNV | Missense_Mutation | c.2692N>T | p.Thr898Ser | p.T898S | Q96RD9 | protein_coding | deleterious(0.01) | benign(0.14) | TCGA-UB-A7MB-01 | Liver | liver hepatocellular carcinoma | Male | <65 | I/II | Targeted Molecular therapy | sorafenib | PD | |
| FCRL5 | SNV | Missense_Mutation | c.737N>T | p.Gln246Leu | p.Q246L | Q96RD9 | protein_coding | tolerated(0.22) | possibly_damaging(0.814) | TCGA-UB-A7MB-01 | Liver | liver hepatocellular carcinoma | Male | <65 | I/II | Targeted Molecular therapy | sorafenib | PD | |
| FCRL5 | SNV | Missense_Mutation | c.1357G>T | p.Gly453Cys | p.G453C | Q96RD9 | protein_coding | deleterious(0) | probably_damaging(1) | TCGA-05-4382-01 | Lung | lung adenocarcinoma | Male | >=65 | I/II | Unknown | Unknown | PD | |
| FCRL5 | SNV | Missense_Mutation | c.1149N>A | p.Asn383Lys | p.N383K | Q96RD9 | protein_coding | deleterious(0.01) | benign(0.006) | TCGA-05-4389-01 | Lung | lung adenocarcinoma | Male | >=65 | I/II | Unknown | Unknown | SD | |
| FCRL5 | SNV | Missense_Mutation | c.2888C>A | p.Pro963Gln | p.P963Q | Q96RD9 | protein_coding | deleterious(0.03) | possibly_damaging(0.452) | TCGA-05-4432-01 | Lung | lung adenocarcinoma | Male | >=65 | I/II | Chemotherapy | cisplatin | CR |
| Page: 1 2 3 4 5 6 7 8 9 10 11 12 13 14 15 16 17 18 |
Top |
Related drugs of malignant transformation related genes |
| Identification of chemicals and drugs interact with genes involved in malignant transfromation |
| (DGIdb 4.0) |
| Entrez ID | Symbol | Category | Interaction Types | Drug Claim Name | Drug Name | PMIDs |
| Page: 1 |

Copyright 2023-Present -The University of Texas Health Science Center at Houston |