
|
|||||
|
 | |
| |
| |
| |
| |
| |
|
Gene: ACAP2 |
Gene summary for ACAP2 |
| Gene information | Species | Human | Gene symbol | ACAP2 | Gene ID | 23527 |
| Gene name | ArfGAP with coiled-coil, ankyrin repeat and PH domains 2 | |
| Gene Alias | CENTB2 | |
| Cytomap | 3q29 | |
| Gene Type | protein-coding | GO ID | GO:0006810 | UniProtAcc | Q15057 |
Top |
Malignant transformation analysis |
| Identification of the aberrant gene expression in precancerous and cancerous lesions by comparing the gene expression of stem-like cells in diseased tissues with normal stem cells |
| Entrez ID | Symbol | Replicates | Species | Organ | Tissue | Adj P-value | Log2FC | Malignancy |
| 23527 | ACAP2 | N_HPV_2 | Human | Cervix | N_HPV | 1.53e-03 | 2.19e-01 | -0.0131 |
| 23527 | ACAP2 | CCI_1 | Human | Cervix | CC | 1.17e-03 | 1.24e+00 | 0.528 |
| 23527 | ACAP2 | CCI_2 | Human | Cervix | CC | 4.86e-17 | 1.97e+00 | 0.5249 |
| 23527 | ACAP2 | CCI_3 | Human | Cervix | CC | 7.34e-11 | 1.30e+00 | 0.516 |
| 23527 | ACAP2 | sample3 | Human | Cervix | CC | 2.50e-05 | 1.78e-01 | 0.1387 |
| 23527 | ACAP2 | HTA11_3410_2000001011 | Human | Colorectum | AD | 8.37e-09 | -4.19e-01 | 0.0155 |
| 23527 | ACAP2 | HTA11_866_3004761011 | Human | Colorectum | AD | 1.13e-04 | -4.57e-01 | 0.096 |
| 23527 | ACAP2 | HTA11_7696_3000711011 | Human | Colorectum | AD | 5.10e-10 | -4.18e-01 | 0.0674 |
| 23527 | ACAP2 | HTA11_99999970781_79442 | Human | Colorectum | MSS | 2.45e-14 | -3.25e-01 | 0.294 |
| 23527 | ACAP2 | HTA11_99999973899_84307 | Human | Colorectum | MSS | 2.26e-02 | -4.36e-01 | 0.2585 |
| 23527 | ACAP2 | HTA11_99999974143_84620 | Human | Colorectum | MSS | 1.48e-05 | -3.83e-01 | 0.3005 |
| 23527 | ACAP2 | A002-C-010 | Human | Colorectum | FAP | 5.66e-03 | -1.65e-01 | 0.242 |
| 23527 | ACAP2 | A001-C-207 | Human | Colorectum | FAP | 1.32e-06 | -3.47e-01 | 0.1278 |
| 23527 | ACAP2 | A015-C-203 | Human | Colorectum | FAP | 7.07e-34 | -5.34e-01 | -0.1294 |
| 23527 | ACAP2 | A015-C-204 | Human | Colorectum | FAP | 4.01e-07 | -3.98e-01 | -0.0228 |
| 23527 | ACAP2 | A014-C-040 | Human | Colorectum | FAP | 6.70e-06 | -4.17e-01 | -0.1184 |
| 23527 | ACAP2 | A002-C-201 | Human | Colorectum | FAP | 5.34e-17 | -4.61e-01 | 0.0324 |
| 23527 | ACAP2 | A002-C-203 | Human | Colorectum | FAP | 6.51e-07 | -1.74e-01 | 0.2786 |
| 23527 | ACAP2 | A001-C-119 | Human | Colorectum | FAP | 5.13e-06 | -3.99e-01 | -0.1557 |
| 23527 | ACAP2 | A001-C-108 | Human | Colorectum | FAP | 1.60e-23 | -3.96e-01 | -0.0272 |
| Page: 1 2 3 4 5 6 7 8 9 10 |
| Tissue | Expression Dynamics | Abbreviation |
| Cervix | 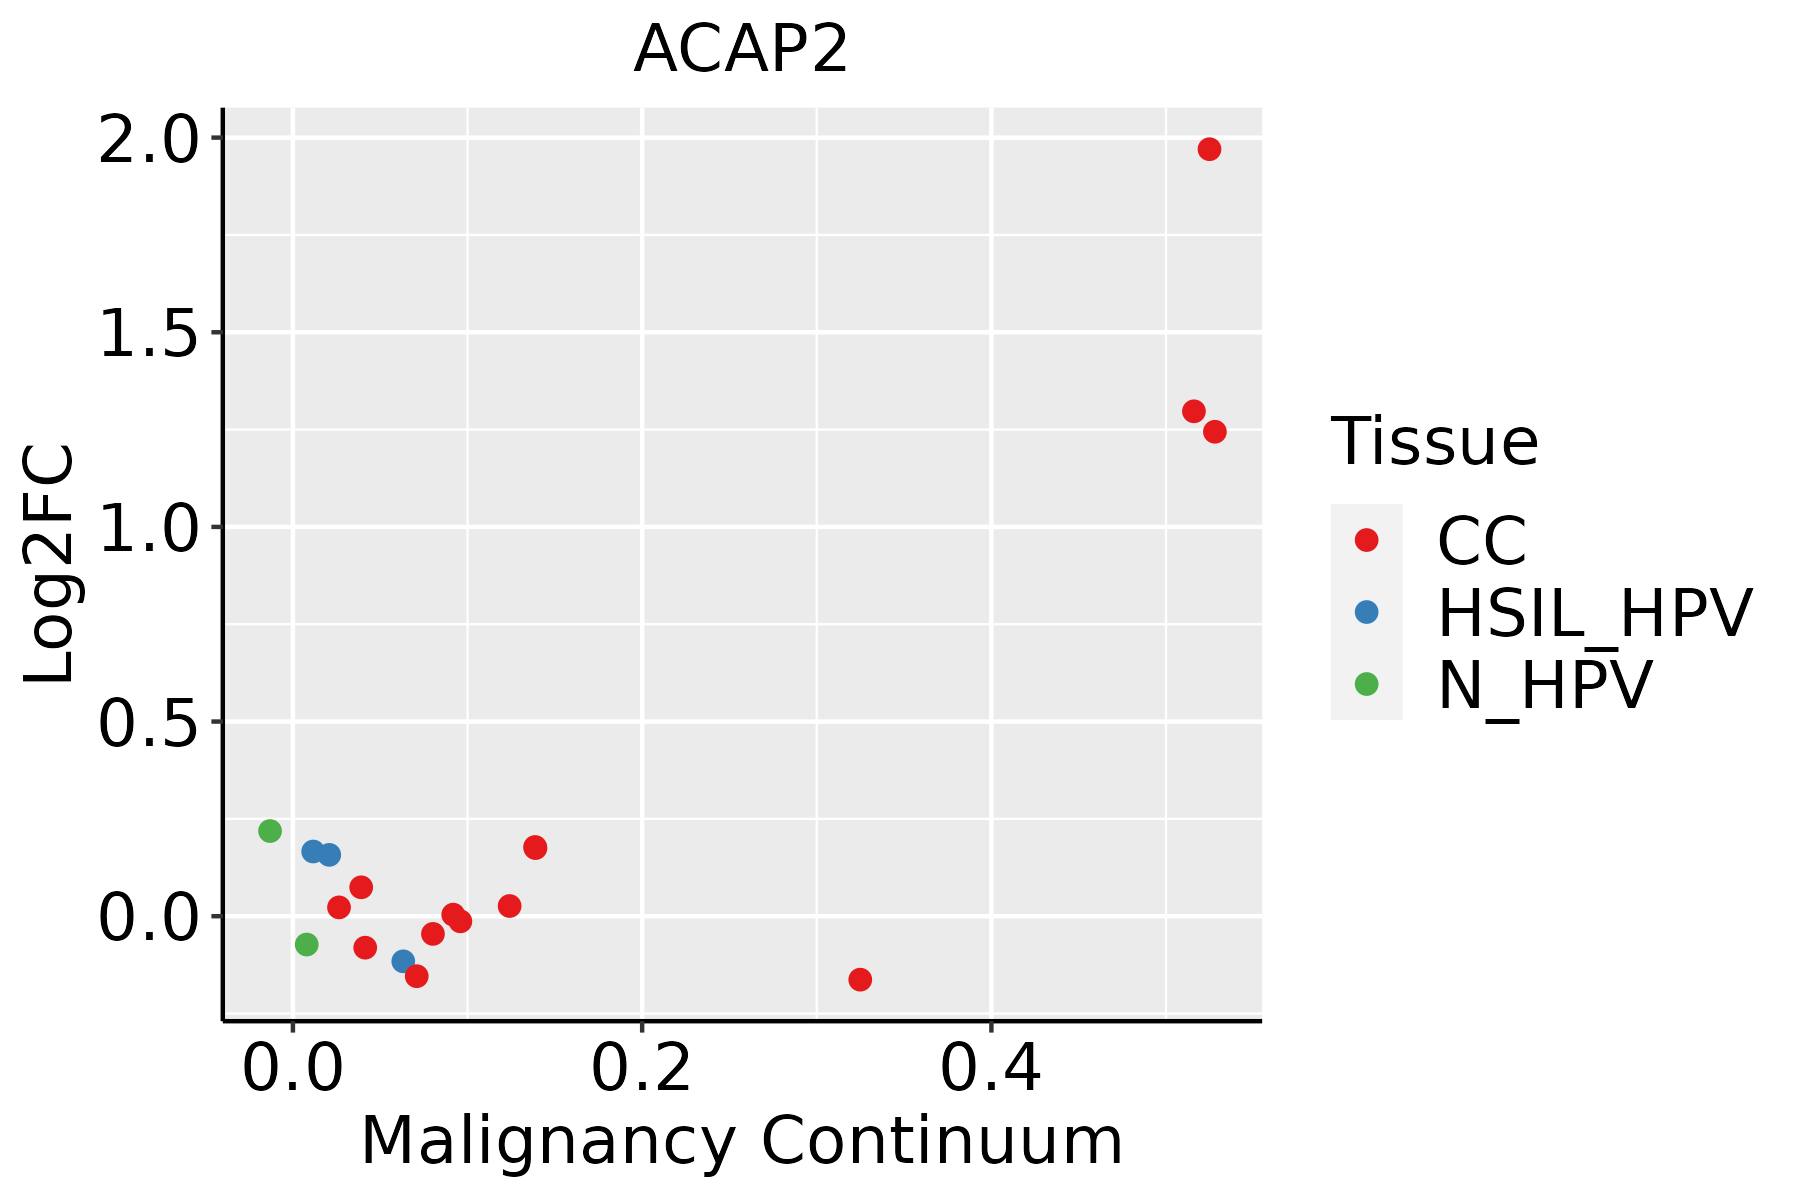 | CC: Cervix cancer |
| HSIL_HPV: HPV-infected high-grade squamous intraepithelial lesions | ||
| N_HPV: HPV-infected normal cervix | ||
| Colorectum (GSE201348) | 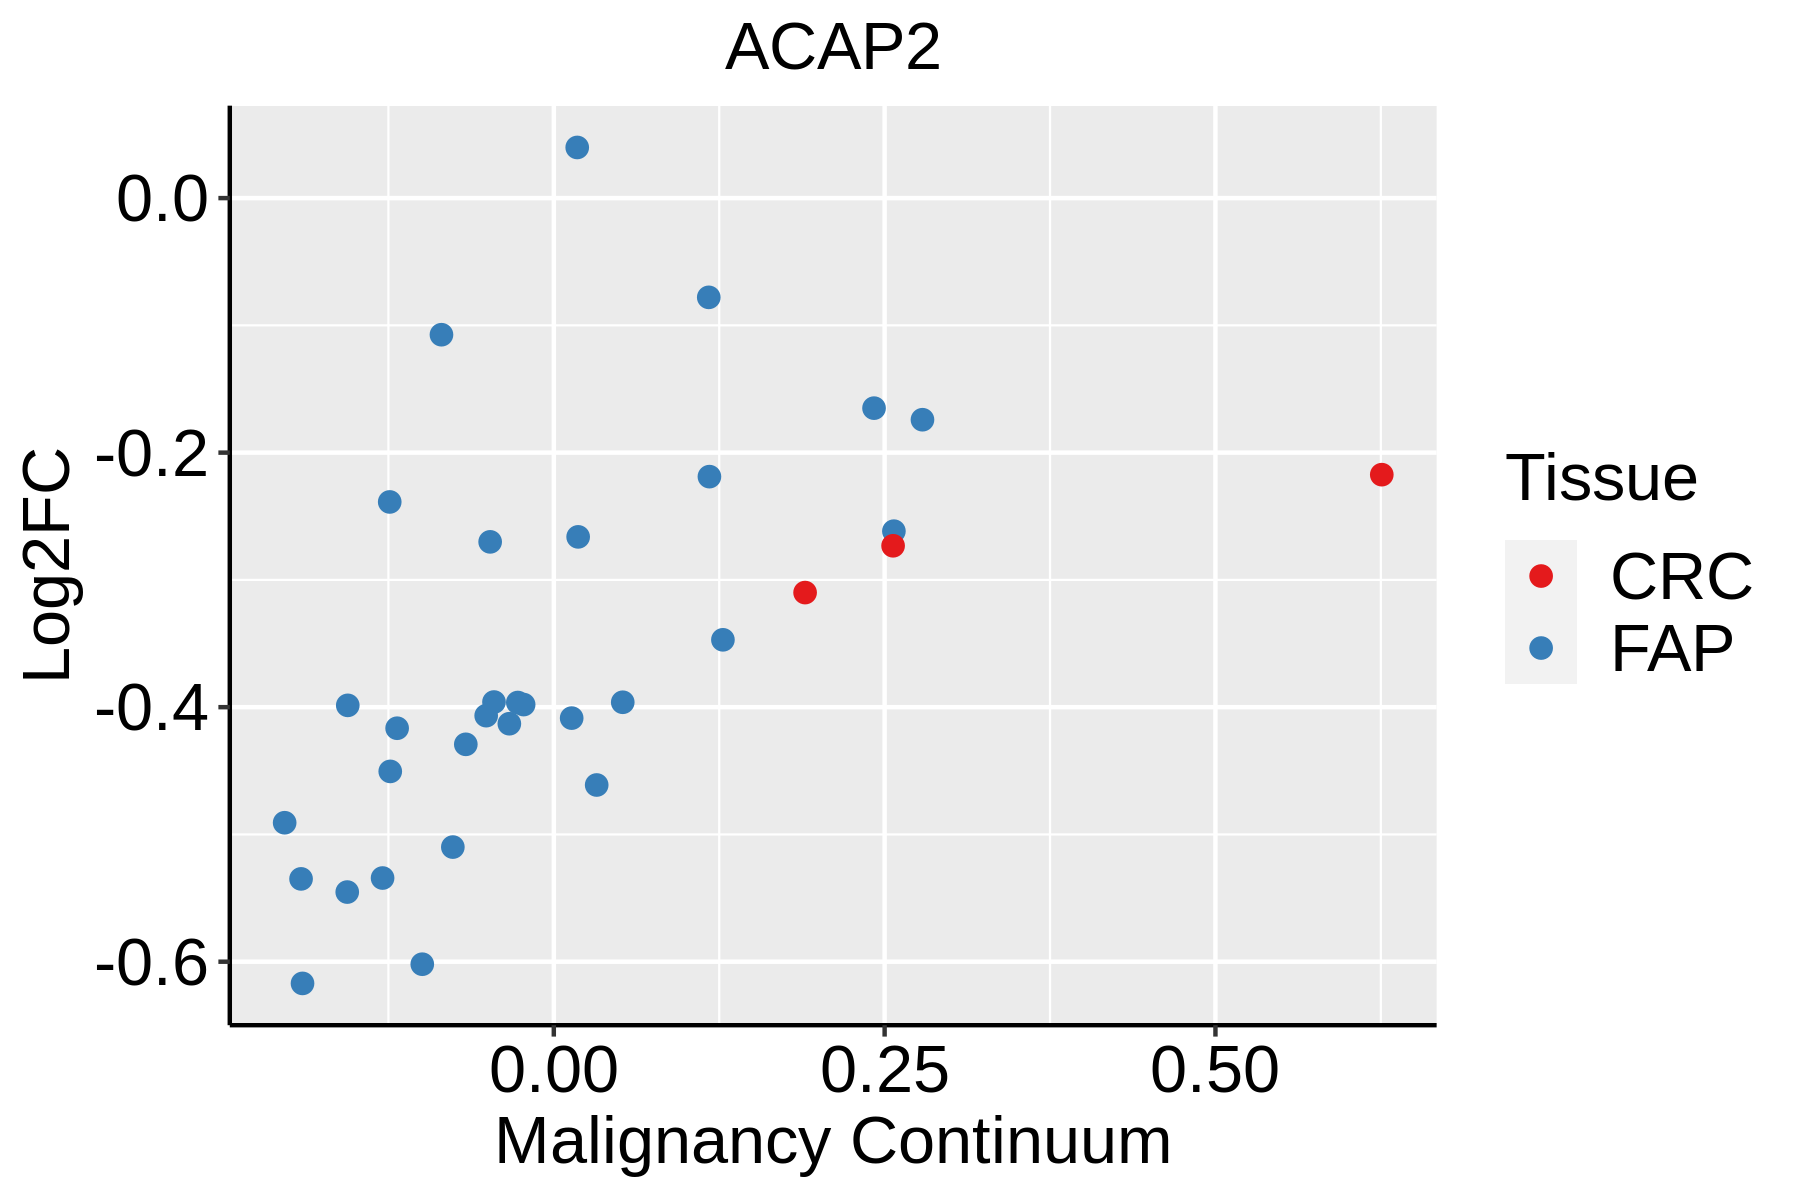 | FAP: Familial adenomatous polyposis |
| CRC: Colorectal cancer | ||
| Colorectum (HTA11) |  | AD: Adenomas |
| SER: Sessile serrated lesions | ||
| MSI-H: Microsatellite-high colorectal cancer | ||
| MSS: Microsatellite stable colorectal cancer | ||
| Esophagus | 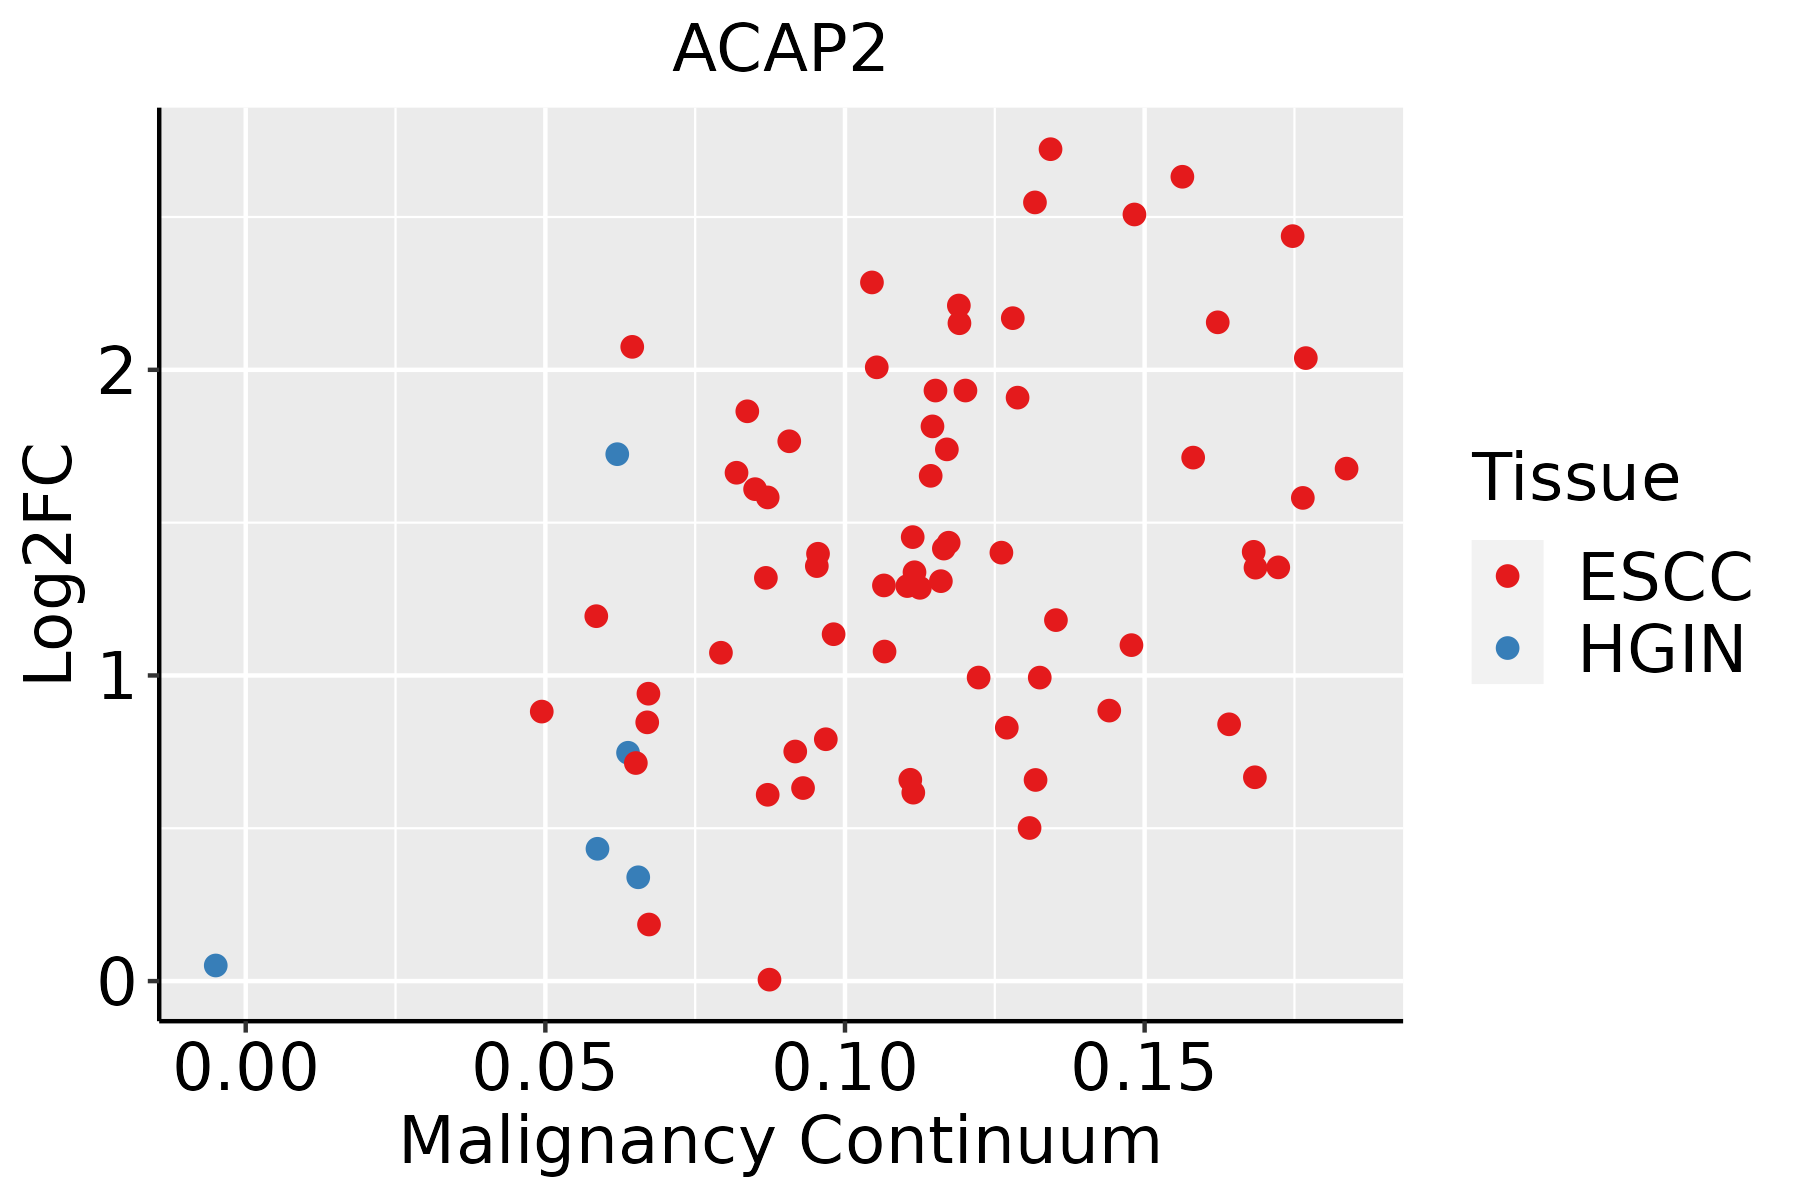 | ESCC: Esophageal squamous cell carcinoma |
| HGIN: High-grade intraepithelial neoplasias | ||
| LGIN: Low-grade intraepithelial neoplasias | ||
| Liver | 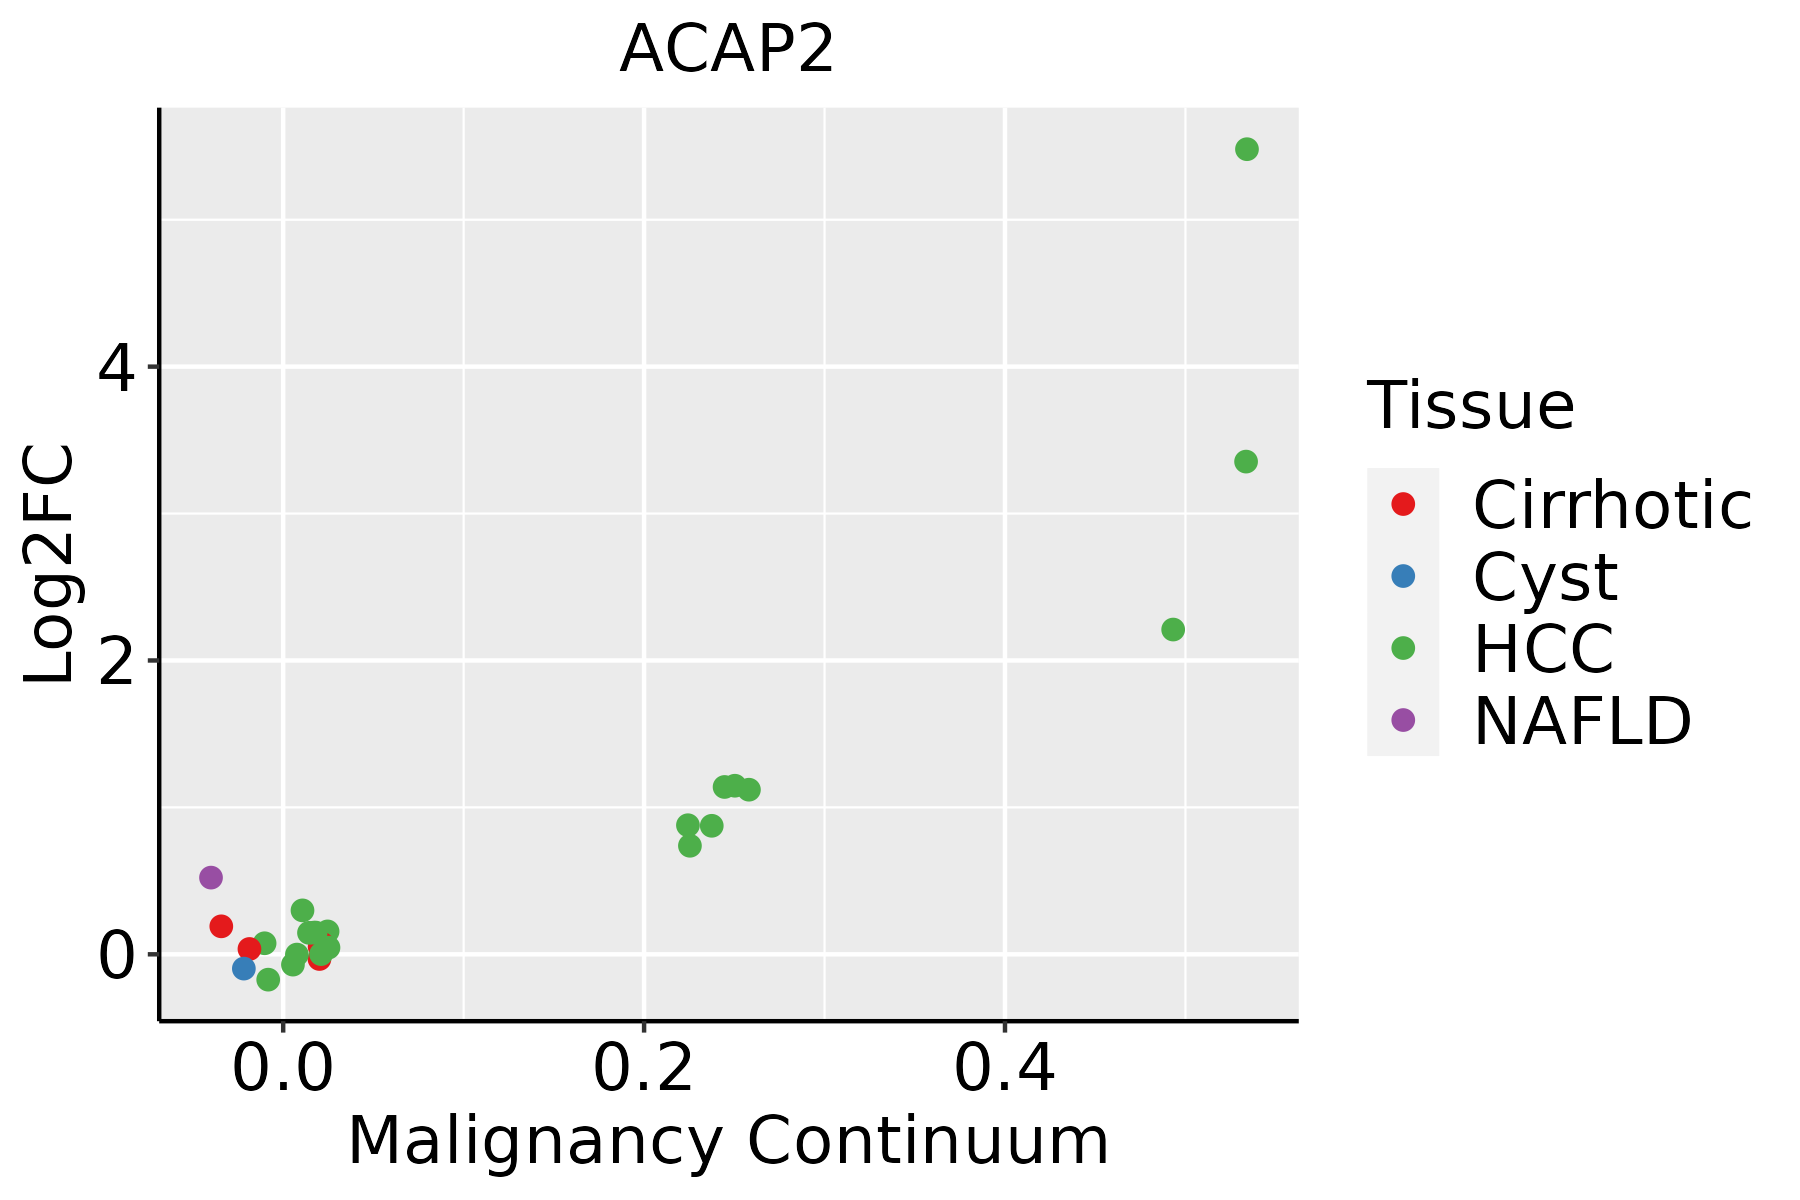 | HCC: Hepatocellular carcinoma |
| NAFLD: Non-alcoholic fatty liver disease | ||
| Lung |  | AAH: Atypical adenomatous hyperplasia |
| AIS: Adenocarcinoma in situ | ||
| IAC: Invasive lung adenocarcinoma | ||
| MIA: Minimally invasive adenocarcinoma | ||
| Oral Cavity | 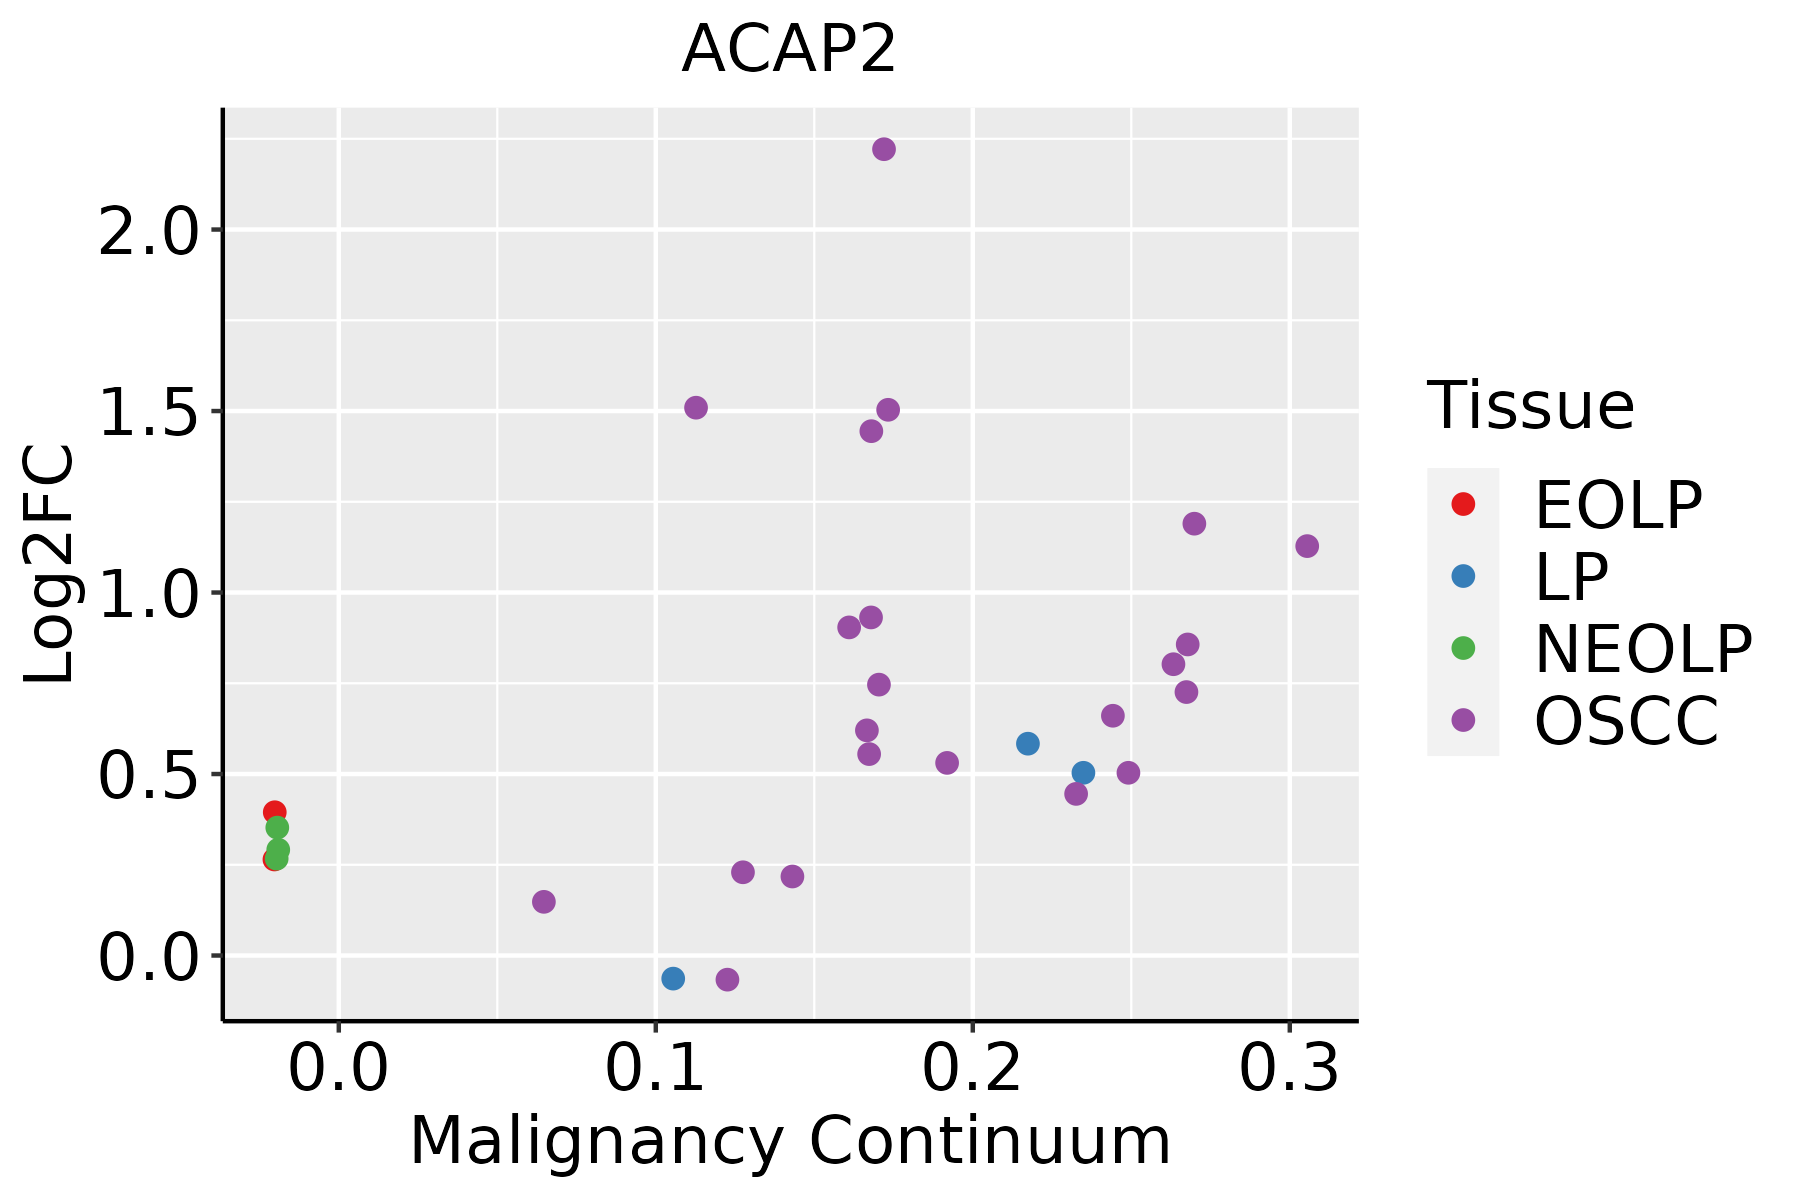 | EOLP: Erosive Oral lichen planus |
| LP: leukoplakia | ||
| NEOLP: Non-erosive oral lichen planus | ||
| OSCC: Oral squamous cell carcinoma | ||
| Skin | 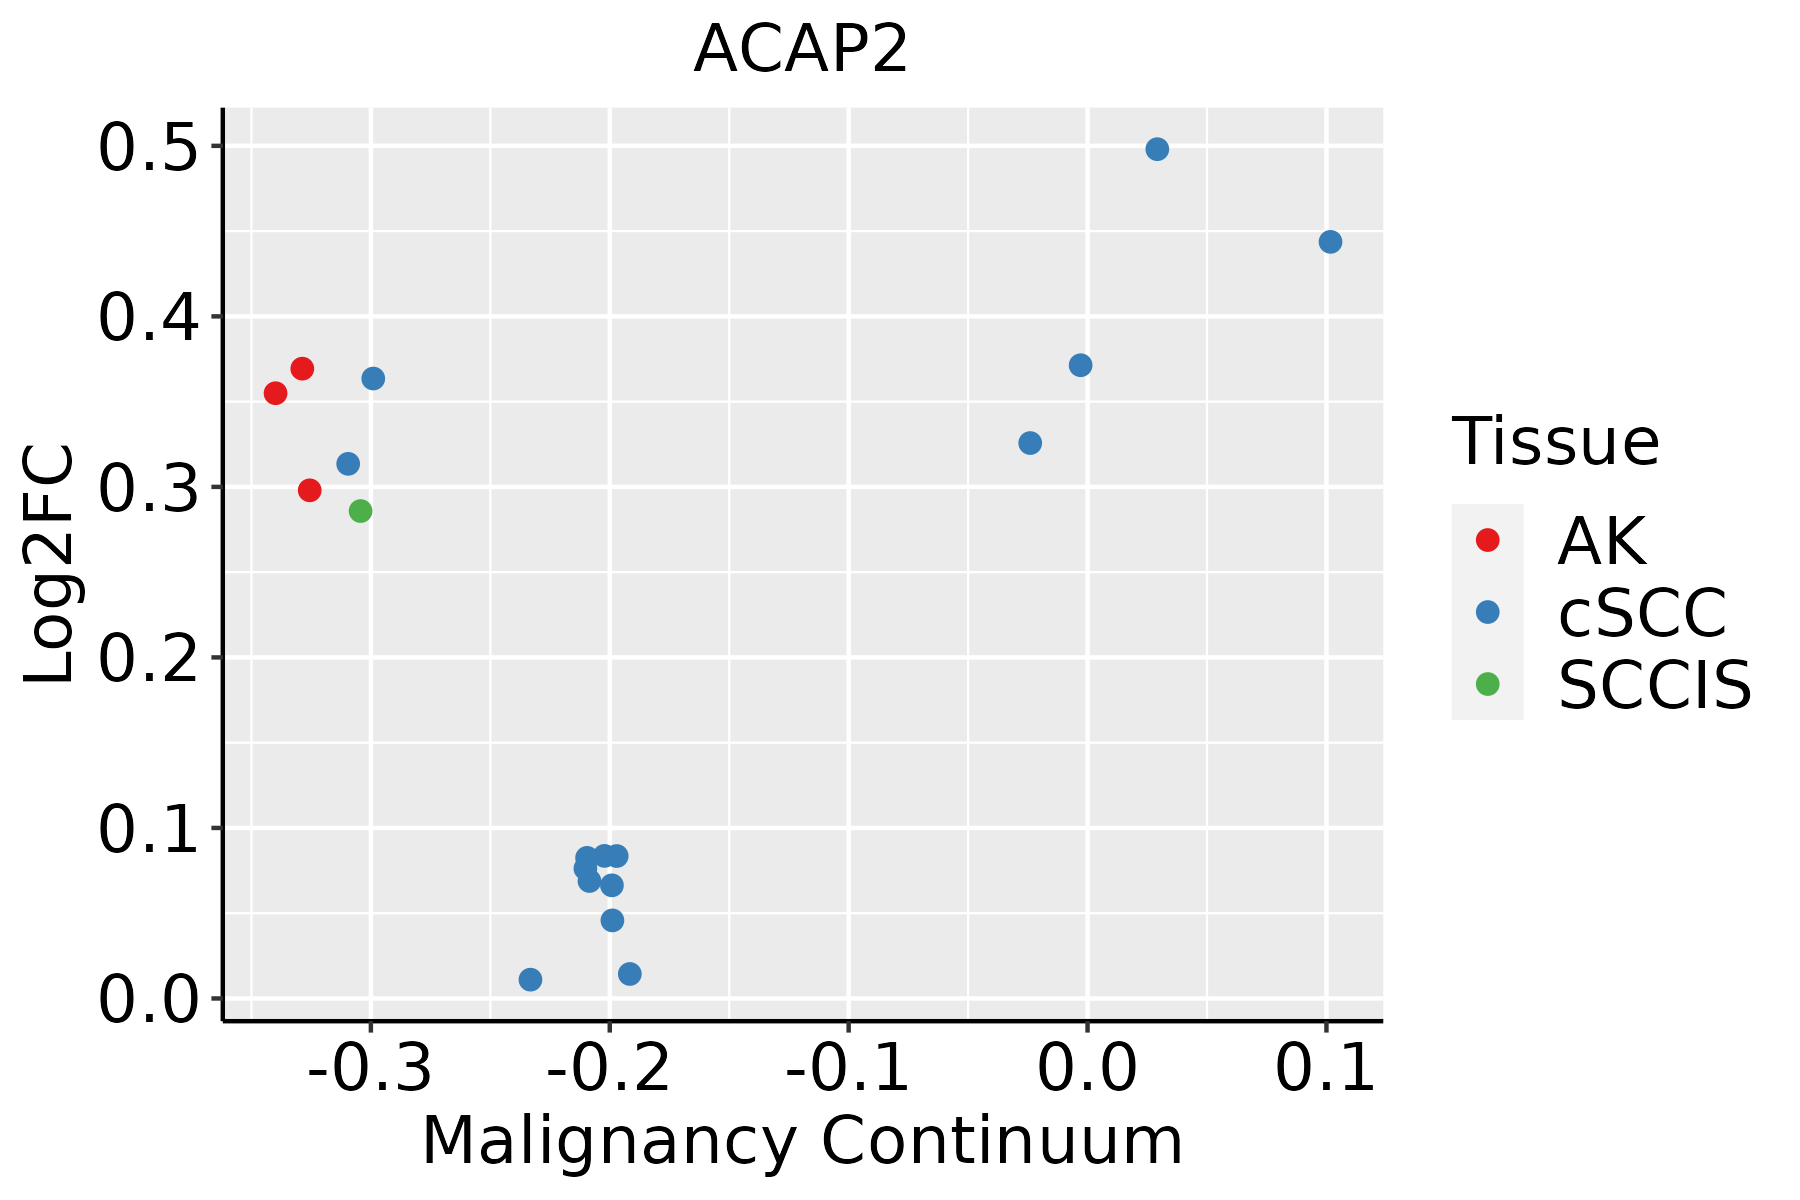 | AK: Actinic keratosis |
| cSCC: Cutaneous squamous cell carcinoma | ||
| SCCIS:squamous cell carcinoma in situ | ||
| Thyroid |  | ATC: Anaplastic thyroid cancer |
| HT: Hashimoto's thyroiditis | ||
| PTC: Papillary thyroid cancer |
| ∗log2FC in expression of this searched gene in stem-like cells from each diseased tissue sample relative to stem-like cells in normal samples in each tissue plotted against the malignancy continuum. Samples are colored based on if they are from different disease stage. |
Top |
Malignant transformation related pathway analysis |
| Find out the enriched GO biological processes and KEGG pathways involved in transition from healthy to precancer to cancer |
| Tissue | Disease Stage | Enriched GO biological Processes |
| Colorectum | AD |  |
| Colorectum | SER |  |
| Colorectum | MSS |  |
| Colorectum | MSI-H |  |
| Colorectum | FAP |  |
| ∗Top 15 enriched GO BP terms are showed in the bar plot of each disease state in each tissue. Each row represents a significant GO biological process which is colored according to the -log10(p.adjust). |
| Page: 1 2 3 4 5 6 7 8 9 |
| GO ID | Tissue | Disease Stage | Description | Gene Ratio | Bg Ratio | pvalue | p.adjust | Count |
| GO:00988767 | Cervix | CC | vesicle-mediated transport to the plasma membrane | 34/2311 | 136/18723 | 3.75e-05 | 5.91e-04 | 34 |
| GO:00161977 | Cervix | CC | endosomal transport | 48/2311 | 230/18723 | 1.65e-04 | 1.97e-03 | 48 |
| GO:19900909 | Cervix | CC | cellular response to nerve growth factor stimulus | 14/2311 | 53/18723 | 4.09e-03 | 2.54e-02 | 14 |
| GO:19900897 | Cervix | CC | response to nerve growth factor | 14/2311 | 56/18723 | 6.93e-03 | 3.74e-02 | 14 |
| GO:199009012 | Cervix | N_HPV | cellular response to nerve growth factor stimulus | 6/534 | 53/18723 | 3.86e-03 | 3.05e-02 | 6 |
| GO:199008913 | Cervix | N_HPV | response to nerve growth factor | 6/534 | 56/18723 | 5.08e-03 | 3.73e-02 | 6 |
| GO:0016197 | Colorectum | AD | endosomal transport | 90/3918 | 230/18723 | 1.88e-10 | 1.73e-08 | 90 |
| GO:0098876 | Colorectum | AD | vesicle-mediated transport to the plasma membrane | 57/3918 | 136/18723 | 2.30e-08 | 1.27e-06 | 57 |
| GO:1990090 | Colorectum | AD | cellular response to nerve growth factor stimulus | 26/3918 | 53/18723 | 4.87e-06 | 1.28e-04 | 26 |
| GO:1990089 | Colorectum | AD | response to nerve growth factor | 26/3918 | 56/18723 | 1.71e-05 | 3.59e-04 | 26 |
| GO:0032456 | Colorectum | AD | endocytic recycling | 28/3918 | 73/18723 | 4.87e-04 | 5.30e-03 | 28 |
| GO:00988762 | Colorectum | MSS | vesicle-mediated transport to the plasma membrane | 54/3467 | 136/18723 | 6.20e-09 | 3.95e-07 | 54 |
| GO:00161972 | Colorectum | MSS | endosomal transport | 79/3467 | 230/18723 | 7.04e-09 | 4.39e-07 | 79 |
| GO:19900902 | Colorectum | MSS | cellular response to nerve growth factor stimulus | 23/3467 | 53/18723 | 2.56e-05 | 5.31e-04 | 23 |
| GO:19900892 | Colorectum | MSS | response to nerve growth factor | 23/3467 | 56/18723 | 7.34e-05 | 1.23e-03 | 23 |
| GO:00324561 | Colorectum | MSS | endocytic recycling | 26/3467 | 73/18723 | 4.05e-04 | 4.99e-03 | 26 |
| GO:00988763 | Colorectum | FAP | vesicle-mediated transport to the plasma membrane | 42/2622 | 136/18723 | 3.16e-07 | 1.78e-05 | 42 |
| GO:00161973 | Colorectum | FAP | endosomal transport | 56/2622 | 230/18723 | 1.79e-05 | 4.53e-04 | 56 |
| GO:19900904 | Colorectum | FAP | cellular response to nerve growth factor stimulus | 17/2622 | 53/18723 | 6.20e-04 | 6.82e-03 | 17 |
| GO:19900893 | Colorectum | FAP | response to nerve growth factor | 17/2622 | 56/18723 | 1.24e-03 | 1.16e-02 | 17 |
| Page: 1 2 3 4 |
| Pathway ID | Tissue | Disease Stage | Description | Gene Ratio | Bg Ratio | pvalue | p.adjust | qvalue | Count |
| hsa0414418 | Cervix | CC | Endocytosis | 64/1267 | 251/8465 | 6.97e-06 | 6.10e-05 | 3.61e-05 | 64 |
| hsa0414419 | Cervix | CC | Endocytosis | 64/1267 | 251/8465 | 6.97e-06 | 6.10e-05 | 3.61e-05 | 64 |
| hsa041446 | Colorectum | FAP | Endocytosis | 78/1404 | 251/8465 | 6.20e-09 | 2.96e-07 | 1.80e-07 | 78 |
| hsa041447 | Colorectum | FAP | Endocytosis | 78/1404 | 251/8465 | 6.20e-09 | 2.96e-07 | 1.80e-07 | 78 |
| hsa041448 | Colorectum | CRC | Endocytosis | 65/1091 | 251/8465 | 1.27e-08 | 1.06e-06 | 7.19e-07 | 65 |
| hsa041449 | Colorectum | CRC | Endocytosis | 65/1091 | 251/8465 | 1.27e-08 | 1.06e-06 | 7.19e-07 | 65 |
| hsa0414429 | Esophagus | HGIN | Endocytosis | 76/1383 | 251/8465 | 1.74e-08 | 3.34e-07 | 2.65e-07 | 76 |
| hsa04144113 | Esophagus | HGIN | Endocytosis | 76/1383 | 251/8465 | 1.74e-08 | 3.34e-07 | 2.65e-07 | 76 |
| hsa0414422 | Liver | HCC | Endocytosis | 178/4020 | 251/8465 | 2.03e-14 | 5.22e-13 | 2.91e-13 | 178 |
| hsa0414432 | Liver | HCC | Endocytosis | 178/4020 | 251/8465 | 2.03e-14 | 5.22e-13 | 2.91e-13 | 178 |
| hsa0414414 | Lung | IAC | Endocytosis | 51/1053 | 251/8465 | 2.25e-04 | 2.54e-03 | 1.68e-03 | 51 |
| hsa0414415 | Lung | IAC | Endocytosis | 51/1053 | 251/8465 | 2.25e-04 | 2.54e-03 | 1.68e-03 | 51 |
| hsa0414423 | Lung | AIS | Endocytosis | 52/961 | 251/8465 | 9.74e-06 | 3.04e-04 | 1.95e-04 | 52 |
| hsa0414433 | Lung | AIS | Endocytosis | 52/961 | 251/8465 | 9.74e-06 | 3.04e-04 | 1.95e-04 | 52 |
| hsa0414427 | Oral cavity | OSCC | Endocytosis | 174/3704 | 251/8465 | 9.42e-17 | 4.51e-15 | 2.29e-15 | 174 |
| hsa04144112 | Oral cavity | OSCC | Endocytosis | 174/3704 | 251/8465 | 9.42e-17 | 4.51e-15 | 2.29e-15 | 174 |
| hsa0414442 | Oral cavity | EOLP | Endocytosis | 71/1218 | 251/8465 | 5.28e-09 | 8.97e-08 | 5.29e-08 | 71 |
| hsa0414452 | Oral cavity | EOLP | Endocytosis | 71/1218 | 251/8465 | 5.28e-09 | 8.97e-08 | 5.29e-08 | 71 |
| hsa0414461 | Oral cavity | NEOLP | Endocytosis | 62/1112 | 251/8465 | 3.56e-07 | 4.92e-06 | 3.09e-06 | 62 |
| hsa0414471 | Oral cavity | NEOLP | Endocytosis | 62/1112 | 251/8465 | 3.56e-07 | 4.92e-06 | 3.09e-06 | 62 |
| Page: 1 |
Top |
Cell-cell communication analysis |
| Identification of potential cell-cell interactions between two cell types and their ligand-receptor pairs for different disease states |
| Ligand | Receptor | LRpair | Pathway | Tissue | Disease Stage |
| Page: 1 |
Top |
Single-cell gene regulatory network inference analysis |
| Find out the significant the regulons (TFs) and the target genes of each regulon across cell types for different disease states |
| TF | Cell Type | Tissue | Disease Stage | Target Gene | RSS | Regulon Activity |
| ∗The dot plots of a searched regulon are shown for all cell subpopulations in each disease state of each tissue based on the regulon specific score inferred using pySCENIC and by calculating the average expression. |
| Page: 1 |
Top |
Somatic mutation of malignant transformation related genes |
| Annotation of somatic variants for genes involved in malignant transformation |
| Hugo Symbol | Variant Class | Variant Classification | dbSNP RS | HGVSc | HGVSp | HGVSp Short | SWISSPROT | BIOTYPE | SIFT | PolyPhen | Tumor Sample Barcode | Tissue | Histology | Sex | Age | Stage | Therapy Types | Drugs | Outcome |
| ACAP2 | SNV | Missense_Mutation | c.677G>A | p.Arg226Gln | p.R226Q | Q15057 | protein_coding | tolerated(1) | benign(0) | TCGA-FY-A4B0-01 | Thyroid | thyroid carcinoma | Male | >=65 | I/II | Hormone Therapy | synthroid | SD | |
| ACAP2 | insertion | In_Frame_Ins | novel | c.765_766insTTACAG | p.Ser255_Lys256insLeuGln | p.S255_K256insLQ | Q15057 | protein_coding | TCGA-EL-A3ZG-01 | Thyroid | thyroid carcinoma | Male | <65 | I/II | Unknown | Unknown | SD | ||
| ACAP2 | insertion | In_Frame_Ins | novel | c.433_434insGATCACTCA | p.Gln145delinsArgSerLeuLys | p.Q145delinsRSLK | Q15057 | protein_coding | TCGA-FY-A4B0-01 | Thyroid | thyroid carcinoma | Male | >=65 | I/II | Hormone Therapy | synthroid | SD |
| Page: 1 2 3 4 5 6 7 8 9 10 |
Top |
Related drugs of malignant transformation related genes |
| Identification of chemicals and drugs interact with genes involved in malignant transfromation |
| (DGIdb 4.0) |
| Entrez ID | Symbol | Category | Interaction Types | Drug Claim Name | Drug Name | PMIDs |
| Page: 1 |

Copyright 2023-Present -The University of Texas Health Science Center at Houston |