
|
|||||
|
 | |
| |
| |
| |
| |
| |
|
Gene: TCF4 |
Gene summary for TCF4 |
| Gene information | Species | Human | Gene symbol | TCF4 | Gene ID | 6925 |
| Gene name | transcription factor 4 | |
| Gene Alias | CDG2T | |
| Cytomap | 18q21.2 | |
| Gene Type | protein-coding | GO ID | GO:0006139 | UniProtAcc | B3KVA4 |
Top |
Malignant transformation analysis |
| Identification of the aberrant gene expression in precancerous and cancerous lesions by comparing the gene expression of stem-like cells in diseased tissues with normal stem cells |
| Entrez ID | Symbol | Replicates | Species | Organ | Tissue | Adj P-value | Log2FC | Malignancy |
| 6925 | TCF4 | CA_HPV_1 | Human | Cervix | CC | 1.03e-14 | 5.39e-01 | 0.0264 |
| 6925 | TCF4 | CA_HPV_3 | Human | Cervix | CC | 3.25e-02 | 1.77e-02 | 0.0414 |
| 6925 | TCF4 | N_HPV_1 | Human | Cervix | N_HPV | 1.96e-02 | -2.47e-01 | 0.0079 |
| 6925 | TCF4 | CCI_3 | Human | Cervix | CC | 2.50e-04 | 9.53e-01 | 0.516 |
| 6925 | TCF4 | CCII_1 | Human | Cervix | CC | 3.14e-02 | -3.11e-01 | 0.3249 |
| 6925 | TCF4 | Tumor | Human | Cervix | CC | 4.44e-02 | -2.74e-01 | 0.1241 |
| 6925 | TCF4 | sample1 | Human | Cervix | CC | 3.44e-04 | -3.55e-01 | 0.0959 |
| 6925 | TCF4 | sample3 | Human | Cervix | CC | 1.62e-04 | -2.11e-01 | 0.1387 |
| 6925 | TCF4 | H2 | Human | Cervix | HSIL_HPV | 1.41e-04 | -2.57e-01 | 0.0632 |
| 6925 | TCF4 | T1 | Human | Cervix | CC | 1.12e-04 | -2.89e-01 | 0.0918 |
| 6925 | TCF4 | T3 | Human | Cervix | CC | 3.97e-03 | -2.16e-01 | 0.1389 |
| 6925 | TCF4 | AEH-subject1 | Human | Endometrium | AEH | 3.69e-04 | -2.95e-01 | -0.3059 |
| 6925 | TCF4 | AEH-subject2 | Human | Endometrium | AEH | 1.22e-06 | -3.37e-01 | -0.2525 |
| 6925 | TCF4 | AEH-subject3 | Human | Endometrium | AEH | 9.35e-04 | -2.47e-01 | -0.2576 |
| 6925 | TCF4 | AEH-subject5 | Human | Endometrium | AEH | 5.71e-05 | -3.28e-01 | -0.2953 |
| 6925 | TCF4 | EEC-subject2 | Human | Endometrium | EEC | 2.05e-09 | -4.71e-01 | -0.2607 |
| 6925 | TCF4 | EEC-subject3 | Human | Endometrium | EEC | 5.46e-23 | -4.28e-01 | -0.2525 |
| 6925 | TCF4 | GSM5276934 | Human | Endometrium | EEC | 2.45e-19 | -5.89e-01 | -0.0913 |
| 6925 | TCF4 | GSM5276935 | Human | Endometrium | EEC | 2.97e-44 | -7.63e-01 | -0.123 |
| 6925 | TCF4 | GSM5276937 | Human | Endometrium | EEC | 7.68e-17 | -5.83e-01 | -0.0897 |
| Page: 1 2 3 4 5 6 7 8 |
| Tissue | Expression Dynamics | Abbreviation |
| Cervix |  | CC: Cervix cancer |
| HSIL_HPV: HPV-infected high-grade squamous intraepithelial lesions | ||
| N_HPV: HPV-infected normal cervix | ||
| Endometrium | 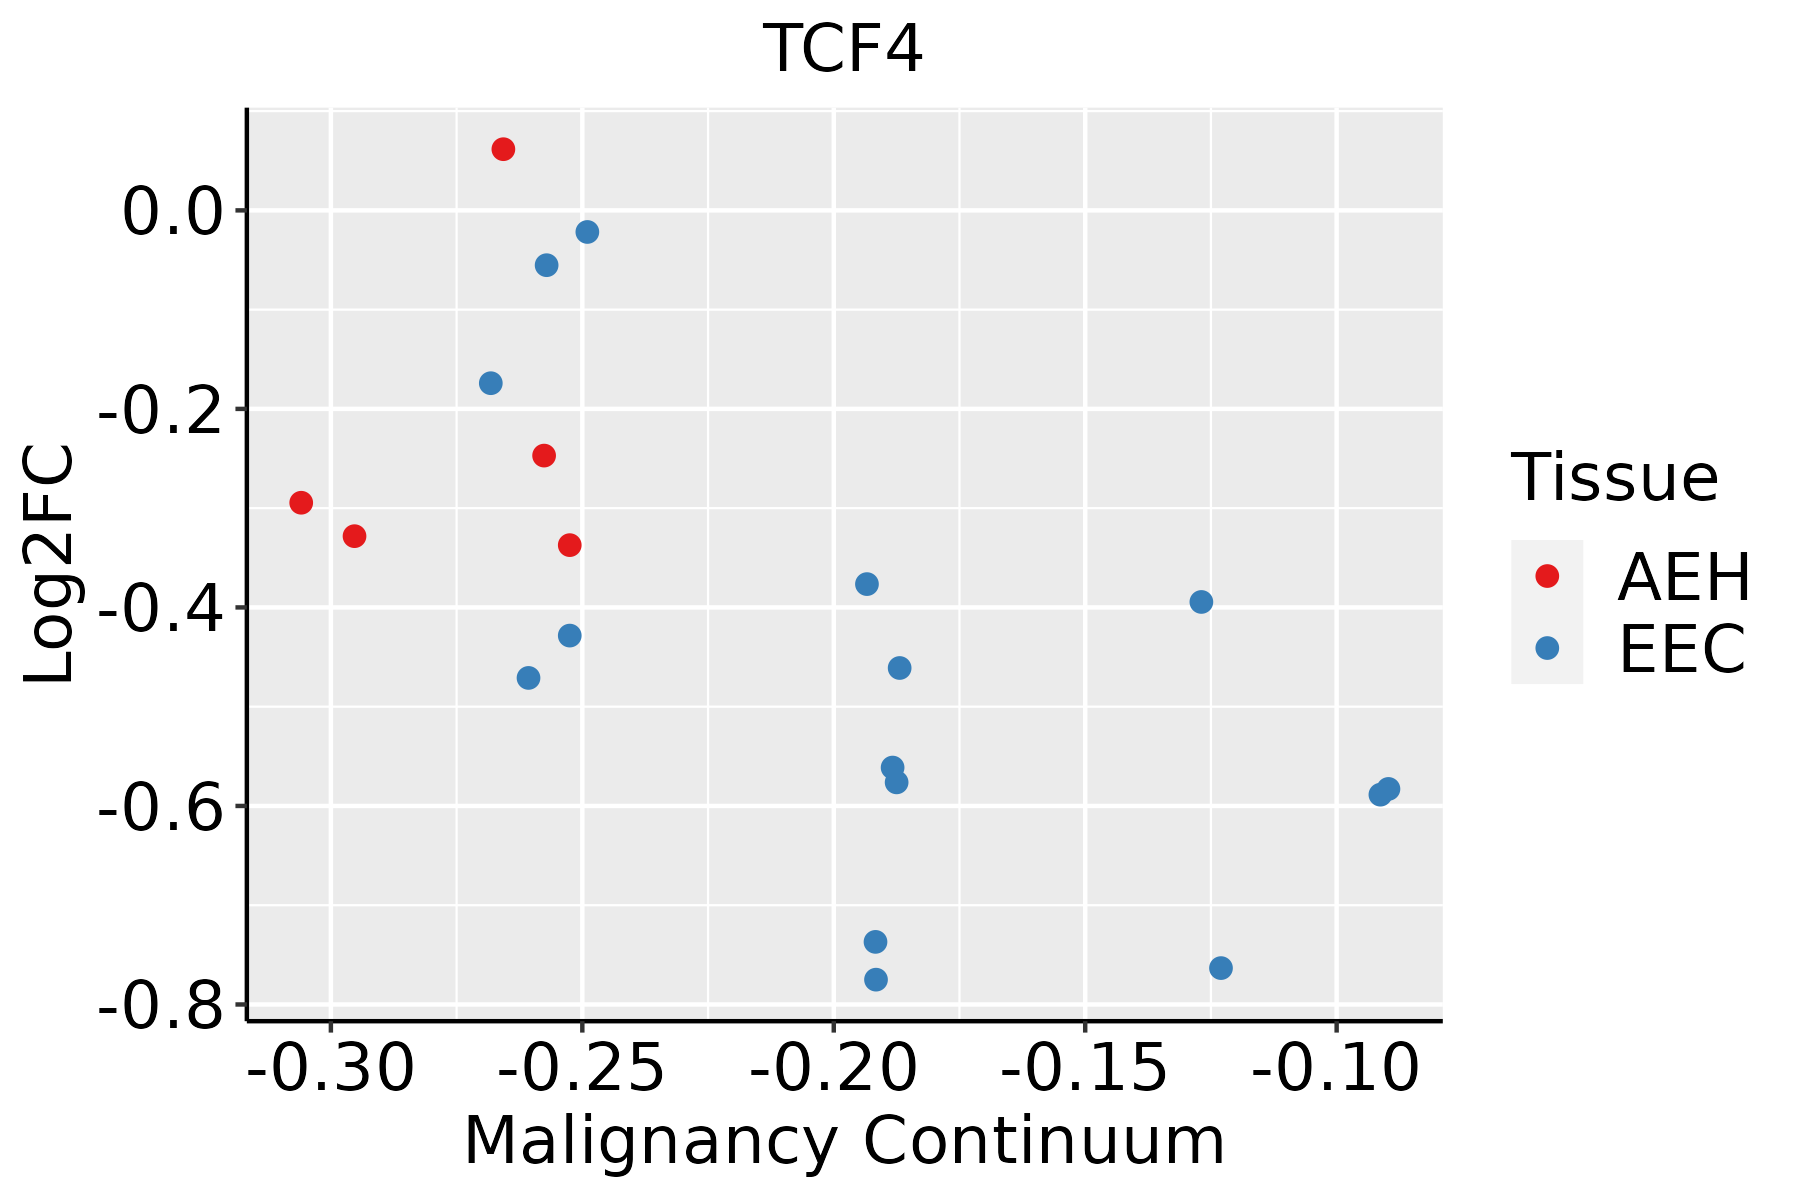 | AEH: Atypical endometrial hyperplasia |
| EEC: Endometrioid Cancer | ||
| Esophagus |  | ESCC: Esophageal squamous cell carcinoma |
| HGIN: High-grade intraepithelial neoplasias | ||
| LGIN: Low-grade intraepithelial neoplasias | ||
| Liver |  | HCC: Hepatocellular carcinoma |
| NAFLD: Non-alcoholic fatty liver disease | ||
| Oral Cavity |  | EOLP: Erosive Oral lichen planus |
| LP: leukoplakia | ||
| NEOLP: Non-erosive oral lichen planus | ||
| OSCC: Oral squamous cell carcinoma | ||
| Prostate | 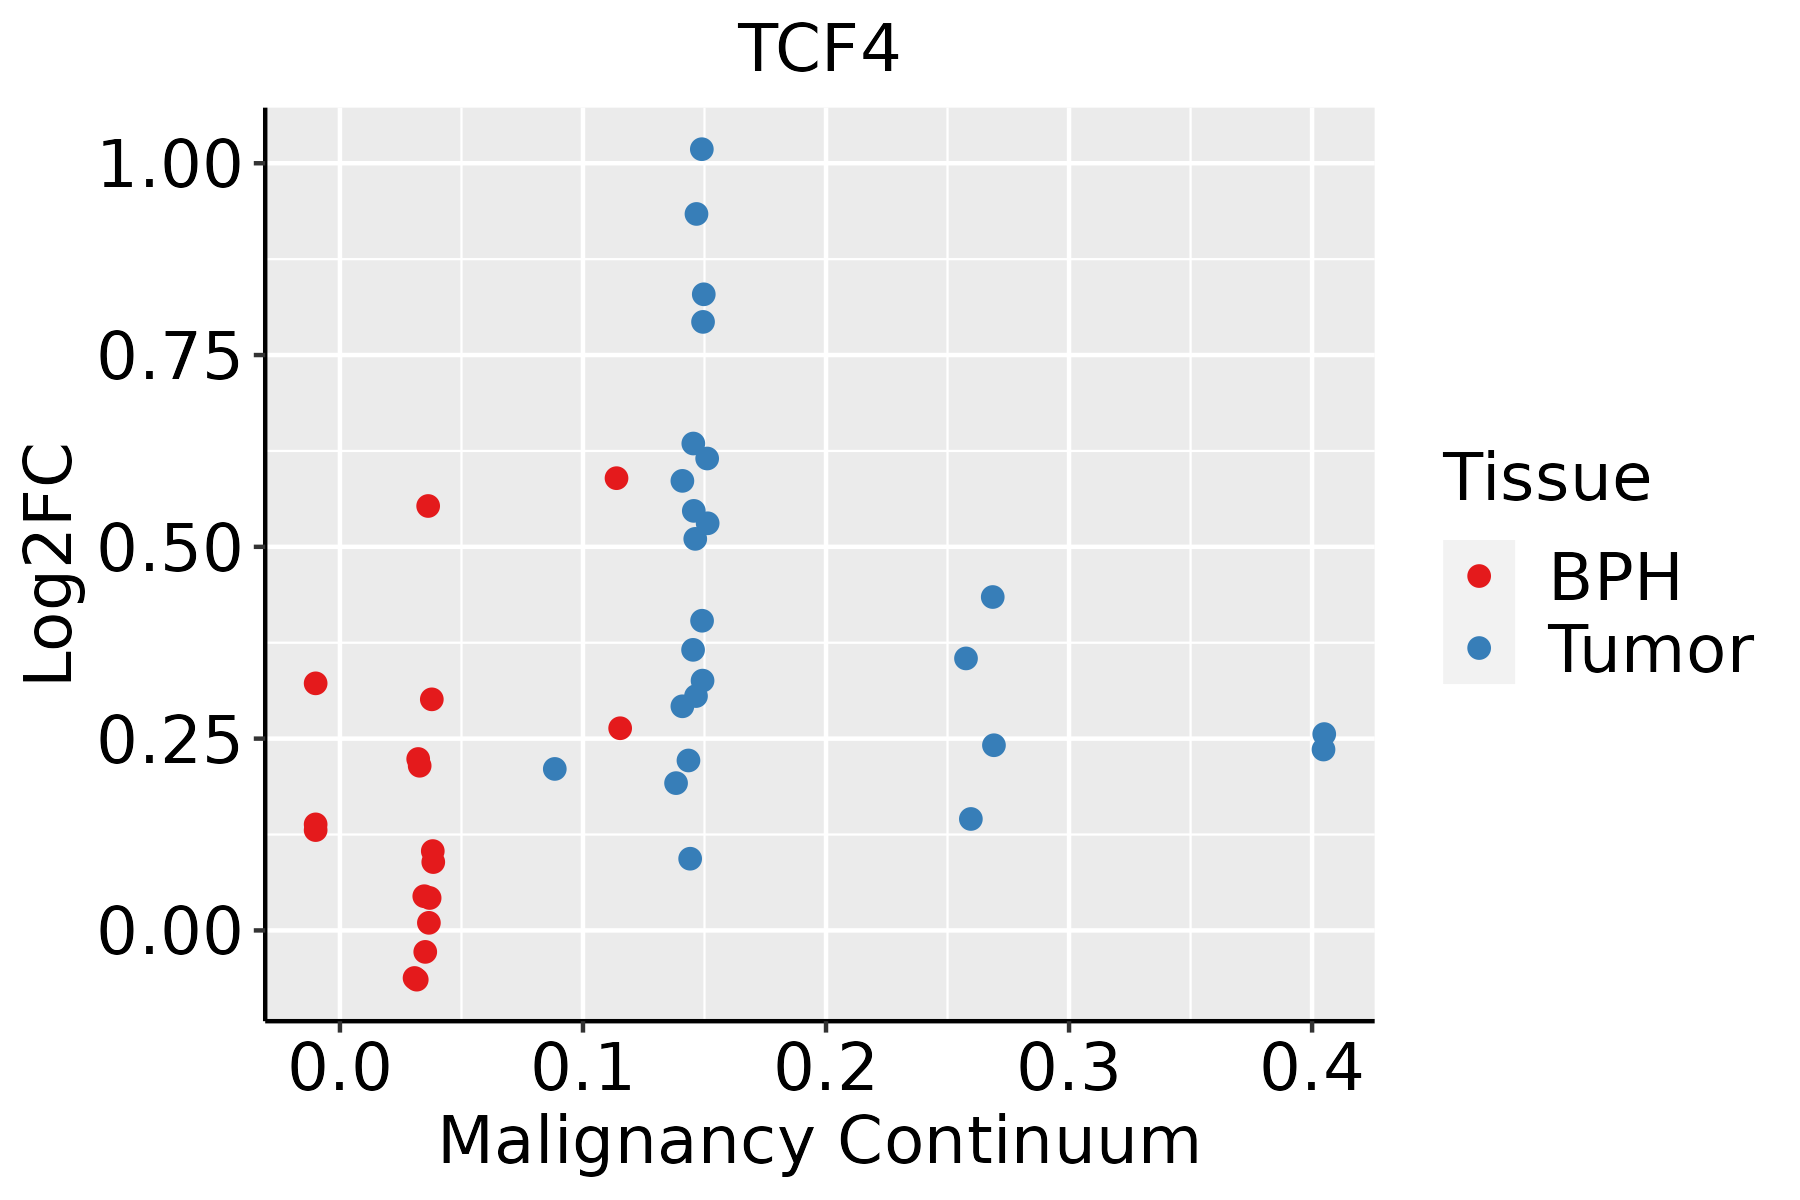 | BPH: Benign Prostatic Hyperplasia |
| Skin |  | AK: Actinic keratosis |
| cSCC: Cutaneous squamous cell carcinoma | ||
| SCCIS:squamous cell carcinoma in situ | ||
| Thyroid | 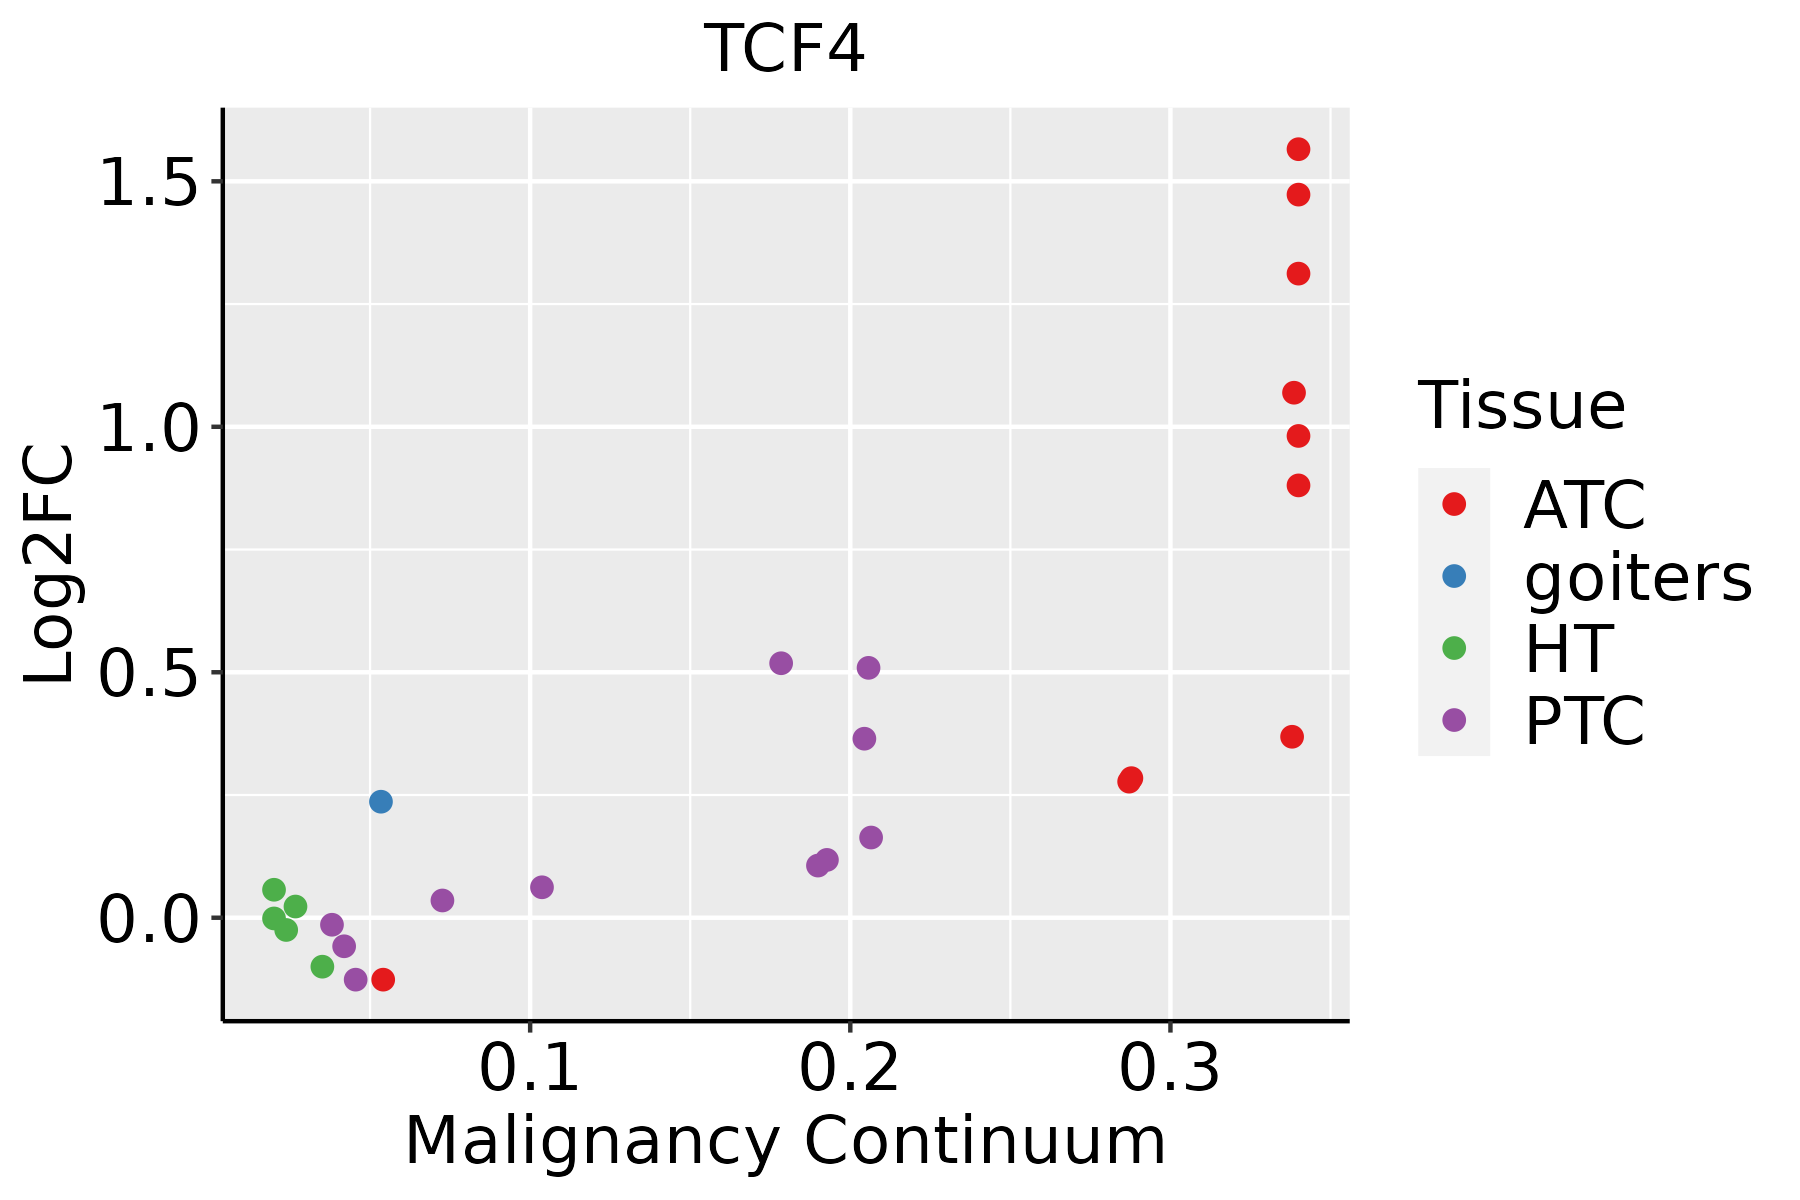 | ATC: Anaplastic thyroid cancer |
| HT: Hashimoto's thyroiditis | ||
| PTC: Papillary thyroid cancer |
| ∗log2FC in expression of this searched gene in stem-like cells from each diseased tissue sample relative to stem-like cells in normal samples in each tissue plotted against the malignancy continuum. Samples are colored based on if they are from different disease stage. |
Top |
Malignant transformation related pathway analysis |
| Find out the enriched GO biological processes and KEGG pathways involved in transition from healthy to precancer to cancer |
| Tissue | Disease Stage | Enriched GO biological Processes |
| Colorectum | AD |  |
| Colorectum | SER |  |
| Colorectum | MSS |  |
| Colorectum | MSI-H |  |
| Colorectum | FAP |  |
| ∗Top 15 enriched GO BP terms are showed in the bar plot of each disease state in each tissue. Each row represents a significant GO biological process which is colored according to the -log10(p.adjust). |
| Page: 1 2 3 4 5 6 7 8 9 |
| GO ID | Tissue | Disease Stage | Description | Gene Ratio | Bg Ratio | pvalue | p.adjust | Count |
| GO:0045664 | Prostate | BPH | regulation of neuron differentiation | 46/3107 | 196/18723 | 7.95e-03 | 3.47e-02 | 46 |
| GO:00456641 | Prostate | Tumor | regulation of neuron differentiation | 52/3246 | 196/18723 | 7.90e-04 | 5.38e-03 | 52 |
| GO:00718241 | Skin | cSCC | protein-DNA complex subunit organization | 87/4864 | 241/18723 | 3.09e-04 | 2.47e-03 | 87 |
| GO:00718242 | Thyroid | ATC | protein-DNA complex subunit organization | 103/6293 | 241/18723 | 1.84e-03 | 9.03e-03 | 103 |
| Page: 1 |
| Pathway ID | Tissue | Disease Stage | Description | Gene Ratio | Bg Ratio | pvalue | p.adjust | qvalue | Count |
| Page: 1 |
Top |
Cell-cell communication analysis |
| Identification of potential cell-cell interactions between two cell types and their ligand-receptor pairs for different disease states |
| Ligand | Receptor | LRpair | Pathway | Tissue | Disease Stage |
| Page: 1 |
Top |
Single-cell gene regulatory network inference analysis |
| Find out the significant the regulons (TFs) and the target genes of each regulon across cell types for different disease states |
| TF | Cell Type | Tissue | Disease Stage | Target Gene | RSS | Regulon Activity |
| TCF4 | BAS | Prostate | Healthy | KRT15,C1R,SERPINF1, etc. | 3.02e-01 |  |
| TCF4 | M1MAC | Prostate | Healthy | CCDC50,ADGRL4,PLVAP, etc. | 1.66e-01 | |
| TCF4 | M1MAC | Prostate | Tumor | CCDC50,ADGRL4,PLVAP, etc. | 3.74e-02 |  |
| TCF4 | cDC | Prostate | Tumor | CCDC50,ADGRL4,PLVAP, etc. | 9.14e-02 | |
| TCF4 | STM | Skin | Healthy | ADIRF,COL6A2,COL6A1, etc. | 4.96e-01 |  |
| TCF4 | BN | Skin | AK | IRF7,CCDC50,FUZ, etc. | 1.03e-01 |  |
| TCF4 | pDC | Skin | cSCC | IRF7,CCDC50,FUZ, etc. | 1.45e-01 |  |
| TCF4 | BN | Skin | SCCIS | IRF7,CCDC50,FUZ, etc. | 1.94e-01 |  |
| TCF4 | pDC | Thyroid | ADJ | IRF7,CLIC3,FCHSD2, etc. | 2.71e-02 |  |
| TCF4 | pDC | Thyroid | ATC | IRF7,CLIC3,FCHSD2, etc. | 6.57e-02 |  |
| ∗The dot plots of a searched regulon are shown for all cell subpopulations in each disease state of each tissue based on the regulon specific score inferred using pySCENIC and by calculating the average expression. |
| Page: 1 2 3 4 5 6 7 |
Top |
Somatic mutation of malignant transformation related genes |
| Annotation of somatic variants for genes involved in malignant transformation |
| Hugo Symbol | Variant Class | Variant Classification | dbSNP RS | HGVSc | HGVSp | HGVSp Short | SWISSPROT | BIOTYPE | SIFT | PolyPhen | Tumor Sample Barcode | Tissue | Histology | Sex | Age | Stage | Therapy Types | Drugs | Outcome |
| TCF4 | SNV | Missense_Mutation | novel | c.1040C>G | p.Ser347Cys | p.S347C | protein_coding | tolerated(0.05) | probably_damaging(0.999) | TCGA-A2-A0CL-01 | Breast | breast invasive carcinoma | Female | <65 | III/IV | Chemotherapy | cytoxan | SD | |
| TCF4 | SNV | Missense_Mutation | c.1858N>A | p.Glu620Lys | p.E620K | protein_coding | tolerated(0.64) | possibly_damaging(0.606) | TCGA-AN-A0FV-01 | Breast | breast invasive carcinoma | Female | <65 | I/II | Unknown | Unknown | SD | ||
| TCF4 | SNV | Missense_Mutation | c.1873C>G | p.Leu625Val | p.L625V | protein_coding | tolerated(0.26) | possibly_damaging(0.737) | TCGA-AR-A24L-01 | Breast | breast invasive carcinoma | Female | <65 | I/II | Hormone Therapy | tamoxiphen | PD | ||
| TCF4 | SNV | Missense_Mutation | c.1247N>T | p.Ala416Val | p.A416V | protein_coding | tolerated(0.18) | possibly_damaging(0.46) | TCGA-BH-A0B7-01 | Breast | breast invasive carcinoma | Female | <65 | I/II | Chemotherapy | adriamycin | CR | ||
| TCF4 | SNV | Missense_Mutation | c.2175N>C | p.Gln725His | p.Q725H | protein_coding | deleterious(0.02) | probably_damaging(0.998) | TCGA-BH-A0W7-01 | Breast | breast invasive carcinoma | Female | <65 | I/II | Chemotherapy | taxotere | CR | ||
| TCF4 | SNV | Missense_Mutation | c.1762N>T | p.Asp588Tyr | p.D588Y | protein_coding | deleterious(0) | probably_damaging(0.967) | TCGA-C8-A12K-01 | Breast | breast invasive carcinoma | Female | >=65 | I/II | Unknown | Unknown | SD | ||
| TCF4 | SNV | Missense_Mutation | c.449C>T | p.Ser150Leu | p.S150L | protein_coding | deleterious(0) | benign(0.281) | TCGA-D8-A27G-01 | Breast | breast invasive carcinoma | Female | >=65 | I/II | Unknown | Unknown | SD | ||
| TCF4 | SNV | Missense_Mutation | novel | c.521G>C | p.Gly174Ala | p.G174A | protein_coding | tolerated(0.2) | probably_damaging(0.999) | TCGA-GM-A3NW-01 | Breast | breast invasive carcinoma | Female | <65 | I/II | Chemotherapy | fluorouracil | SD | |
| TCF4 | SNV | Missense_Mutation | novel | c.831N>C | p.Lys277Asn | p.K277N | protein_coding | deleterious(0) | possibly_damaging(0.65) | TCGA-JL-A3YW-01 | Breast | breast invasive carcinoma | Female | <65 | I/II | Unknown | Unknown | SD | |
| TCF4 | insertion | Nonsense_Mutation | novel | c.1173_1174insTTTGAGGAATGAACTGGGCTGGATGTCCAGCTGCCCCTGGAGG | p.His392PhefsTer4 | p.H392Ffs*4 | protein_coding | TCGA-A2-A04V-01 | Breast | breast invasive carcinoma | Female | <65 | I/II | Chemotherapy | cytoxan | PD |
| Page: 1 2 3 4 5 6 7 8 9 10 11 |
Top |
Related drugs of malignant transformation related genes |
| Identification of chemicals and drugs interact with genes involved in malignant transfromation |
| (DGIdb 4.0) |
| Entrez ID | Symbol | Category | Interaction Types | Drug Claim Name | Drug Name | PMIDs |
| Page: 1 |

Copyright 2023-Present -The University of Texas Health Science Center at Houston |