
|
|||||
|
 | |
| |
| |
| |
| |
| |
|
Gene: TRAF3 |
Gene summary for TRAF3 |
| Gene information | Species | Human | Gene symbol | TRAF3 | Gene ID | 7187 |
| Gene name | TNF receptor associated factor 3 | |
| Gene Alias | CAP-1 | |
| Cytomap | 14q32.32 | |
| Gene Type | protein-coding | GO ID | GO:0000165 | UniProtAcc | Q13114 |
Top |
Malignant transformation analysis |
| Identification of the aberrant gene expression in precancerous and cancerous lesions by comparing the gene expression of stem-like cells in diseased tissues with normal stem cells |
| Entrez ID | Symbol | Replicates | Species | Organ | Tissue | Adj P-value | Log2FC | Malignancy |
| 7187 | TRAF3 | CCI_1 | Human | Cervix | CC | 5.87e-10 | 8.68e-01 | 0.528 |
| 7187 | TRAF3 | CCI_3 | Human | Cervix | CC | 8.19e-07 | 6.75e-01 | 0.516 |
| 7187 | TRAF3 | LZE7T | Human | Esophagus | ESCC | 2.33e-03 | 2.19e-01 | 0.0667 |
| 7187 | TRAF3 | P2T-E | Human | Esophagus | ESCC | 3.22e-22 | 3.82e-01 | 0.1177 |
| 7187 | TRAF3 | P4T-E | Human | Esophagus | ESCC | 1.64e-11 | 2.45e-01 | 0.1323 |
| 7187 | TRAF3 | P5T-E | Human | Esophagus | ESCC | 8.07e-11 | 1.30e-01 | 0.1327 |
| 7187 | TRAF3 | P8T-E | Human | Esophagus | ESCC | 2.25e-08 | 1.02e-01 | 0.0889 |
| 7187 | TRAF3 | P9T-E | Human | Esophagus | ESCC | 3.00e-05 | 1.18e-01 | 0.1131 |
| 7187 | TRAF3 | P10T-E | Human | Esophagus | ESCC | 1.55e-03 | 1.39e-01 | 0.116 |
| 7187 | TRAF3 | P11T-E | Human | Esophagus | ESCC | 1.50e-04 | 1.43e-01 | 0.1426 |
| 7187 | TRAF3 | P12T-E | Human | Esophagus | ESCC | 8.48e-12 | 1.65e-01 | 0.1122 |
| 7187 | TRAF3 | P15T-E | Human | Esophagus | ESCC | 3.10e-06 | 1.44e-01 | 0.1149 |
| 7187 | TRAF3 | P16T-E | Human | Esophagus | ESCC | 4.63e-09 | 1.90e-01 | 0.1153 |
| 7187 | TRAF3 | P21T-E | Human | Esophagus | ESCC | 1.03e-10 | 1.50e-01 | 0.1617 |
| 7187 | TRAF3 | P22T-E | Human | Esophagus | ESCC | 2.09e-08 | 9.27e-02 | 0.1236 |
| 7187 | TRAF3 | P23T-E | Human | Esophagus | ESCC | 1.35e-06 | 1.78e-01 | 0.108 |
| 7187 | TRAF3 | P24T-E | Human | Esophagus | ESCC | 1.50e-08 | 1.37e-01 | 0.1287 |
| 7187 | TRAF3 | P26T-E | Human | Esophagus | ESCC | 2.68e-21 | 2.26e-01 | 0.1276 |
| 7187 | TRAF3 | P27T-E | Human | Esophagus | ESCC | 3.01e-10 | 1.85e-01 | 0.1055 |
| 7187 | TRAF3 | P28T-E | Human | Esophagus | ESCC | 1.98e-15 | 2.83e-01 | 0.1149 |
| Page: 1 2 3 4 5 |
| Tissue | Expression Dynamics | Abbreviation |
| Cervix |  | CC: Cervix cancer |
| HSIL_HPV: HPV-infected high-grade squamous intraepithelial lesions | ||
| N_HPV: HPV-infected normal cervix | ||
| Esophagus |  | ESCC: Esophageal squamous cell carcinoma |
| HGIN: High-grade intraepithelial neoplasias | ||
| LGIN: Low-grade intraepithelial neoplasias | ||
| Lung | 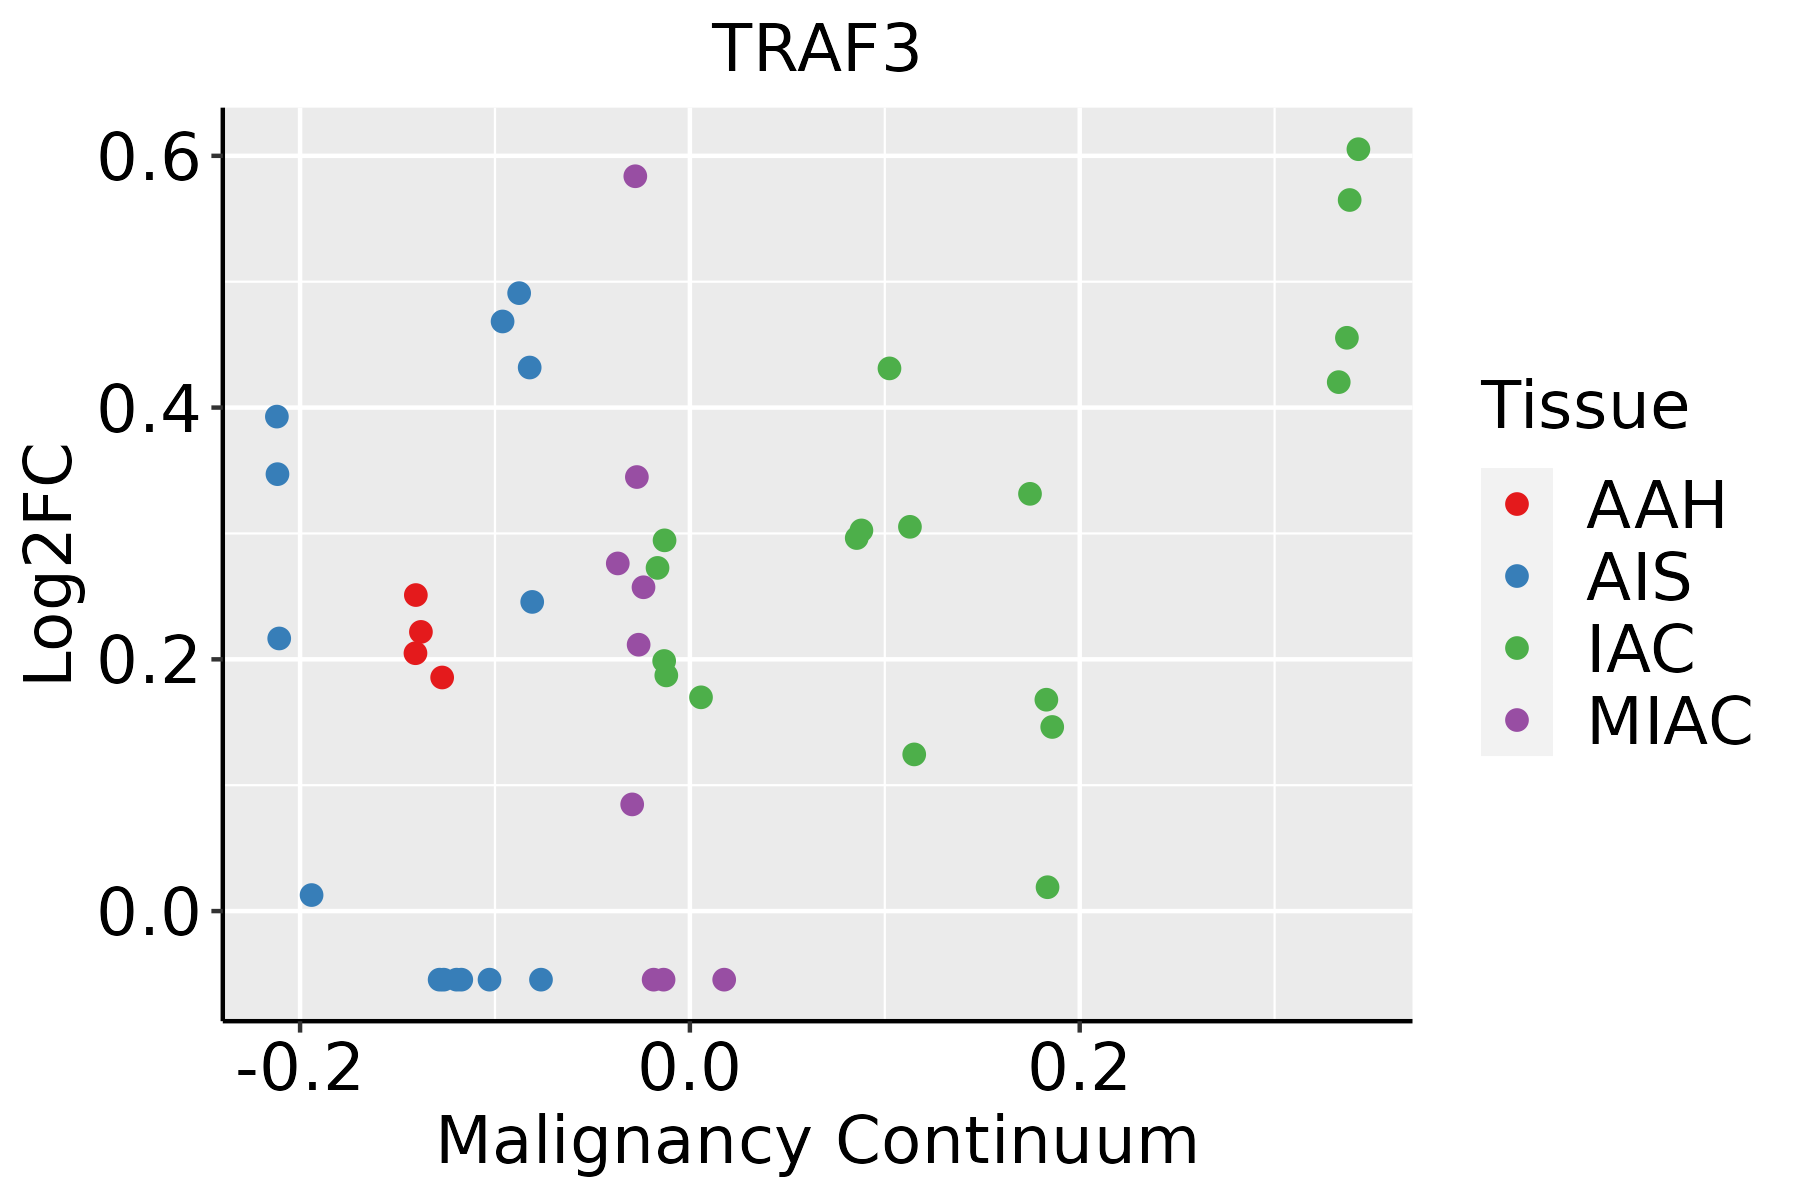 | AAH: Atypical adenomatous hyperplasia |
| AIS: Adenocarcinoma in situ | ||
| IAC: Invasive lung adenocarcinoma | ||
| MIA: Minimally invasive adenocarcinoma | ||
| Oral Cavity |  | EOLP: Erosive Oral lichen planus |
| LP: leukoplakia | ||
| NEOLP: Non-erosive oral lichen planus | ||
| OSCC: Oral squamous cell carcinoma | ||
| Prostate | 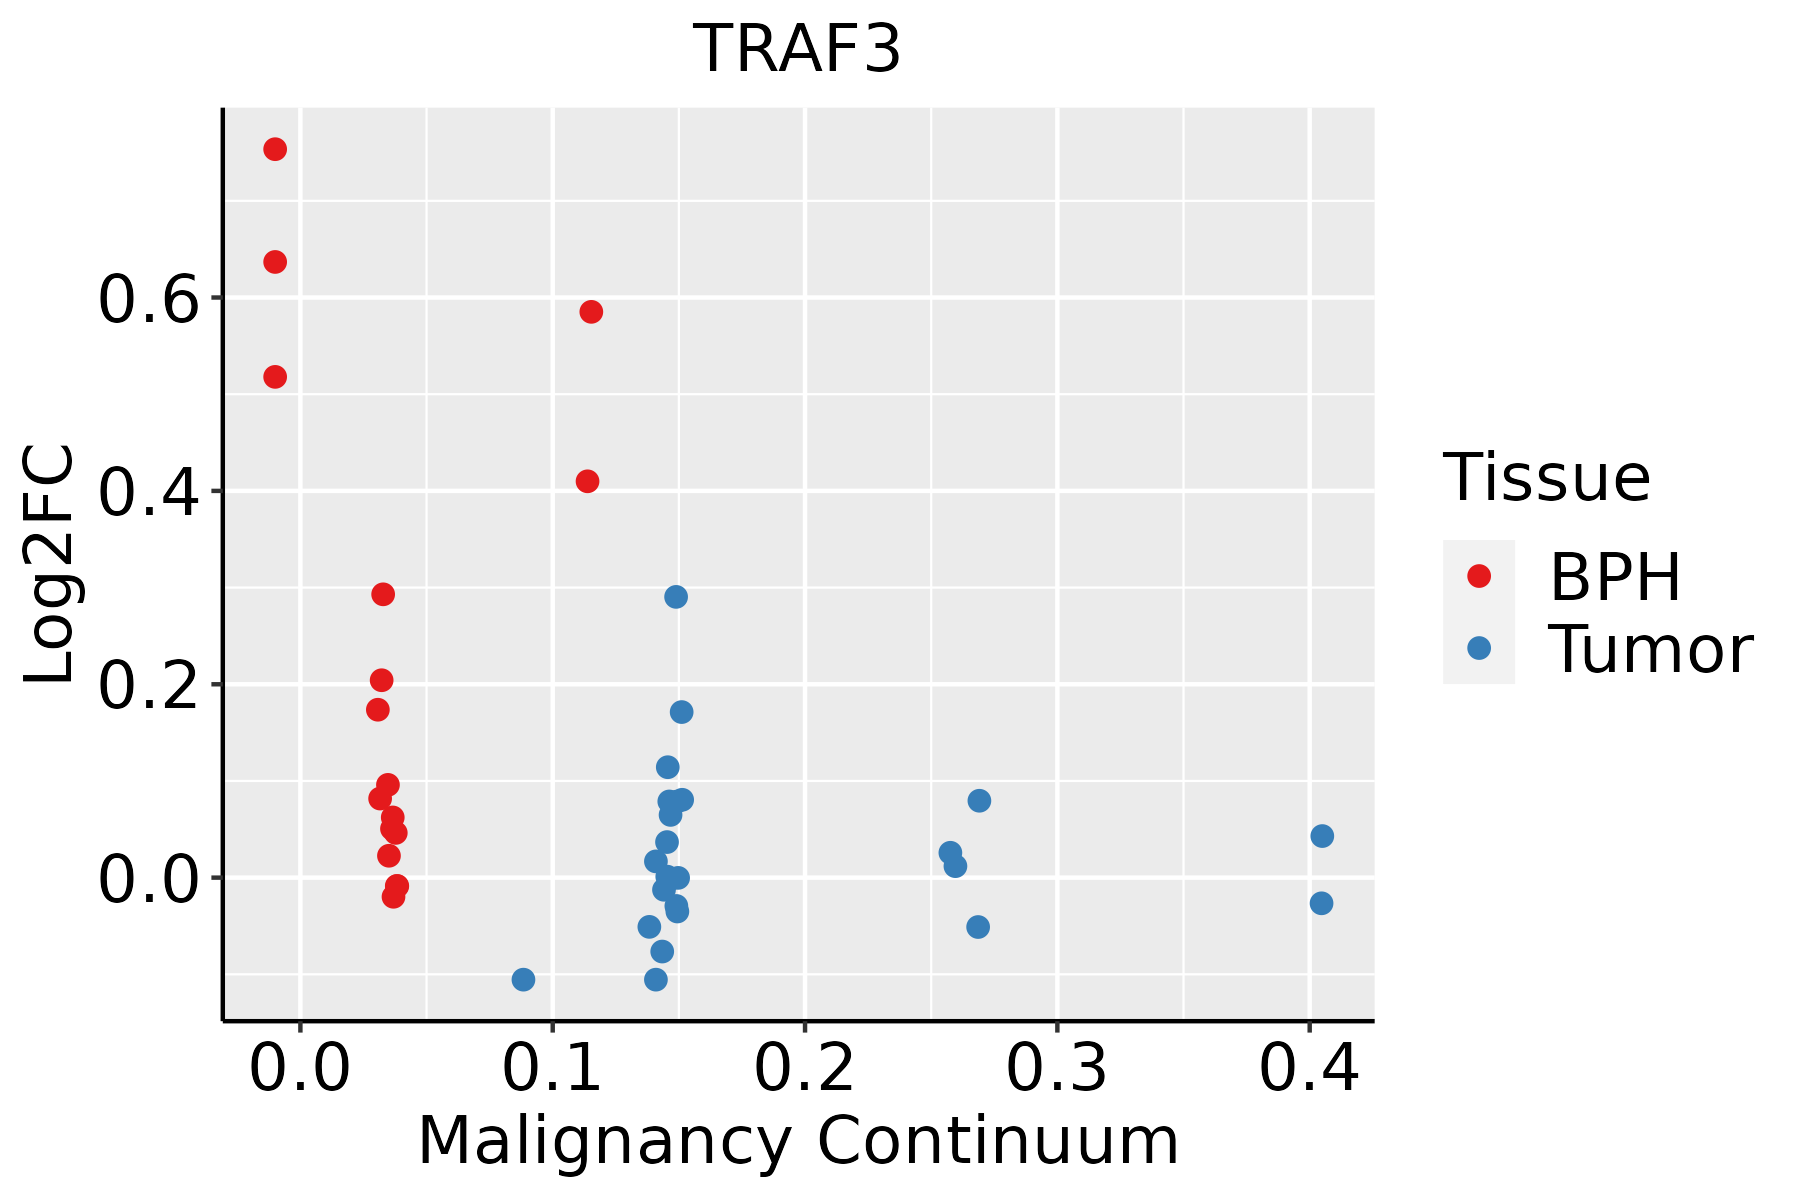 | BPH: Benign Prostatic Hyperplasia |
| ∗log2FC in expression of this searched gene in stem-like cells from each diseased tissue sample relative to stem-like cells in normal samples in each tissue plotted against the malignancy continuum. Samples are colored based on if they are from different disease stage. |
Top |
Malignant transformation related pathway analysis |
| Find out the enriched GO biological processes and KEGG pathways involved in transition from healthy to precancer to cancer |
| Tissue | Disease Stage | Enriched GO biological Processes |
| Colorectum | AD |  |
| Colorectum | SER |  |
| Colorectum | MSS |  |
| Colorectum | MSI-H |  |
| Colorectum | FAP |  |
| ∗Top 15 enriched GO BP terms are showed in the bar plot of each disease state in each tissue. Each row represents a significant GO biological process which is colored according to the -log10(p.adjust). |
| Page: 1 2 3 4 5 6 7 8 9 |
| GO ID | Tissue | Disease Stage | Description | Gene Ratio | Bg Ratio | pvalue | p.adjust | Count |
| GO:00027644 | Cervix | CC | immune response-regulating signaling pathway | 97/2311 | 468/18723 | 1.49e-07 | 7.07e-06 | 97 |
| GO:00002097 | Cervix | CC | protein polyubiquitination | 58/2311 | 236/18723 | 1.57e-07 | 7.41e-06 | 58 |
| GO:00310988 | Cervix | CC | stress-activated protein kinase signaling cascade | 58/2311 | 247/18723 | 8.02e-07 | 2.89e-05 | 58 |
| GO:00514038 | Cervix | CC | stress-activated MAPK cascade | 55/2311 | 239/18723 | 2.96e-06 | 8.31e-05 | 55 |
| GO:00510904 | Cervix | CC | regulation of DNA-binding transcription factor activity | 87/2311 | 440/18723 | 4.85e-06 | 1.22e-04 | 87 |
| GO:00703027 | Cervix | CC | regulation of stress-activated protein kinase signaling cascade | 46/2311 | 195/18723 | 9.35e-06 | 2.11e-04 | 46 |
| GO:00346129 | Cervix | CC | response to tumor necrosis factor | 55/2311 | 253/18723 | 1.75e-05 | 3.32e-04 | 55 |
| GO:00713569 | Cervix | CC | cellular response to tumor necrosis factor | 51/2311 | 229/18723 | 1.75e-05 | 3.32e-04 | 51 |
| GO:00028315 | Cervix | CC | regulation of response to biotic stimulus | 67/2311 | 327/18723 | 1.79e-05 | 3.36e-04 | 67 |
| GO:00096158 | Cervix | CC | response to virus | 73/2311 | 367/18723 | 2.22e-05 | 3.95e-04 | 73 |
| GO:00434104 | Cervix | CC | positive regulation of MAPK cascade | 90/2311 | 480/18723 | 2.92e-05 | 4.83e-04 | 90 |
| GO:00328727 | Cervix | CC | regulation of stress-activated MAPK cascade | 44/2311 | 192/18723 | 3.09e-05 | 5.10e-04 | 44 |
| GO:00431228 | Cervix | CC | regulation of I-kappaB kinase/NF-kappaB signaling | 53/2311 | 249/18723 | 4.50e-05 | 6.87e-04 | 53 |
| GO:00022212 | Cervix | CC | pattern recognition receptor signaling pathway | 39/2311 | 172/18723 | 1.08e-04 | 1.38e-03 | 39 |
| GO:00072497 | Cervix | CC | I-kappaB kinase/NF-kappaB signaling | 56/2311 | 281/18723 | 1.81e-04 | 2.12e-03 | 56 |
| GO:00192213 | Cervix | CC | cytokine-mediated signaling pathway | 84/2311 | 472/18723 | 3.25e-04 | 3.44e-03 | 84 |
| GO:00072545 | Cervix | CC | JNK cascade | 35/2311 | 167/18723 | 1.10e-03 | 9.09e-03 | 35 |
| GO:00332097 | Cervix | CC | tumor necrosis factor-mediated signaling pathway | 23/2311 | 99/18723 | 1.86e-03 | 1.38e-02 | 23 |
| GO:00463285 | Cervix | CC | regulation of JNK cascade | 28/2311 | 133/18723 | 3.06e-03 | 2.01e-02 | 28 |
| GO:00703043 | Cervix | CC | positive regulation of stress-activated protein kinase signaling cascade | 27/2311 | 128/18723 | 3.49e-03 | 2.26e-02 | 27 |
| Page: 1 2 3 4 5 6 7 8 9 10 11 12 13 14 15 16 17 18 19 20 21 22 23 |
| Pathway ID | Tissue | Disease Stage | Description | Gene Ratio | Bg Ratio | pvalue | p.adjust | qvalue | Count |
| hsa0516061 | Oral cavity | NEOLP | Hepatitis C | 43/1112 | 157/8465 | 1.26e-06 | 1.34e-05 | 8.43e-06 | 43 |
| hsa0516961 | Oral cavity | NEOLP | Epstein-Barr virus infection | 51/1112 | 202/8465 | 1.96e-06 | 2.01e-05 | 1.27e-05 | 51 |
| hsa0516461 | Oral cavity | NEOLP | Influenza A | 43/1112 | 171/8465 | 1.38e-05 | 1.22e-04 | 7.68e-05 | 43 |
| hsa051626 | Oral cavity | NEOLP | Measles | 35/1112 | 139/8465 | 8.30e-05 | 6.14e-04 | 3.86e-04 | 35 |
| hsa0541763 | Oral cavity | NEOLP | Lipid and atherosclerosis | 47/1112 | 215/8465 | 2.39e-04 | 1.61e-03 | 1.01e-03 | 47 |
| hsa051616 | Oral cavity | NEOLP | Hepatitis B | 37/1112 | 162/8465 | 4.41e-04 | 2.60e-03 | 1.63e-03 | 37 |
| hsa0522261 | Oral cavity | NEOLP | Small cell lung cancer | 24/1112 | 92/8465 | 6.04e-04 | 3.31e-03 | 2.08e-03 | 24 |
| hsa0466861 | Oral cavity | NEOLP | TNF signaling pathway | 27/1112 | 114/8465 | 1.42e-03 | 6.55e-03 | 4.12e-03 | 27 |
| hsa046216 | Oral cavity | NEOLP | NOD-like receptor signaling pathway | 39/1112 | 186/8465 | 1.79e-03 | 7.91e-03 | 4.98e-03 | 39 |
| hsa0465761 | Oral cavity | NEOLP | IL-17 signaling pathway | 22/1112 | 94/8465 | 4.40e-03 | 1.75e-02 | 1.10e-02 | 22 |
| hsa0517174 | Oral cavity | NEOLP | Coronavirus disease - COVID-19 | 112/1112 | 232/8465 | 8.85e-40 | 2.82e-37 | 1.77e-37 | 112 |
| hsa0516571 | Oral cavity | NEOLP | Human papillomavirus infection | 90/1112 | 331/8465 | 2.75e-12 | 1.75e-10 | 1.10e-10 | 90 |
| hsa0516772 | Oral cavity | NEOLP | Kaposi sarcoma-associated herpesvirus infection | 56/1112 | 194/8465 | 4.05e-09 | 9.20e-08 | 5.78e-08 | 56 |
| hsa0520371 | Oral cavity | NEOLP | Viral carcinogenesis | 56/1112 | 204/8465 | 2.90e-08 | 5.34e-07 | 3.36e-07 | 56 |
| hsa0516071 | Oral cavity | NEOLP | Hepatitis C | 43/1112 | 157/8465 | 1.26e-06 | 1.34e-05 | 8.43e-06 | 43 |
| hsa0516971 | Oral cavity | NEOLP | Epstein-Barr virus infection | 51/1112 | 202/8465 | 1.96e-06 | 2.01e-05 | 1.27e-05 | 51 |
| hsa0516471 | Oral cavity | NEOLP | Influenza A | 43/1112 | 171/8465 | 1.38e-05 | 1.22e-04 | 7.68e-05 | 43 |
| hsa051627 | Oral cavity | NEOLP | Measles | 35/1112 | 139/8465 | 8.30e-05 | 6.14e-04 | 3.86e-04 | 35 |
| hsa0541773 | Oral cavity | NEOLP | Lipid and atherosclerosis | 47/1112 | 215/8465 | 2.39e-04 | 1.61e-03 | 1.01e-03 | 47 |
| hsa051617 | Oral cavity | NEOLP | Hepatitis B | 37/1112 | 162/8465 | 4.41e-04 | 2.60e-03 | 1.63e-03 | 37 |
| Page: 1 2 3 4 5 6 7 8 9 10 11 |
Top |
Cell-cell communication analysis |
| Identification of potential cell-cell interactions between two cell types and their ligand-receptor pairs for different disease states |
| Ligand | Receptor | LRpair | Pathway | Tissue | Disease Stage |
| Page: 1 |
Top |
Single-cell gene regulatory network inference analysis |
| Find out the significant the regulons (TFs) and the target genes of each regulon across cell types for different disease states |
| TF | Cell Type | Tissue | Disease Stage | Target Gene | RSS | Regulon Activity |
| ∗The dot plots of a searched regulon are shown for all cell subpopulations in each disease state of each tissue based on the regulon specific score inferred using pySCENIC and by calculating the average expression. |
| Page: 1 |
Top |
Somatic mutation of malignant transformation related genes |
| Annotation of somatic variants for genes involved in malignant transformation |
| Hugo Symbol | Variant Class | Variant Classification | dbSNP RS | HGVSc | HGVSp | HGVSp Short | SWISSPROT | BIOTYPE | SIFT | PolyPhen | Tumor Sample Barcode | Tissue | Histology | Sex | Age | Stage | Therapy Types | Drugs | Outcome |
| TRAF3 | SNV | Missense_Mutation | novel | c.1552A>G | p.Ser518Gly | p.S518G | Q13114 | protein_coding | deleterious(0) | probably_damaging(1) | TCGA-AN-A0FK-01 | Breast | breast invasive carcinoma | Female | >=65 | III/IV | Unknown | Unknown | SD |
| TRAF3 | SNV | Missense_Mutation | novel | c.1591N>A | p.Ala531Thr | p.A531T | Q13114 | protein_coding | deleterious(0) | probably_damaging(1) | TCGA-AR-A24T-01 | Breast | breast invasive carcinoma | Female | <65 | III/IV | Chemotherapy | cytoxan | SD |
| TRAF3 | SNV | Missense_Mutation | c.599N>C | p.Val200Ala | p.V200A | Q13114 | protein_coding | tolerated(0.6) | benign(0.079) | TCGA-C8-A26Y-01 | Breast | breast invasive carcinoma | Female | >=65 | I/II | Unknown | Unknown | SD | |
| TRAF3 | SNV | Missense_Mutation | novel | c.1624N>T | p.Val542Phe | p.V542F | Q13114 | protein_coding | deleterious(0) | probably_damaging(0.966) | TCGA-E9-A54X-01 | Breast | breast invasive carcinoma | Female | >=65 | I/II | Unknown | Unknown | SD |
| TRAF3 | insertion | Frame_Shift_Ins | novel | c.1553_1554insATTCTGCACTGTC | p.Ser518ArgfsTer37 | p.S518Rfs*37 | Q13114 | protein_coding | TCGA-AN-A0FK-01 | Breast | breast invasive carcinoma | Female | >=65 | III/IV | Unknown | Unknown | SD | ||
| TRAF3 | insertion | Nonsense_Mutation | novel | c.194_195insTATTTGATCATGTTTTGTTCCCAACACATATTAAAGTTGG | p.Gln65HisfsTer3 | p.Q65Hfs*3 | Q13114 | protein_coding | TCGA-AR-A0TY-01 | Breast | breast invasive carcinoma | Female | <65 | I/II | Unspecific | Paclitaxel | PD | ||
| TRAF3 | insertion | Nonsense_Mutation | novel | c.1541_1542insTGGGCCCCGGGCGAGTGCTGGGGCGGGGTCCGTGGGATGAGGG | p.Asp515GlyfsTer13 | p.D515Gfs*13 | Q13114 | protein_coding | TCGA-AR-A0TY-01 | Breast | breast invasive carcinoma | Female | <65 | I/II | Unspecific | Paclitaxel | PD | ||
| TRAF3 | deletion | Frame_Shift_Del | c.1520_1523delNNNN | p.His507ArgfsTer21 | p.H507Rfs*21 | Q13114 | protein_coding | TCGA-AR-A1AI-01 | Breast | breast invasive carcinoma | Female | <65 | I/II | Chemotherapy | cytoxan | PD | |||
| TRAF3 | SNV | Missense_Mutation | c.26N>T | p.Ser9Phe | p.S9F | Q13114 | protein_coding | deleterious_low_confidence(0.02) | benign(0.037) | TCGA-C5-A1MK-01 | Cervix | cervical & endocervical cancer | Female | >=65 | III/IV | Chemotherapy | carboplatin | PD | |
| TRAF3 | SNV | Missense_Mutation | novel | c.1234G>A | p.Ala412Thr | p.A412T | Q13114 | protein_coding | tolerated(0.06) | benign(0.183) | TCGA-C5-A7X5-01 | Cervix | cervical & endocervical cancer | Female | >=65 | I/II | Chemotherapy | carboplatin | PD |
| Page: 1 2 3 4 5 6 7 |
Top |
Related drugs of malignant transformation related genes |
| Identification of chemicals and drugs interact with genes involved in malignant transfromation |
| (DGIdb 4.0) |
| Entrez ID | Symbol | Category | Interaction Types | Drug Claim Name | Drug Name | PMIDs |
| Page: 1 |

Copyright 2023-Present -The University of Texas Health Science Center at Houston |